HAL Id: hal-00299251
https://hal.archives-ouvertes.fr/hal-00299251
Submitted on 16 Jan 2006
HAL is a multi-disciplinary open access
archive for the deposit and dissemination of
sci-entific research documents, whether they are
pub-lished or not. The documents may come from
teaching and research institutions in France or
abroad, or from public or private research centers.
L’archive ouverte pluridisciplinaire HAL, est
destinée au dépôt et à la diffusion de documents
scientifiques de niveau recherche, publiés ou non,
émanant des établissements d’enseignement et de
recherche français ou étrangers, des laboratoires
publics ou privés.
Submarine landslides in the Santa Barbara Channel as
potential tsunami sources
H. G. Greene, L. Y. Murai, P. Watts, N. A. Maher, M. A. Fisher, C. E. Paull,
P. Eichhubl
To cite this version:
H. G. Greene, L. Y. Murai, P. Watts, N. A. Maher, M. A. Fisher, et al.. Submarine landslides in the
Santa Barbara Channel as potential tsunami sources. Natural Hazards and Earth System Science,
Copernicus Publications on behalf of the European Geosciences Union, 2006, 6 (1), pp.63-88.
�hal-00299251�
SRef-ID: 1684-9981/nhess/2006-6-63 European Geosciences Union
© 2006 Author(s). This work is licensed under a Creative Commons License.
and Earth
System Sciences
Submarine landslides in the Santa Barbara Channel as potential
tsunami sources
H. G. Greene1, L. Y. Murai2, P. Watts3, N. A. Maher4, M. A. Fisher5, C. E. Paull1, and P. Eichhubl6
1Monterey Bay Aquarium Research Institute (MBARI), 7700 Sandholdt Road, Moss Landing, CA 95039; Moss Landing
Marine Laboratories, 8272 Moss Landing Road Moss Landing, CA 95039, USA
2Moss Landing Marine Laboratories, 8272 Moss Landing Road, Moss Landing, CA 95039, USA 3Applied Fluids Engineering, Inc., 5710 E. 7th Street, PMB #237, Long Beach, CA 90803, USA 4AOA Geophysics, Inc., 7532 Sandholdt Road, Moss Landing, CA 95039, USA
5United States Geological Survey, MS 999, 345 Middlefield Road, Menlo Park, CA 94025, USA 6Stanford University, Department of Geological and Environmental Sciences, Stanford, CA 94305, USA
Received: 13 June 2005 – Revised: 26 October 2005 – Accepted: 15 November 2005 – Published: 16 January 2006 Part of Special Issue “Tsunami hazard from slope instability”
Abstract. Recent investigations using the Monterey Bay
Aquarium Research Institutes (MBARI) Remotely Operated Vehicles (ROVs) “Ventana” and “Tiburon” and interpreta-tion of MBARI’s EM 300 30 kHz multibeam bathymetric data show that the northern flank of the Santa Barbara Basin has experienced massive slope failures. Of particular con-cern is the large (130 km2) Goleta landslide complex lo-cated off Coal Oil Point near the town of Goleta, that mea-sures 14.6-km long extending from a depth of 90 m to nearly 574 m deep and is 10.5 km wide. We estimate that approxi-mately 1.75 km3has been displaced by this slide during the Holocene. This feature is a complex compound submarine landslide that contains both surfical slump blocks and mud flows in three distinct segments. Each segment is composed of a distinct head scarp, down-dropped head block and a slide debris lobe. The debris lobes exhibit hummocky topogra-phy in the central areas that appear to result from compres-sion during down slope movement. The toes of the western and eastern lobes are well defined in the multibeam image, whereas the toe of the central lobe is less distinct. Continu-ous seismic reflection profiles show that many buried slide debris lobes exist and comparison of the deformed reflec-tors with ODP Drill Site 149, Hole 893 suggest that at least 200 000 years of failure have occurred in the area (Fisher et al., 2005a). Based on our interpretation of the multibeam bathymetry and seismic reflection profiles we modeled the potential tsunami that may have been produced from one of the three surfical lobes of the Goleta slide. This model shows that a 10 m high wave could have run ashore along the cliffs of the Goleta shoreline.
Correspondence to: H. G. Greene (greene@mbari.org)
Several other smaller (2 km2and 4 km2) slides are located on the northern flank of the Santa Barbara Basin, both to the west and east of Goleta slide and on the Conception fan along the western flank of the basin. One slide, named the Gaviota slide, is 3.8 km2, 2.6 km long and 1.7 km wide. A distinct narrow scar extends from near the eastern head wall of this slide for over 2 km eastward toward the Goleta slide and may represent either an incipient failure or a remnant of a previ-ous failure. Push cores collected within the main head scar of this slide consisted of hydrogen sulfide bearing mud, pos-sibly suggesting active fluid seepage and a vibra-core pen-etrated ∼50 cm of recent sediment overlying colluvium or landslide debris confirming the age of ∼300 years as pro-posed by Lee et al. (2004). However, no seeps or indications of recent movement were observed during our ROV investi-gation within this narrow head scar indicating that seafloor in the scar is draped with mud.
1 Introduction
The concept of submarine landslides as major sources of tsunamis has recently reached a new high. This present con-cern is based on the disastrous July 1998 tsunami in Papua New Guinea that completely destroyed the villages around Sissano Lagoon and killed over 2200 people. Based on ex-tensive offshore investigations after the event, the tsunami probably was produced by a large submarine landslide lo-cated offshore from the village and triggered in part by a widely felt M7 earthquake (Tappen et al., 1999, 2001; Syno-lakis et al., 2002; Davies et al., 2003). Within about 10 min of the offshore failure and around 30 min after the main shock, a wave some 10 m high inundated the low-lying spit and
34 30'0"N o 34 0'0"N o 34 30'0"N o 34 0'0"N o 121 0'0"Wo 121 30'0"Wo 121 0'0"Wo 121 0'0"Wo 121 30'0"Wo 121 0'0"Wo Channel Islands platform
San Miguel Island
Santa Rosa Island
Santa Cruz Island Santa Barbara Pt. Conception Pt. Arguello OIL PLATFORM Kilometers 10 5 0 10 20 30 FIG. 4 FIG. 15 FIG. 12 FIG. 5, 14a, 16
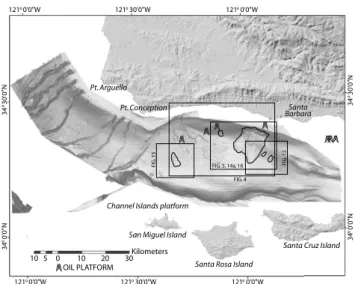
Fig. 1. Computer generated artificial sun-shaded relief image of
the Santa Barbara Channel from Simrad EM300 30 kHz multibeam bathymetric data showing area of study, oil platforms, and principal geographic locations. Cross-like symbols represent oil platforms. Boxes show location of other figures.
lagoon along which the villages were located and stimulated a world wide call for the study of such phenomenon so that future calamities can be prevented, or at least predicted and mitigated. This call has again been renewed after the “Box-ing Day” 26 December 2004 Sumatra M9+ earthquake that produced the Indian Ocean tsunami that left nearly 275 000 people dead or missing and more than a million others home-less.
It has long been known that submarine failures within re-stricted bodies of waters such as bays and fiords regularly occur forming distinct seafloor scars (Shepard, 1933; Hamp-ton et al., 1993; Prior et al., 1978, 1982; Plafker et al., 1969). Delta fronts exhibit slide scars produced from low angle failures of weak, fine-grained sediment (Prior et al., 1981). Failures on volcanic island flanks (Moore et al., 1989, 1994; Silver et al., 2005) and along the upper continental slope (Field and Edwards, 1980; Schwab et al., 1993; Lee et al., 1993, 2003; Field et al., 1999; Hampton and Bouma, 1977; Hampton et al., 1996) are also well known. All of these types of failures have produced local tsunamis in the past, some with large run-up that extensively damaged pop-ulation centers (i.e., in Alaska, the Turnagain Arm, Seward, and Valdez failures of 1964; Plafker et al., 1969; Wilson and Torum, 1972; Hampton et al., 1993) and others that could have caused major damage if the areas were occupied at the time of the event. Many of these landslide sites have been mapped in the past using seismic reflection profiling tech-niques and extensively sampled for geotechnical properties using corers. Through these studies initial criteria for the lo-cal generation of a tsunamis by a mass movement event have been established (Ward, 2001; Greene and Ward, 2003). In order to produce a tsunami of significant size (2–10 m height at the shoreline) that would have substantial (10–20 m) local
run-up elevation, a seafloor failure needs to be in interme-diate to shallow water depths, be generally no deeper than 1000 m, be of significant volume (i.e., greater than 2 km3), consist of stiff cohesive materials such as firm clay, and ac-celerate rapidly (Watts et al., 2000, Ward, 2001; Greene and Ward, 2003). Rules of thumb for landslide tsunami ampli-tudes are hard to come by because there are many different length scales that impact tsunami amplitude (Watts, 2004c).
Although much work, as noted above, has been done on specific submarine landslides to determine their history and cause of failure, much more work is needed to determine how a failure disintegrates and what the potential is for future mass movements. New technology, such as high-resolution digital multibeam bathymetric and backscatter mapping sys-tems, have produced images of many of the previously stud-ied landslides and have detected many others. These images exhibit such high-resolution (on the order of meters) features that the texture and detailed morphology of a slide surface can be resolved. In addition, modern observational and sam-pling capabilities provided with remotely operated vehicles (ROVs) allow for specific and selective sampling. We used such technologies to study the northern flank of the Santa Barbara Basin, an area of extensive mass wasting (Fig. 1).
While tsunamigenic landslides are generally thought to be triggered through seismic loading, many tsunamis can be generated from non-seismic related submarine failures. Other mechanisms that can stimulate mass movement on the seafloor include loading of slope sediment by storm waves or hurricanes, elevated sediment pore pressures from dewater-ing in response to tectonic compression or rapid increase of overburden pressures, reduction of stress by bubble phase gas expansive pressures, artesian pressures, seepage forces, gas hydrate disassociation, and sediment accumulations exceed-ing the angle-of-repose. If these non-seismogenic failures are large enough and accelerate rapidly enough, a tsunami can be produced. However, along active plate margins, such as in the Santa Barbara Basin region, seismicity can play a major role in generating tsunamigenic landslides.
The objectives of this study are to describe mass wasting along the northern flank of the Santa Barbara Basin using recently acquired multibeam data, seismic reflection profiles, ROV observations and seafloor samples collected by ROVs, to determine the causes for mass wasting and to assess the potential for future seafloor failures. In addition, we evaluate the geologic evidence for the cause of the 1812 tsunamis and selectively model a tsunami that may have originated from previous mass movement events.
1.1 Previous work
Seafloor failures along the northern flank of the Santa Bar-bara Channel were first described by Duncan et al. (1971). Later mapping and geohazards investigations in response to concerns about drilling for oil in the Santa Barbara Chan-nel and of mass movement were reported in a series of re-ports including the United States Geological Survey (1975) and Crissman and Ploessel (1979). Ploessel et al. (1979),
Thornton and Crissman (1979), Richmond (1981), Burdick and Richmond (1982) summarized hazards and engineering constraints for oil and gas development decisions while Ed-wards et al. (1982, 1993) presented seismic reflection profile data as evidence of slope failures in the Santa Barbara Chan-nel. Thornton (1984, 1986) used sediment data to show why landslides in the channel are spatially distributed. Vedder et al. (1986) and McCulloch et al. (1989) mapped landslides in the central California region at a scale of 1:250 000 us-ing seismic reflection profiles. Eichhubl et al. (2002) used EM 300 (30 kHz) bathymetric images to map mass move-ment features in the region. The largest and most conspicu-ous slope failure on the northern Santa Barbara Basin flank, the Goleta slide located south of Coal Oil Point, was initially mapped by Richmond et al. (1981) and later reported upon by Burdick and Richmond (1982) and Vedder et al. (1986, 1989). Another well-described submarine landslide is the Gaviota mudflow of Edwards et al. (1995) and Hampton et al. (1996) that was first described as flow H by Thornton (1984, 1986) and is located approximately 8 km west of the Goleta slide. Several other mass movement features gener-ally located along the lower slope extending westward from west of Ventura around the northern flank of the Santa Bar-bara Basin to the central part of the southern slope have been described as slides A through I by Thornton (1984).
2 Active tectonic setting
The Santa Barbara Basin is part of the Southern California Borderland Province and generally is a canyonless, transform margin basin (Fig. 1). It is the most northerly basin of a se-ries of basins, and unlike the other basins to the south, it is oriented east-west rather than northwest-southeast, the result of north-south compression. The basin has a maximum wa-ter depth of 589 m with 96% of the 2300 km2 area deeper than the shelf break comprised of slope (Thornton, 1984). The basin formed about 15 Ma by lateral shear along the Pacific-North American transform plate boundary (Crowell, 1974; Howell, 1976). It is a foreland basin of the southward propagating deformation front of the Santa Ynez Mountains (Yeats, 1981; Namson and Davis, 1988). Today active de-formation and uplift is documented by the dating of marine terraces and repeated precision leveling. For example, based on the dating of exhumed marine terraces the growth rate of the Ventura Avenue anticline, located north of Ventura, was found to be rising at a rate as high as 9 mm/yr (Lajoie et al., 1991; Rockwell et al., 1988; Fig. 2a) during the Pleis-tocene and 2 mm/yr today based on repeated precision level-ing (Sylvester, 2000). The basin itself is belevel-ing actively short-ened by compression as shortening rates across the basin measured by geodetic observations using very-long-baseline interferometry and global positioning systems range from 5– 8 mm/yr east of Ventura to approximately 2 mm/yr in the western part of the basin (Feigl et al., 1993; Larsen et al., 1993). Post-Miocene shortening also decreases from up to
34% near Ventura to 2% in the southern and western part of the basin (Sorlien et al., 2000).
The basin is flanked on the south by the Channel Islands comprised of Anacapa, Santa Cruz, Santa Rosa and San Miguel islands, the offshore extension of the Santa Monica Mountains to the east, and on the north by the Santa Ynez Mountains (Fig. 2a). The basin floor is generally flat, less than 0.4◦ slope, and has a maximum depth of 589 m with two sills, one, the Conception sill, at 470 m on the west and the other, the Hueneme sill, at 250 m on the east that separate the basin from the Pacific Ocean seafloor and restricts bot-tom circulation. The steepest slopes of the basin are located along the northern and southern flanks. An average slope of 2.5◦is found on the northern flank and 1.7◦on the southern flank. Locally the steepest slope is located below the edge of the San Miguel Island shelf at 20◦. The island shelf is the top
of the Channel Island platform and ranges from 5 to 10 km wide with the shelf edge generally located at the 100 m iso-bath. The mainland, or northern, shelf is variable in width ranging from over 15 km in the east with the shelf break at the 100 m isobath to 4.5 km offshore of Gaviota with a shelf break ranging from 85 m deep south of Santa Barbara to 50 m deep near Gaviota and then widening again to 8 km southeast of Point Conception with a shelf break at the 100 m isobath. Although some deep gullies are present near the eastern edge of the basin and discontinuous distributary channels are lo-cated on a submarine fan, the Conception fan, along the west-ern flank of the basin is essentially canyonless and conduits do not appear active (Fischer and Cherven, 1998).
Numerous faults and folds exist in the Santa Barbara Basin and generally trend East-West (Fig. 2a). The faults along the southern flank of the basin, near the base of the Channel Islands platform, exhibit normal displacements while those concentrated along the northern flank are reverse or thrust faults (Yerkes et al., 1981; Richmond et al., 1981; Burdick and Richman, 1982; Vedder et al., 1986; McCulloch, 1989; Sorlien et al., 1999, 2000; Keller and Gurrola, 2000; Eich-hubl et al., 2002). The Santa Cruz Island Fault is a right-lateral strike-slip fault, which offsets Santa Cruz Island along its east-west axis. The major reverse or thrust faults along the northern flank of the Santa Barbara Channel are, from west to east, the South Santa Ynez, North Channel Slope, Red Mountain, Pitas Point and Oak Ridge faults (Fig. 2a). These faults, including the Santa Cruz Island Fault, are considered active (Greene, 1976; Bortugno, 1977; Yerkes et al., 1981; Pinter and Sorlien, 1991; Jennings, 1994). Compressional deformation associated with fault movement in the Santa Barbara Basin is best illustrated by an uplifted and folded (anticlinal) block, known as the Mid-Channel Trend, located in the eastern part of the basin and bounded by faults of the Oak Ridge fault zone (Fig. 2b). This feature is the westward or offshore extension of the Oak Ridge anticlinorium mapped onshore north of Ventura (Greene, 1976; Greene et al., 1978; Yerkes et al. 1981; Vedder et al., 1989; Eichhubl et al., 2000, 2002).
Many earthquakes have been recorded in the Santa Bar-bara Basin region (Yerkes et al., 1981) and 15 earthquakes
MCT
NCSF
ODP Site 149-893
SCIF = Santa Cruz Island Fault SSYF = South Santa Ynez Fault NCSF = North Channel Slope Fault RMF = Red Mountain Fault
PPF = Pita Point Fault ORF = Oak Ridge Fault SYF = Santa Ynez Fault MCT = Mid channel Trend
Goleta Slide Gaviota Slide a
fault
fault
fault
fault
faults?
250 m 200 m 150 m 0 1 2 km N S 100 m 200 m 300 m 400 m
aligned p
ock
marks
V1501, 1502
0Oak Ridge fault
profile
5 km 2.5b
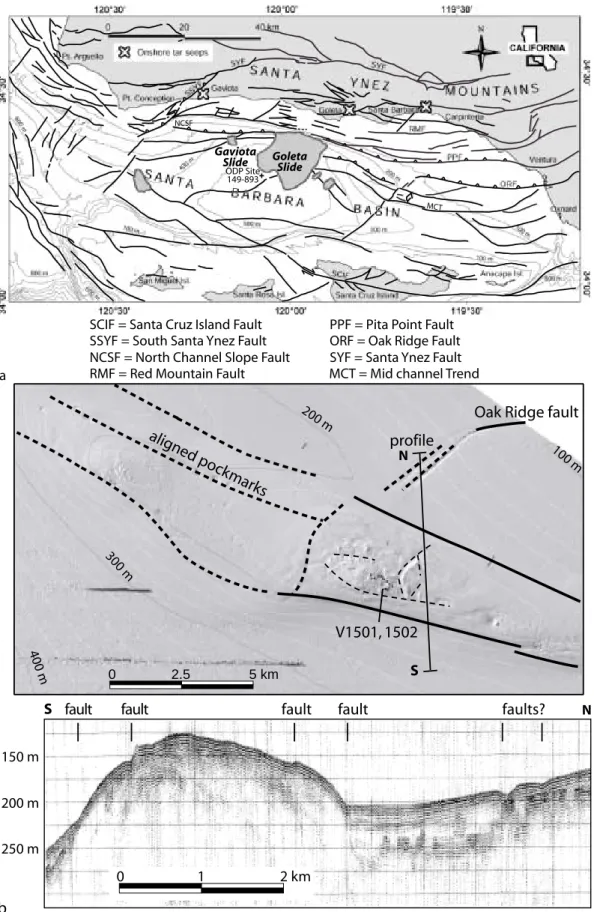
N SFig. 2. Fault map of the Southern California Borderland showing: (a) major geologic structures in the Santa Barbara Channel region and (b) EM300 multibeam bathymetric image of, and seismic reflection profile across, the Mid-Channel Trend (Santa Clara Ridge of Thornton,
1984), a major anticlinorium with seafloor expression in eastern Santa Barbara Channel. Modified after Eichhubl et al. (2002). Short dashed lines show tract of “Ventana” dives V1501 and V1502.
San Luis Obispo No Damage Reported Rancho de San Antonio 12/21 - V-VI San A ndr eas F ault 7.0-8.0 6.0-7.0 5.0-6.0 4.0-5.0 -0 50 100 kilometers Santa Inez
12/21 - VII Santa Barbara12/21 VI-VII La Purisima Concepcion 12/21 - VII? Rancheria de Mescaltitan? 12/21 - VII? Presidio de Santa Barbara VII
Possible extent of 12/21 damage due to westward directivity San Buenaventura 12/8 - VII? 12/21 - VII
San Fernando Rey 12/8 - VII 12/21 - VII
San Juan Capistrano 12/8 - VII
San Bernadino Valley 12/8 - VI+?
San Luis Rey de Francia 12/8 no damage San Diego 12/8 no damage San Cayetano Fault Gorman Previous 12/21 Epicenter Previous 12/8 Epicenter Current 12/8 Epicenter Wrightwood Cajon Pass MIl Potrero Fort Tejon 1919 1883 San Gabriel 12/8 - VII Proposed 12/21 Epicenter 1812/12/2 1 1812/12/8 San Jacint o Fault Garlock F ault 12/21 12/8 1916 Goleta slide
Fig. 3. Earthquake epicenter locations, re-locations, and Modified Mercali Intensity zones based on California Mission records of felt
earthquakes. Modified after Toppozada et al. (1981, 2003). Dots represent earthquake epicenters; blocks with crosses show location of Missions.
equal to or greater than M5.0 that occurred between 1800 and 1999 have been mapped in the immediate area (Toppozada et al., 2000) and indicate that active tectonic deformation is on-going. Fault-plane solutions indicate a general reverse left-oblique slip on the east-west trending faults along the north-ern basin flank (Yerkes et al., 1981). The largest historical earthquakes within the Santa Barbara Basin region occurred in 1812 (M7.1 and 7.5) and 1925 (M6.8). The epicenters for both of these earthquakes had been located in the central part of the basin (Toppozada et al., 2000) near the base of the northern flank (Fig. 3). However, recent work by Dolan and Rockwell (2001) along the San Cayetano fault onshore in the Santa Ynez Mountains shows 4.5 m of reverse slip offset on a very young surface rupture within historical alluvium. The amount of slip on this fault suggests it was created by a M7.2–7.5 earthquake. Dolan and Rockwell (2001) speculate that since the rupture surface is overlain with historical allu-vium and carbon 14 analyses gives a post-1660 date that it could represent the source for the 21 December 1812 event. Also, Toppozada et al. (2002), based on California Mission records of recorded intensities and damage caused by earth-quakes relocated the earthquake epicenters of 1812 and pro-pose that they occurred along the San Andreas Fault rather than along a fault within the Santa Barbara Channel (Fig. 3).
3 Methods
Several methods were used to investigate the mass movement features within the Santa Barbara Basin including the inter-pretation of digital multibeam bathymetric images, seismic reflection profiles, and in situ observations and seafloor sam-pling using Remotely Operated Vehicles (ROVs). In addi-tion, we utilized the results of ongoing investigations into fluid flow and sedimentation within this highly productive hydrocarbon provenance.
3.1 Multibeam bathymetry and backscatter data
High-resolution multibeam bathymetric and backscatter data using a 30 kHz Simrad EM300 hull-mounted adjustable-angle sonar on board the R/V “Ocean Alert” by C&C Tech-nologies, under contract to the Monterey Bay Aquarium Re-search Institute (MBARI) were used in this study. Shore-based differential GPS provided positioning with an esti-mated accuracy of <3 m. The multibeam system consisted of an array of 130 beams that is adjustable between 80◦to 150◦ to compensate for changes in swath width with variations in water depth. A 1◦beam width (2◦ at water depth <250 m) gave a sonic footprint of about 3% of water depth. Depth was determined by a combination of phase and amplitude detec-tion, resulting in vertical and horizontal resolution of 0.2%
-100 -200 -300 -400 -500 -600 Km 0 1 2 4 6 8 10 120 20'0"Wo 120 15'0"Wo 120 10'0"Wo 120 5'0"Wo 120 0'0"Wo 119 55'0"Wo 120 20'0"Wo 120 15'0"Wo 120 10'0"Wo 120 5'0"Wo 120 0'0"Wo 119 55'0"Wo 34 25'0"N o 34 15'0"N o 34 20'0"N o 34 25'0"N o 34 15'0"N o 34 20'0"N o
Concepcion Fan slide
Gaviota slide
Goleta slide
East slide 1 East slide 2 Coal Oil Pt.
Fig. 4. Detailed map of seafloor morphology of the Santa Barbara
Basin. Computer generated hill shaded bathymetric image based on EM300 multibeam bathymetry.
-200 -300 -400 -500 -600 -100 -Km 0 1 2 4 6 8 10 MCS 1864 MCS 186 6 authigenic carbonate Mbari ROV tracklines Vibracore (T809-VC1) T809, 810 T153 T811 T812 T813 T814 V1495 T815 V1499, 1500 T816 V1503 T817 V1490, 1491, 1504 V1494 T818 T155 T154
Fig. 5. Map showing locations and track lines of MBARI ROVs
“Tiburon” and “Ventana” transects and location of USGS seismic reflection profiles along the northern flank of Santa Barbara Basin.
and 2% of water depth, respectively. The mapped area gen-erally extends from Latitude 34◦100N to Latitude 34◦270N
and Longitude 120◦300W to Longitude 120◦320N covering an area of over 3000 km2. Due to the limited swath width at water depths of less than 100 m, the northern and south-ern boundaries of the mapped area follow approximately the break of the mainland and island shelves (Fig. 1). Bathymet-ric and backscatter data were gridded and mosaiced using software by Larry Meyer and John Hughes Clarke, Univer-sity of New Brunswick. The whole data set was binned to a 20-m grid, and selected shelf regions to a 5-m grid. Shaded relief images were produced using ArcInfo® and the 3-D rendering software Fledermaus (i.e. Fig. 4). Final processing of the data was done using the software package MB-System. Several bathymetric grids and acoustic backscatter images of multiple resolutions were created for the survey area,
includ-0.2 ponded sediment 0.024/2s = 20.2 m 8.1-11.7 Ka 0.035/2s = 29.4 m 11.8-17.0 Ka 0.4 0.6 0.8 debris lobe slump block
buried slide deposit
landslide deposit USGS-MCS 1864 ~ 1.0 km 0.2 sec (tw o-wa y ) S N a T810 ponded sediment 0.031/2s = 26.0 m 10.4-15.1 Ka 0.052/2s = 43.7 m 17.5-25.2 Ka debris lobe slump blocks
buried slide deposit landslide deposit 0.2 0.4 0.6 0.8 USGS-MCS 1866 ~1.0 km 0.2 sec . (tw o-wa y ) S N b
Fig. 6. Interpreted seismic reflection profiles collected by the USGS
and map showing locations of track lines: (a) USGS Line 1864. (b) USGS Line 1866. See Fig. 5 for track line locations.
ing the area of our interest along the northern flank of the Santa Barbara Basin. The resolution of the data sets pro-duced from the latest processing range from 40 to 25 m grid cells (or 20 to 15 m acoustic backscatter pixel sizes) depend-ing on water depth. This data set is published in a CD-ROM (MBARI Seafloor Mapping Team, 2001).
3.2 Seismic reflection profile data
Additional high-resolution and intermediate penetration multi-channel seismic reflection data were collected by the USGS across the Goleta slide (Fisher et al., 2005a; Figs. 5 and 6). Several lines of the USGS high-resolution 2 KJ mini-sparker 24 fold 1.5–1.7 kHz seismic reflection profiles were stacked and deconvolved and used in the interpretation of the subsurface part of the Goleta slide (Fig. 6). These data are part of a larger data set that were collected in the Santa Bar-bara Channel by the USGS in 2002 and reported upon by Fisher et al. (2005a).
3.3 ROV investigations
Selected morphologic features of the northern margin of the Santa Barbara Basin were examined visually and seafloor samples collected using MBARI’s ROVs “Tiburon” and “Ventana”. “Ventana” dives were made from the R/V “Point Lobos” over a 10-day period in October 1998, while the “Tiburon” dives were made from the R/V “Western Flyer” during a three-day period in May 2001 and in a five-day period in February 2005. Dive observations using closed-circuit digital video were complemented with shipboard and shore-based analyses of grab samples and shallow (<1 m) sediment push cores collected during the ROV dives. “Ven-tana” is an ROV capable of diving to a depth of 1850 m and can collect push core sediment samples (20 cm deep), rock samples, and video. “Tiburon” is capable of reaching a depth of 4000 m and also is able to obtain a like suite of data as well as longer (80–90 cm) vibra-cores. Vibra-cores were col-lected during February 2005 as part of an engineering study and will be reported upon at a later date, but several cores shed light upon this investigation and are reported herein.
In 1998 “Ventana” dive V1494 was made on the toe of the eastern lobe of Goleta slide and “Tiburon” dive T818 of February 2005 was made along the apparent erosional edge of the eastern lobe in the gully that runs along the area of accumulation (Fig. 5). “Ventana” dives V1495, V1499, V1500 and V1503 of October 1998 were made along the head walls of the western and central segments of the slide during MBARI’s “Point Lobos” cruises of October 1998 (Fig. 5). In addition, in February 2005 “Tiburon” dives T814, T815, T816, and T817 where made in the headward parts of the western, central and eastern heads of the Goleta slide. In 2001, and again in 2005, “Tiburon” dives T153, T809, T810, and T812 were made along the headward parts of the Gaviota slide with “Tiburon” dive T813 located in the zone of accumulation of the eastern lobe of the slide. “Tiburon” dive T153 and T811 was made in the propagating crack.
4 Tsunamis
In 1812 three large earthquakes occurred in the Santa Bar-bara region, two of magnitude 7.1 and 7.5 on 8 December and one, magnitude 6.8, on 21 December with aftershocks last-ing until April 1813 (Toppozada, 2002). These earthquakes caused extensive damages from San Juan Capistrano to San Diego. There were several reports of sea waves that may have been associated with these earthquakes. Senan (1813) re-ported upon a sea inundation at the Rancheria de Mescaltitan in Santa Barbara (Fig. 3) stating, “People from the Rancheria are living on the plains around the Mission, to where they withdrew since they were very close to the ocean, which threatened to flood them.” In this same document Senan (1813) reported upon a similar effect in San Buenaventura (Ventura) where he stated, “. . . it has been necessary for us to withdraw for now, for somewhat more than half a league inland, for fear of the ocean, which we knew had flooded in
two parts” (Toppozada et al., 2002). Englehardt (1897) also reported upon the fear of ocean inundation at Buenaventura. In addition, Toppozada et al. (2002) reported upon some less reliable reports (Trask, 1856; Bancroft, 1888) written many years after the earthquakes that reported upon the sea waves. One such incident reported occurred at Refugio where it was said that “. . . a ship was carried up a canyon by the wave and returned to the sea” (Townley and Allen, 1939). Another incident, reported by Trask (1856, 1864) states that “. . . an immense wave flowed 1 to 2 miles inland near Refugio but did little damage.” Toppozada et al. (1981) concluded from these reports that sea waves were associated with the earth-quakes of 1812. They speculated that the source of the sea waves is a tsunami or seiche or a submarine landslide that occurred in the Santa Barbara Channel.
5 Fluid flow
The Santa Barbara Basin is a major active hydrocarbon province with many producing platforms (Fig. 1), although production is declining. Evidence of active and dormant fluid seeps in the Santa Barbara Basin have been observed as ac-tive venting of gas and oil, bacterial mats, precipitates of au-thigenic carbonate, and mud and tar volcanoes (Eichhubl et al., 2000, 2002). The Cretaceous to Holocene sequence of clastic and hemipelagic sedimentary units mapped in and ad-jacent to the basin includes organic-rich siliceous mudstones of the Miocene Monterey Formation that is both a source and a fractured reservoir of hydrocarbons (Issacs, 1981). Eich-hubl et al. (2000) state that while the northern flanks of the basin, being part of the southern Santa Ynez Mountains, are rising, the central part of the basin is undergoing sedimenta-tion and progradasedimenta-tional burial. This progadasedimenta-tional burial, as well as diagenesis, in the synclines, produced from the trans-pressive shortening of the basin, drive hydrocarbon genera-tion and pore fluid expulsion, leading to submarine venting and seeping of natural gas and oil (Vernon and Slater, 1963; Allen et al., 1970; Wilkinson, 1972; Fischer and Stevenson, 1973).
Due to the low matrix permeability of the Miocene Mon-terey Formation siliceous mudstones, fluid flow within the Monterey Formation and adjoining younger strata of the Santa Barbara region depend on the presence of conduc-tive fractures and faults (Eichhubl et al., 2000; Eichhubl and Boles, 2000a). Evidence of past focused fluid flow along faults is seen in surface outcrops and core samples collected across faults onshore that are extensively cemented with carbonate (Eichhubl and Behl, 1998; Eichhubl and Boles, 1997) and offshore along the southern branch of the Santa Ynez fault zone (Fig. 7). Based on mass balance estimates of the fluids involved in fault cementation, Eichhubl and Boles (2000b) inferred that faults channel fluid migrating up along the tilted flank strata of the basin, providing cross-stratigraphic pathways for fluid expulsion to higher strati-graphic levels and to the surface.
0 1,000 2 ,000 4,000 6,000 Meters Scale 1:100,000
Fig. 7. EM 300 multibeam bathymetric image showing alignment
of possible carbonate mounds along the offshore trend of the South Santa Ynez Fault (dashed line).
a b
c d
40 60 80 100 cm
0 20
e
Fig. 8. Photos obtained during MBARI ROV dives: (a) photo
of bubbles seeping out of seafloor in Santa Barbara shelf near the head of the Goleta slide complex (photo width ∼1 m), (b) tar paddy (∼20 cm in diameter) on mud volcano with gas bubbles NW of Gaviota slide, (c) head scarp of Gaviota slide (push core
∼20 cm long), (d) bacterial mat in zone of excavation near head of
Gaviota slide (distance between laser dots ∼20 cm), (e) split vibra-core taken in head of Goleta slide during ROV dive T809 show-ing chaotic landslide deposits below 50 cm mark; note smooth light gray mud surface at ∼95 cm, possible slide plain.
As part of this study we used MBARI’s ROVs “Tiburon” and “Ventana” to observe active hydrocarbon seeps within the Santa Barbara Basin. These seeps occur predominately in areas where bedrock is either exposed or thinly covered with Holocene sediment, specifically on the northern shelf of the Santa Barbara Channel and on the Mid-Channel Trend, a structural and morphologic high in the eastern part of the channel (Figs. 2b and 8a). The seeps we observed are
contin-Seep Distribution August 1996 0 0.5 1 km Goleta Slide La G oleta S eep
Coal Oil Point An
t iclines S o u t h E l l w o o d A n t i c l in e Sisquoc outcrop Platform Holly Monterey outcrop Goleta
Fig. 9. Structure and gas venting sites on the northern continental
shelf adjacent to the head of Goleta slide. Modified after Quigley et al. (1999).
uous or intermittent and release gas bubbles and to a lesser extent oil droplets from crevices in rocky substrate or from circular openings within muddy substrate. At Coal Oil Point, gas seeps occur along two linear trends following faulted an-ticlines that trap hydrocarbons in the fractured Monterey For-mation (Quigley et al., 1999; Fig. 9). South of Gaviota, ac-tive gas seeps were observed from a series of mud volcanoes, measuring about 10 m in diameter and 4 m high (Fig. 8b). Less vigorous gas venting was observed at several locations along the head scarp of the Goleta slump (Fig. 8a). Joan et al. (2000) stated that Beggiatoa sp. bacterial mats suggest a low flux of methane and Eichhubl et al. (2000) suggested the same thing based on the high sulfide and alkalinity values of pore water that they extracted from shallow sediment cores within the mats. In addition to the active vent sites, evidence of slow seeping rates were found at the toe of Goleta slide and along the linear depression leading away from the south-ern edge of the Goleta slide as well as at the base of a fairly consolidated head scarp of Gaviota slide (Figs. 8c, d).
Keller (1995) and Eichhubl et al. (2000, 2002) conclude that active gas venting in the Santa Barbara Basin is clearly controlled by subsurface structures such as faults and faulted anticlines. At Coal Oil Point, the Molino-Gaviota, Coal Oil Point, and South Ellwood anticlines located inshore (east) of the head of the Gaviota slide (Fig. 9) exhibit a remarkable trend of gas venting from the underlying reservoirs. Fault control of the hydrocarbon fluid flow is consistent with the model of focused basinal fluid migration along faults as in-ferred from outcrop and core observations (Eichhubl et al., 2000). The head scarp of Goleta slump where evidence of increase venting was observed does indeed follow regional fault and anticlinal trends (Fig. 9).
6 Sedimentation
The mainland shelf and the western flank of the Santa Barbara Basin is the area of highest sedimentation within
FAN-DERIVED SIL
T
HEMIPELAGIC CORE
Santa Rosa Island Santa Cruz Island San Miguel Island best-sorted Point Conception Coal Oil
Point Santa Barbara
Ventura River Ventura Santa Clara River Anacapa Island Concepcion Fan Gaviota Goleta East 1&2 0 10 20 km 60% silt 50% silt 50% clay 30% silt 30% sand 100m 250m 100m 250m 550m CURRENT-WINNOWED SAND RIVER-DERIVED SILT
Fig. 10. Map showing distribution of sediment during times of floods. Modified after Thornton (1984).
the Santa Barbara Channel region. Approximately 90%
of terrigenous sediment input into the region is from point sources comprised of the Ventura and Santa Clara rivers lo-cated east of our study site with the remainder (∼10%) com-ing from coastal streams, shoreline erosion and from the west around Point Conception to Conception fan (Fleischer, 1972; Thornton, 1984). Thornton (1984) completed very comprehensive analyses of the relative importance, disper-sal pathways, and patterns of transport of fine-grained sedi-ment based on the analyses of piston cores. This sedisedi-ment input is fine-grained with most of the basin beneath 200 m water depth containing less than 10% sand. Previous work-ers have shown that sediment is distributed primarily by the Anacapa Current, a strong (25 cm/s) west-northwest 200-m-thick current that flows toward Coal Oil Point (Kolpak, 1971; Drake et al., 1971; Pirie and Steller, 1977; Edwards and Gorsline, 1978; Thornton, 1981). The fine-grain sed-iment distribution and winnowing pattern of this current is illustrated by the 70% silt isopleth that shows current dis-tribution as a finger emanating from the Hueneme sill and pointing northwest (Fig. 10). Flood plumes emanating from the Ventura and Santa Clara rivers show a similar pattern of sediment distribution (Fig. 10; Thornton, 1984). The fine-grained sediment (silt and mud) accumulate along the western flank of the Santa Barbara Basin having been swept northwestward along the shelf and over the shelf break to produce a prograding-like shelf edge. Calculated sediment accumulation rates along the western flank of the Santa Bar-bara Basin range from 173 cm/Ka to 200–250 cm/Ka, at the lower to mid-slope areas (Thornton, 1984; Edwards et al., 1995; Eichhubl et al., 2002) and 0.8 to 1.9 cm/ky in the vicin-ity of Gaviota slide (Lee at al., 2004).
7 Mass wasting
The EM300 multibeam bathymetry and backscatter data col-lected in the Santa Barbara Basin images the seafloor mor-phology in much greater detail than has been shown previ-ously (Fig. 4). These data show mass wasting features
com-prised of rills, sediment flows and slumps. Seven distinct mass movement features that compare in location, but not in geometry to Thornton’s (1984, 1986) flows A and C through H (his flows B and I not seen) have been imaged. The largest mass movement feature, and the dominant geomorphic fea-ture in the region is the 134-km2Golita slide complex whose head scar is located 5 km offshore (northwest) of Coal Oil Point near the town of Goleta, which is located 6 km west of Santa Barbara. The second and third largest features are located at the base of the southern flank of the Santa Barbara Basin north of San Miguel and Santa Rosa islands, slides C (∼20 km2) and D (∼24 km2)of Thornton (1984), but were not found in the MBARI multibeam bathymetry and may be buried. On the mid-slope of the western margin of the Santa Barbara Basin an ∼14 km2landslide exists, slide A of Thorn-ton (1984), that is the fourth largest mass movement feature in the region. A landslide called here the East slide 2 is the fifth largest (4.15 km2) in the region and lies on the mid-slope of the southwestern flank of the Mid-Channel Trend, approximately 5 km southeast of the main body of Goleta slide (Fig. 4). The next largest feature is on the western flank, but the best described and most studied mass movement fea-ture in the region, is the Gaviota slide located 10 km offshore (due south) of Gaviota Point and 8 km due west of the main body of the Goleta slide (Lee and Edward, 1986; Edwards et al., 1995; Hampton et al., 1996). Other smaller mass move-ment features and rills or gullies are scattered about the mid-to lower-slope of the northern flank of the basin and a zone of intense gullies, longitudinal cracks and incipient slides exist between the Goleta slide and Gaviota slide. We use the termi-nology of Varnes (1978) as modified by Edwards et al. (1995) and Hampton et al. (1996) to describe mass movement com-ponents in this paper.
7.1 Goleta slide
The Goleta slide is a complex compound slide that is 14.6 km long and 10.5 km wide with the latest seafloor surface dis-placement volume of 1.51 km3(Fig. 11a). It has as many as 24 individual minor or major flow lobes and slump blocks
Rilled Slope Zone of Pockmarks
(gas seeps)
Prograding Shelf Edge
a GAVIOTA SLIDE GOLETA SLIDE EAST SLIDE 1 EAST SLIDE 2 Km 0 1 2 4 6 8 10
West Section Central Section
East S ection -200 -300 -400 -100 -500 -600 STRATIGRAPHIC SEQUENCES Initial displacement mass Second generation flow
Sub-failure after second generation flow Third generation flow
Fourth generation flow Side failure
Head block Head wall Head wall flow
Area of A ccumula tion Area of Eva cuation b
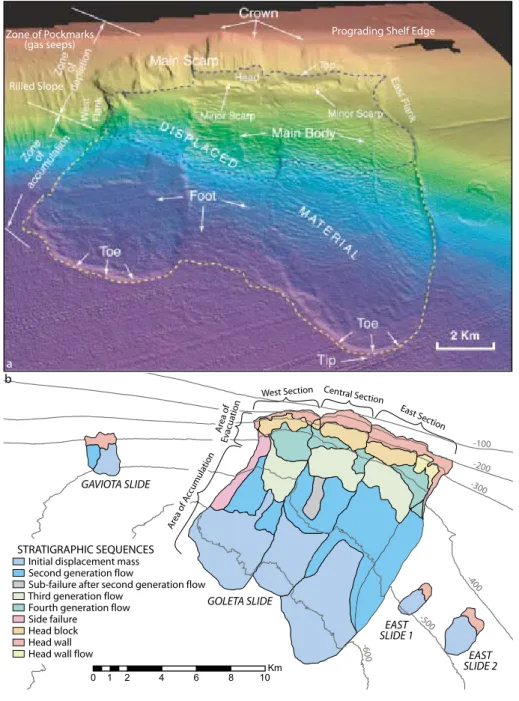
Fig. 11. The Goleta slide complex: (a) slope shaded EM300 multibeam bathymetric image showing multiple lobes, failure masses, slump
blocks, and scars of the Goleta slide; classification of Goleta slide is made using terminology of Varnes (1978), (b) sub-components of Goleta and other slides in the Santa Barbara Channel showing the many lobes, flows, and blocks that produce this complex compound mass movement feature.
expressed on the surface of the slide (Fig. 11b). The slide can be divided into three major segments (lobes), the eastern, central and western segments, that are comprised of distinct head scars, blocks, secondary deposits, and displaced masses (Fig. 11). Seismic reflection profiles show multiple subsur-face failures identified by buried packages of chaotic reflec-tors that have a very irregular hummocky surface overlain by acoustically transparent units. This stratigraphy is illustrated on the USGS seismic reflection profiles (Fig. 6; Fisher et al., 2005a).
7.1.1 Eastern segment
The eastern segment is the largest of the three distinct surface lobes mapped (Figs. 11 and 12) with the top of its 150 m high head or main scarp located in 150 m of water and a fairly in-tact head block and debris lobe at the base of the scar. The head block covers an area of ∼1.2 km2, has a minor scarp of 20 m high giving it a volume of ∼0.24 km3. The head block is not laterally continuous across the base of the head scarp with about the eastern third of the base being composed of two distinct headwall flows rather than a head block. A flow
apron of displaced material separates the head block and de-bris lobe from the minor scarp in the mid-eastern part of the zone of evacuation. The main scarp and depletion zone ap-pear as a generally smooth, hummocky surface with many transverse ridges (compression ridges) that extend to a wa-ter depth of about 450 m. A very lobate-shaped displacement mass comprises the main body of the slide in the zone of ac-cumulation. Here the displaced material is divided into two sections, the main mass and a narrow secondary side mass that probably resulted from differential movement between the two sections (Figs. 11 and 12). Both sections exhibit distinct well-developed transverse or compression ridges, in-dicators of a pulsing flow (Lee et al., 1993). The eastern boundary of this two-section displacement mass is defined by a deep narrow gully that converges with an east-trending rill near the top of the main body of the slide (Fig. 12) and shows distinct bedforms (i.e., sediment waves) at its mouth and levee morphology on top of the landslide deposit along its western lobe, indicative of sediment transport or strong currents flowing down the gully. At the boundary between the zone of depletion and zone of accumulation an east-west trending gully located on the slope east of the Goleta slide ap-pears to have been cut-off by the slide. This gully lies above, and is parallel to, the subsurface mapped Pitas Point-Ventura fault (Vedder et al., 1986; Fisher et al., 2005a). The toe at the eastern lobe is hummocky to smooth and lies at a depth of 574 m and rises 9–10 m above the undisturbed sediment. Inclination of the head scarp is 40◦to 45◦with the slope just at the base of the scarp reaching 27◦that then flattens to 1.5◦ near the toe. The overall head to toe average is 2◦.
The seismic reflection profiles (Figs. 5 and 6) indicate that the eastern lobe was deposited above at least 5 previous slide deposits (Fisher et al., 2005a). Interpretation of the seismic reflection profiles indicates the flat shelf seafloor north (land-ward) of the eastern segment head scarp is underlain by steep (∼20◦) southward dipping beds of probable Miocene Mon-terey Formation rocks. Two intact slump blocks are imaged in USGS Line 1866, which are located between the base of the head scarp and the upper part of the slide mass. One sig-nificant observation made from the seismic reflection profiles is that the slump block appears to have dammed sediment be-hind it after it came to rest at the base of the head scarp of the center lobe (Figs. 6a, b). These data nicely image buried slide deposits and blocks indicating that multiple failures have oc-curred in the past with at least four stacked sequences shown. “Tiburon” ROV dive T1494 was made on 7 October 1998 and traversed from south to north across the eastern toe of the eastern lobe and back south again to the base of the toe’s tip (Fig. 5). At the start of the transect, outside of the slide, white bacterial mats were found and sampled. The base of the slide toe was easily identified from a ∼2 m high scarp. From this scarp the toe rises another 2 m to the tip. The transect into the displaced material of the eastern lobe encountered up to 4 small, yet distinct bacterial mats and mounds. However, no gas seeps were seen and the seafloor was covered with mud. Tiburon dive T818 of February 2005 was made down into the gully that runs along the area of accumulation of the
Scale 1:75,000
Km
Bacterial mats
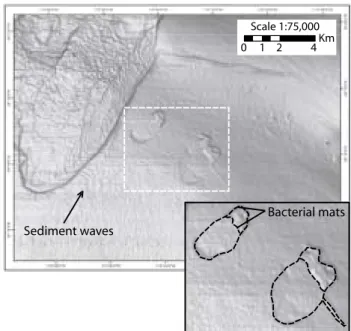
Fig. 12. EM300 30 kHz multibeam slope-shaded bathymetry of
the eastern lobe of Gaviota slide and adjoining area showing East slides 1 and 2. Note evidence (sediment waves) of sediment or current flow down channel that delineates the eastern edge of the eastern lobe of Goleta slide.
eastern lobe where mainly a mud covered floor was found and no evidence of recent erosion was seen. The head scarp of the eastern segment of Goleta slide complex was not in-vestigated by ROV, but a secondary scarp was briefly visited during Tiburon dive T810 to determine if any slump block material was exposed (Figs. 5 and 6a). Unfortunately the slope was mud covered and no slump material was found. Gas seeps were observed within 2.5 km of the head scarp of the Goleta slide’s eastern segment during Tiburon dives T1490, T1491, and T1504 (Figs. 5 and 8a). Here extensive curtains of gas were observed venting from the sea floor. 7.1.2 Central segment
The central segment is shorter and narrower than the other two segments and appears to have erosional scarps forming the sides of the displaced material in the zone of depletion (Fig. 11). The top of the 200-m high head scarp lies in 90 m of water and has a well-defined head block at the base that lies between 300 m and 400 m of water and covers an area of
∼0.56 km2. The head scarp itself is heavily gullied contain-ing a higher (∼13/km2)density of gullies per area than either the eastern (∼11/km2)or western lobes (∼2/km2). Below the head block the zone of depletion is generally smooth with the lower part containing transverse or compression ridges, similar to the eastern lobe. Along the base of the secondary scarp, a smooth surfaced sediment flow with a distinct toe appears to have flowed out from the west, from the western segment head scarp, to cover a portion of the central segment debris apron. Runout of the central lobe is shorter than those lobes on either side with the apparent toe at a depth of about
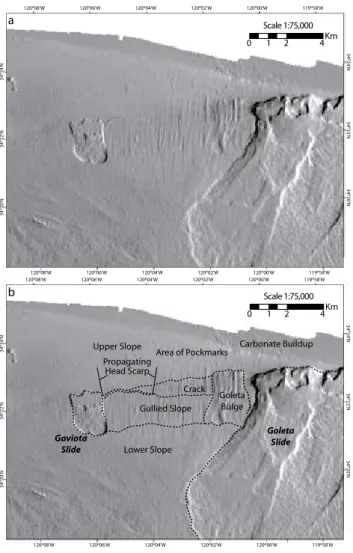
Km 0 1 2 4 Scale 1:75,000 a 120o08'W 120o06'W 120o04'W 120o02'W 120o00'W 119o58'W 34 o20'N 3 4 o22'N 3 4 o24'N 34 o 24'N 3 4o 22'N 3 4 o 20'N 120o08'W 120o06'W 120o04'W 120o02'W 120o00'W 119o58'W Gullied Slope Crack Gaviota Slide Goleta Slide Goleta Bulge Upper Slope
Area of Pockmarks Carbonate Buildup
Propagating Head Scarp Lower Slope Km 0 1 2 4 Scale 1:75,000 b 120o08'W 120o06'W 120o04'W 120o02'W 120o00'W 119o58'W 34 o20'N 3 4 o22'N 3 4 o24'N 120o08'W 120o06'W 120o04'W 120o02'W 120o00'W 119o58'W 34 o 24'N 3 4 o 22'N 3 4 o 20'N
Fig. 13. The Western segment of Goleta slide and propagating
crack: (a) slope shaded EM300 multibeam bathymetry showing the western lobe of Goleta slide and adjoining area including the Gaviota slide (mudflow of Edwards et al., 1975) and propagating head crack, (b) interpretations of morphologic features.
560 m. A small (4.97 km2in area) secondary flow is seen in the displaced material of the lower zone of depletion. The toe is less distinct with no raised tip, but appears to have a larger area of disturbed sediment in front of its toe than seen in the western lobe.
Inclination of the main scarp is generally less than found at the head scarp of the eastern lobe with a lower scarp angle of 11◦and an upper scarp angle of 40◦to 45◦that then flattens to 0.7◦near the toe. The overall head to toe average is 8.5◦.
The seismic reflection profile that crosses the central seg-ment (USGS Line 1864, Fig. 6a) shows several buried slide events, similar to what occurs beneath the eastern segment (Fisher et al., 2005a). The surface of separation (sole) of the lower part of the central lobe appears to be ∼68 m (cal-culated as follows: 0.08 s×∼1700 m/s/2) deep beneath the zone of accumulation.
“Ventana” ROV dive V1503 of 12 October 1998 was made along a transect that extended from the western head scarp of
the central segment approximately along the 250 m isobath near the head of the gullies at the top of the central head scarp (Fig. 5). Much of the dive was uneventful with the seafloor being generally composed of mud sediment. However, near the base of the steeper part of the head scarp, at 150 m water depth, rocks were found scattered about and many were of carbonate origin. About half way up the steep head scarp, in
∼125 m water depth, rocky outcrops occurred and gas was observed seeping out of the rocks. Rock samples collected at the top of the head scarp in ∼110 m of water were com-prised of gravels and sands cemented with authigenic high-magnesium calcite, aragonite, and dolomite (Eichhubl et al., 2002; Fig. 5). In February 2005, “Tiburon” dive T816 was made up the steep western part of the central segment head scarp where a mud coated slope was observed.
7.1.3 Western segment
The western segment is the second largest of the three seg-ments (Fig. 13). Its head scarp is not as well formed or as steep as the other two segments. The head wall appears to be composed of slumped material, not distinct head blocks such as observed in the central and eastern segments. In ad-dition, the head scarp of this segment can be divided in two, a western and eastern scarp. The western scarp is larger in area (∼0.32 km2) than the eastern scarp (∼0.08 km2) with the western scarp having a steeper upper element. Both scarps have a median dip of ∼10.6◦with a fairly smooth de-bris apron at their bases. The eastern dede-bris apron appears to spread over to the central segment abutting the minor scarp of the central segment head block. Within the western segment the smooth surfaced debris apron partially covers displaced material with weakly developed transverse ridges within the zone of depletion. Within the zone of accumulation two dis-tinct displaced material flows exist with the one on the upper slope divided into a larger eastern (∼4 km2)and a smaller western (∼3.8 km2) section and the lower slope forming the major portion of the displaced material in the zone of accu-mulation (Fig. 11b), both have a generally smooth surface with no transverse ridges. The toe of the lobe is well devel-oped with a distinct tip and does not extend as far out as the eastern lobe, but extends further down slope than the cen-tral lobe terminating at a depth of about 560 m. Similar to the seafloor in front of the central lobe, an area of disturbed sediment exists, but is narrower in width then observed for the central lobe. A narrow secondary side failure is observed along the western edge of this segment, which lies within the zone of accumulation. It appears to represent one of the latest failures within this segment, which has been dated at about 6 to 8 ka by Lee et al. (2004) and Fisher et al. (2005a).
Seismic reflection profiles across this lobe also indicate that many previous slide events have occurred and that as many as 5 different flows can be identified. This indicates that the western segment of Goleta slide is similar to the other segments and is comprised of buried slide masses (Fisher et al., 2005a).
Three “Ventana” ROV dives (V1495, V1499 and V1500) were made in and around the head of the western segment during the October 1998 set of dives (Fig. 5). One dive, V1495, started at the western side head scarp of the western segment and traveled up slope to the top of the scarp where it turned north to transect most of the shelf at the head of the western segment. A sample of authigenic carbonate arago-nite, an indicator of previous fluid flow or methane gas vent-ing, was collected at the top of the central head scarp and at the top of the central segment head scarp. The other “Ven-tana” dive (V1499), along with dive V1500, traversed the western head scarp edge of the western segment starting at the western side of the central segment head scarp and trav-eled eastward along the edge of the shelf where they were terminated on the shelf. Authigenic aragonite carbonate was recovered along the shelf near the edge of the head scarp. Recent ROV dives using “Tiburon” (dives T814 and T815) indicated that the area is well covered with mud.
7.2 Gaviota slide
The Gaviota slide has been well described by Edwards et al. (1995) and Hampton et al. (1996), a feature they called the Gaviota mudflow. Using seismic reflection profiles these au-thors were able to well delineate the slide and found that sev-eral flow events have occurred. Lee and Edwards (1986) con-ducted a geotechnical study of the Gaviota mudflow using a series of core samples and an extensive set of static triaxial, cyclic triaxial and consolidation tests. The authors showed that moderate shaking from an earthquake could have caused the failure. The results were reinterpreted by Lee et al. (1992) to show that the density state of the sediment is low enough for the sediment to mobilize easily into a sediment flow. Such an observation may explain why the Gaviota failure has pro-duced lobes suggestive of a sediment flow as opposed to a limited-deformation slump. We describe the slide here based on our interpretation of the multibeam bathymetry and for further information we refer the interested reader to Edwards et al. (1995) and Hampton et al. (1996).
The Gaviota slide is 1.65 km wide, 2.60 km long and cov-ers an area of 3.78 km2with its head located at 365 m water depth and its toe at 511 m (Fig. 14). It has a distinct head scarp of ∼8 m high with a slope angle of 16.7◦and a smooth surfaced zone of depletion. Several independent head blocks occur and one is a linear feature with well-formed secondary scarps, which is located on the eastern half of the slide. Other smaller and less intact blocks are found on the western half of the slide. The zone of accumulation is well defined and a distinct toe is present. The lower part of the zone of accu-mulation can be divided into two lobes separated by a nar-row indentation and channel-like feature. The western lobe is hummocky and has transverse or compression ridges. The eastern lobe has some radial ridges and groves concentrated along its western margin. The overall slope angle of the slide from head scarp base to toe is 3◦.
One “Tiburon” ROV dive (T153) was made at the head of Gaviota slide (Fig. 5). Although the seafloor in this area
-200 -300 -400 -500 -600 -100 -GAVIOTA SLIDE GOLETA SLIDE EAST SLIDE 1 EAST SLIDE 2 Prograding shelf edge Fault rill Rilled slope
Propagating crown crack (Incipient head scarp)
Pockmarks (Gas seeps) Carbonate buildup Active seeps Km 0 1 2 4 6 8 10 a Gaviota Slide Propagating head scarp Pockmarks Scale 1:75,000 Km 0 1 2 4 b 120o10'W 120o08'W 120o06'W 120o04'W 120o02'W 120o00'W 120o12'W 120o10'W 120o08'W 120o06'W 120o04'W 120o02'W 34 o20'N 3 4 o22'N 3 4 o24'N 34 o 24'N 3 4 o 22'N 3 4 o 20'N
Fig. 14. Seafloor images of Goleta and Gaviota slides: (a) EM300
30 kHz multibeam slope shaded bathymetric image of the Gaviota slide, propagating head scarp, densely gullied slope, and Goleta bulge, (b) close up view of Gaviota slide.
was covered with mud and no fresh material indicative of re-cent failure was present, we did observe a fairly large area of black to gray bacterial mats in the zone of depletion (Fig. 8d), downslope of the base of the eastern part of the head scarp. The head scarp was of layered mud with a thin coating of flocculent material (Fig. 8c). Several vibra-cores were recov-ered from this slide using “Tiburon” ROV and one core taken during “Tiburon” dive T809 penetrated ∼50 cm of modern sediment to recover slide debris at depth (Fig. 8e). Lee et al. (2004) place the age of the slide at between 100 and 300 years ago based on a sediment cover of 50 cm.
7.3 Propagating head scarp – Goleta bulge
Between the Gaviota and Goleta submarine landslides is a heavily gullied slope that extends from about 220 m water depth to 500 m deep. Concentration of the gullies are ∼8 gul-lies/km and represent the area containing the greatest amount of gullies in the Santa Barbara Basin region (Fig. 13b). The gullies are larger in size, better developed, and extend into
Scale 1:75,000 Km 0 1 2 4 120o24'W 120o22'W 120o20'W 120o18'W 120o16'W 120o14'W 120o24'W 120o22'W 120o20'W 120o18'W 120o16'W 120o14'W 34 o14'N 3 4 o16'N 3 4 o18'N 3 4 o20'N 34 o 20'N 34 o 18N 34 o 16'N 34 o 14'N
Fig. 15. EM300 30 kHz multibeam slope shaded bathymetric image
of Conception fan slide (a mudflow).
shallower water (∼220 m deep) in the eastern part of the slope than in the west. On the upper slope above the better developed gullies, an east-west trending zone of pockmarks exists, which lies below a zone of carbonate buildup on the continental shelf (14a). This is in the area of extensive gas venting offshore of Goleta Point (Quigley et al., 1999). Near the base of the slope where the gullies are best developed, a bulge of sediment, here called the Goleta bulge, has formed, perhaps the result of downslope creep (Fig. 13). This bulge lies immediately adjacent to, and west of, the western seg-ment of the Goleta slide where apparently the most recent side flow occurred within the western segment.
From the upper eastern side head scarp of the Gaviota slide a trough or crack in the slope sediment at a water depth of 340 m trends east-west and can be mapped approximately 7 km (Fig. 13). This crack is ∼10 m wide and ∼2 m deep. It mainly cuts off the heads of the gullies and appears as a prop-agating head scarp to the Gaviota slide. The area of heavily gullied slope bounded at the top by the crack and at the bot-tom of the non-gullied slope, and from the eastern edge of Gaviota slide to the eastern limit of the crack, is ∼2.5 km wide and ∼6 km long covering an area of 15 km2. A faint expression of a crack at 400 m deep can be seen in the multi-beam bathymetry to be extending eastward from this heavily gullied area to the Gaviota bulge, cutting the gullied slope in this area in half.
“Tiburon” ROV dives (T153 and T811) were made into the eastern propagating crack from the headward part of Gaviota slide (Fig. 5). We observed a distinct depression, sediment covered, with some bacterial mats located in the western ter-minus. No indication of recent movement or expansion of the crack such as freshly exposed mud layers or other subcrops that exist beneath the mud cover was detected.
7.4 East slides 1 and 2
Two small submarine slides exist on the slope east of the Go-leta slide and are here called East slide 1 and East slide 2 (Fig. 12). East slide 1 is located approximately 1.75 km east of Goleta slide and is 0.95 km wide, 2.42 km long covering an area of 2.0 km2. The top of East slide 1 head scarp lies at 454 m depth and its toe at 510 m. The angle of failure is 1.4◦. It is a fairly linear failure with a well-defined zone of depletion and zone of accumulation. A single small head block exists in the zone of depletion and the head scarp is gentle (8.1◦ inclination) and very subtle in the multibeam bathymetry. Centrally located along the eastern side head scarp of this slide, in the zone of depletion, a small arcu-ate trough or crack that is generally oriented in a northwest-southeast direction, parallel to slope. In 2001 “Tiburon” dive T155 was made along the head of East slide 1 where a gentle mud covered scarp was found.
East slide 2 is the larger of the two east slides being 1.65 m wide, 2.85 m long, and covering an area of 4.15 km2, over
twice the size of East slide 1 (Fig. 12). It has two distinct arcuate head scarps of generally equal dimensions with the tops of these heads at 422 m water depth and the combined toes are located at 500 m. The zone of depletion is generally smooth surfaced with multiple head blocks, which are espe-cially prominent at the base of the eastern arcuate head scarp. The toe of the slide is very subtle in bathymetry with the tip poorly developed. The angle of inclination is the same as East slide 1, 1.4◦. Similar to the Gaviota slide, the East slide 2 has a northwest-southeast oriented trough or crack that ex-tends ∼1.4 km southeast from the eastern margin of the slide, starting at the boundary between the zone of depletion and the zone of accumulation.
7.5 Conception fan slide
The Conception fan slide lies on the southern margin of the Conception fan, a poorly developed submarine fan that spreads out into the center of the Santa Barbara Basin. Three submarine channels or small submarine canyons that just notch the distal edge of the continental shelf east of Point Conception are distributary channels and may still be sup-plying sediment to the fan (Figs. 4 and 15), although not as readily as during the Pleistocene (Fischer and Cherven, 1998). It is ∼2.3 km wide, ∼6 km long producing an area of failure ∼14 km2. The head of Conception fan is located in
∼380 m of water depth while its toe is in ∼440 m. A head block with a distinct secondary scarp is located at the base of the head scrap, which rises ∼5 m and slopes 6◦. The zone of depletion is hummocky with a series of transverse ridges or compression ridges concentrated along the sides of the slide. A well-developed toe exists with the tip rising ∼10 m above the surrounding seafloor. The overall angle of slope of the slide is 1.5◦.
8 Structures and the mid-channel trend
The Santa Barbara Basin is actively undergoing rotation and compression (Crouch, 1979; Kamerling and Luyendyk, 1979, 1985; Jackson and Molnar, 1990; Crouch and Suppe, 1993; Nicholson et al., 1994). This tectonic activity has produced several major thrust faults and folds that gener-ally trend east-west and are primarily concentrated along the northern margin of the basin (Fig. 8a). The folds mapped in the subsurface of the margin beneath the shelf are comprised of the Molina and Conception anticlinal trends, Gaviota and Government Point synclinal trends (Luyendyk, 1998), with the anticlines being hydrocarbon traps and the main targets for petroleum extraction. The Pitas Point-Ventura fault con-trols the shelf break in this area and extends onland to the east connecting with the Oak Ridge anticlinorium and fault system (Greene et al., 1978; Fisher et al., 2005b).
The Mid-Channel Trend is an anticlinorium bounded on either side by faults (Fig. 2b). The apex of the structure is composed of hummocky carbonate buildup resulting from extensive methane gas venting. Pockmarks and carbonate-cemented sediment have been observed using MBARI’s ROV “Ventana” (dives V1501 and V1502). This structure plunges to the west and dips beneath the Goleta slide with the northern side of the western distal end of the anticline being marked by a well-established, linear gully that overlies the trace of the Oak Ridge Thrust fault.
9 Volume estimation of Goleta slide
Metric information extracted from the EM 300 bathymetric data were used to determine volume and to model tsunami-genic potential of Goleta slide, with the volume of material translated downslope being of particular importance. Pre-cise volumetric measurements in this case are somewhat problematic since there is no bathymetry for the previously existing slope surface, although seismic reflection profiles are used to confirm thickness estimate of deposits along some lobes. Volume calculations using a surface subtrac-tion method, and estimasubtrac-tion assuming a half-ellipsoid shape (after Beyer, 1987) were applied.
To determine the volume of material that most recently failed, which produced the modern day morphology of the Goleta slide, we treat the three mapped segments (western, central, and eastern) as independent failures. We use nomen-clature for landslide components that were developed for ter-restrial landslides by Varnes (1978) and the International As-sociation of Engineering Geology (IAEG) Commission on Landslides (1976). A computer generated oblique view of the Goleta slide, viewed toward the north, with many of the landslide features labeled after these authors are shown in Fig. 11a.
In all cases the amount of material deposited in the areas of accumulation is less than the removed material from the zone of depletion. Good thickness estimates were not possi-ble on most of the smaller slides in the region and this could
0 - 13 56-78 14-24 25-38 39-55 0 - 17 76-95 18-37 38-57 58-75 0 - 9 44-63 10-19 20-30 31-43 Thickness (m) 0 1 2 4 6 8 10 Kilometers a 1 Km Scale 1:100,000 0 2 4 1 Km Scale 1:100,000 0 2 4 -100 -200 -300 -400 -500 -100 -200 -300 -400 -500 b pre-failure surface c post-failure surface
Fig. 16. Maps showing thickness and bathymetric contours of the
Goleta slide complex: (a) isopac map of surface changes in the Go-leta slide complex, (b) assumed bathymetry prior to recent failures,
(c) bathymetric contours after failure; differences between (a) and
(b) bathymetry used to calculate volumes of depletion (excavation) and accumulation (deposition).
be the reason for the disparities. Also, there is a chance that at least the three most recent individual lobes of Goleta slide probably failed at different times, therefore, we have calcu-lated displaced volumes for each of the three individual lobes or segments as 0.592 km3of material moved in the western lobe, 0.434 km3 moved in the central lobe, and 0.480 km3 moved in the eastern lobe producing a total of 1.506 km3of displaced material (Figs. 16a, b).
10 Discussion
The Santa Barbara Basin exhibits considerable mass wasting features in the form of gullies and landslides (Fig. 4). The most dominant seafloor feature in the region is the Goleta landslide, a large (134 km2in area) complex compound land-slide that is divided into three distinct individual surface seg-ments (Fig. 11). Other smaller landslides exist in the general
vicinity of the Goleta slide and all but one, are concentrated along the northern margin of the basin. A single, fairly large slide exists at the southern margin of the Conception fan, a depositional slope and upper sill (Conception sill) that marks the western flank of the basin. Here, sediment appears to have accumulated from dispersal along three different dis-tributary channels.
Based on our interpretations of the detailed EM 300 30 kHz digital multibeam swath bathymetry and backscatter data, seismic reflection profiles, and observations and sam-pling from ROVs, along with a literature review, we conclude that submarine landslides within the Santa Barbara Basin are probably caused from a combination of mechanisms and that a fairly lengthy historical record of mass movement exists that suggests a periodicity of failures on the order of millen-nia. We estimated the volume of material evacuated from the northern slope area and modeled the probable resulting tsunamis that may have occurred from rapid, cohesive fail-ures.
10.1 Types of failure
The multibeam bathymetry indicates that many different types of slope failures and mass movements have occurred along the flanks of the Santa Barbara Basin. These fail-ures range from possible sediment creep as illustrated in the Goleta bulge (Fig. 13), to mud flows such as illustrated by Gaviota slide (Figs. 13 and 14), to simple thin sediment flows as exhibited by East slides 1 and 2 (Fig. 12), to the more com-plex compound landslide of the Goleta slide that includes mud flows and rotational slumps (Fig. 11). The characteristic of many of these slides and the adjacent slope morphologies such as seen in the propagating head scarps or crown cracks of Gaviota slide (Fig. 13) and East slides 1 and 2 (Figs. 4 and 12) suggest that these slides may initially fail at mid slope resulting in downslope sediment flow and headward erosion through retrogressive slumping. The more cohesive mass movements appear to occur near the top of the slope as il-lustrated in the slump blocks at the base of the Goleta slide’s head scarp and my be the failures that have the highest like-lihood of generating a significant tsunami.
10.2 Mechanisms of failures
Our study suggests that several different mechanisms may be responsible for the mass movement phenomena exhibited in the Santa Barbara Basin. Although it is not possible for us to single out one mechanism responsible for the landslides, we speculate here on the potential of four major mechanisms we feel may be the primary stimulants for mass wasting in the Santa Barbara region (Fig. 17). These include sediment ac-cumulation, fluid flow, tectonic over steepening, and seismic incitement (earthquakes). Specifically the northern slope of the basin is the steepest in the region, is cut by many faults, is undergoing uplift and compression, and has an extensive amount of fluid flow and gas venting.
10.2.1 Sediment accumulation
The highest concentrations of seafloor failures in the Santa Barbara Basin lie along the northern margin of the basin and are indicative of the active sedimentary processes there, as well as fluid flow, and tectonic processes active in the region. Much of the sediment that enters the Santa Barbara Chan-nel region is from the erosion of coastal cliffs and within the Transverse Ranges, with the resultant detritus eroded inland being carried to the sea by the Santa Clara and Ventura rivers, the major fluvial sources of the region. Fine-grained sedi-mentary deposits that enter the channel from the rivers during flood periods are generally transported to the west along the coastline and settle out of the water column in the vicinity of Goleta Point (Fig. 10; Thornton, 1984). A muddy pro-grading shelf edge exists all along the shelf here from Goleta to Gaviota (Figs. 4 and 10) and suggests a major depocenter of fine-grained sediment that may become unstable along the shelf break. Along this shelf break Fisher et al. (2005a) have mapped what appears as a shelf edge delta deposit from the interpretation of seismic reflection profiles.
10.2.2 Fluid flow
Hydrocarbon reservoirs in the Santa Barbara Basin have been leaking fluids and gas for the past 60 000 of years (Kennett et al., 2000), which produced distinct seafloor morphologies such as active gas vents, pockmarks, tar-flows, and carbonate mounds and pavement (Figs. 2, 8a, b, c, and 9). The Neo-gene Santa Barbara Basin is filled with 8–10 km of Upper Jurassic to Holocene sedimentary sequences of sand-, silt-, and mudstone (Dibblee, 1982a, b; Yeats, 1983; Dickinson et al., 1987; Kennedy et al., 1987) and has been a major offshore petroleum production providence since the 1960s. The basin sits within the transform plate boundary that sep-arates the North American Plate from the Pacific Plate and is presently being subjected to transpression. The transpres-sive effect results in the shortening of the basin through com-pression forming several distinct folds (anticlines) and thrust faults. Much of the morphology formed by gas and fluid seeps exhibit trends that are aligned with these structures (Fig. 9) and many consist of carbonate and tar mounds and tar flows (Fig. 8b; Eichhubl et al., 2002). Although no au-thigenic carbonates were recovered during MBARI’s ROV “Ventana” dives V1492 and V1506 along the south branch of the Santa Ynez fault, we suspect that carbonate mounds do exist based on the form and linearity of mounds along the projected western extent of the fault (Fig. 7) indicating that faults focus or control fluid flow in the region as shown by the deposition of carbonates and gas seeps along fault trends. Examples of such leaking faults is exhibited along the Coal Oil Point shelf edge where the trend of the Pitas Point fault has been mapped and exhibits curtains of gas venting along parallel lines to the fault trend. In addition, the east-west ori-ented gully just off the Goleta slide lies over the trace of the Oak Ridge Thrust fault and exhibits possible past fluid flow or focused sediment transport as indicated by the bedforms