HAL Id: hal-00298624
https://hal.archives-ouvertes.fr/hal-00298624
Submitted on 31 Jan 2005HAL is a multi-disciplinary open access archive for the deposit and dissemination of sci-entific research documents, whether they are pub-lished or not. The documents may come from teaching and research institutions in France or abroad, or from public or private research centers.
L’archive ouverte pluridisciplinaire HAL, est destinée au dépôt et à la diffusion de documents scientifiques de niveau recherche, publiés ou non, émanant des établissements d’enseignement et de recherche français ou étrangers, des laboratoires publics ou privés.
An integrated geological, hydrogeological and
geophysical approach to the characterisation of the
aquifer in a contaminated site
M. A. Di Paola, S. Margiotta, F. Mazzone, S. Negri
To cite this version:
M. A. Di Paola, S. Margiotta, F. Mazzone, S. Negri. An integrated geological, hydrogeological and geo-physical approach to the characterisation of the aquifer in a contaminated site. Hydrology and Earth System Sciences Discussions, European Geosciences Union, 2005, 2 (1), pp.229-263. �hal-00298624�
HESSD
2, 229–263, 2005 An integrated geological, hydrogeological and geophysical approach M. A. Di Paola et al. Title Page Abstract Introduction Conclusions References Tables Figures J I J I Back CloseFull Screen / Esc
Print Version Interactive Discussion
Hydrol. Earth Syst. Sci. Discuss., 2, 229–263, 2005 www.copernicus.org/EGU/hess/hessd/2/229/ SRef-ID: 1812-2116/hessd/2005-2-229 European Geosciences Union
Hydrology and Earth System Sciences Discussions
An integrated geological, hydrogeological
and geophysical approach to the
characterisation of the aquifer in a
contaminated site
M. A. Di Paola, S. Margiotta, F. Mazzone, and S. Negri
Dipartimento di Scienze dei Materiali, Osservatorio di Chimica, Fisica e Geologia Ambientali, Universit `a degli Studi di Lecce, Italy
Received: 3 December 2004 – Accepted: 21 January 2005 – Published: 31 January 2005 Correspondence to: S. Negri (sergio.negri@unile.it)
HESSD
2, 229–263, 2005 An integrated geological, hydrogeological and geophysical approach M. A. Di Paola et al. Title Page Abstract Introduction Conclusions References Tables Figures J I J I Back CloseFull Screen / Esc
Print Version Interactive Discussion
Abstract
This work sets out a physical - stratigraphical reconstruction of the superficial aquifer in the Brindisi area; this site is recognized to be at significant environmental risk (Law no. 426/98) by the Italian government. Geological, hydrogeological and geophysical methodologies were applied. The geological characterisation consisted of surface
5
and subsoil surveys. The existing stratigraphical, geotechnical and hydrogeological data were collected, processed and homogenised, and the information inserted in a database managed with a specific software (arcview). Hydrogeological surveys were conducted in a number of boreholes uniformly distributed over the studied area. Geo-physical prospecting was conducted in the most industrialized part of the area, adjacent
10
to a combined industrial road/conveyor belt – the “Asse Attrezzato” – in order to better describe the site and evaluate the impact of this structure on the environment. This research enabled us to characterise the superficial aquifer of the Brindisi area. The groundwater is of the phreatic type. In the upper part of the deposit, the presence of low permeability sediments (recent continental deposits) means that the
groundwa-15
ter is confined. Subapennine Clays (Lower Pleistocene), present across the whole of the area, form the impermeable base of the aquifer. The deposits that make up the superficial aquifer vary greatly in their permeability. The greatest permeability is as-sociated with the calcarenite deposits (Terraced Deposits, Middle-Upper Pleistocene). The higher the proportion of slime in the granulometric assortment, the lower the
per-20
meability of the deposit. The lower section of the aquifer, characterized by the presence of slimy-sandy sediments (Brindisi sands, Lower-Middle Pleistocene), has a lower per-meability. The results of the geophysical investigations enabled us to reconstruct in detail the lateral and vertical lithological variations of the geological formations. Fur-thermore, by supplementing the data from boreholes (direct surveys), the geophysical
25
surveys proved to be useful in that they reduce the need for perforations of the ground, which are potential conduits of pollution.
HESSD
2, 229–263, 2005 An integrated geological, hydrogeological and geophysical approach M. A. Di Paola et al. Title Page Abstract Introduction Conclusions References Tables Figures J I J I Back CloseFull Screen / Esc
Print Version Interactive Discussion
1. Introduction
Internationally, the problem of contaminated sites is considered to have started in the XIX century, but was not fully acknowledged until the early 1970s (Petts et al., 1997; Rivett et al., 2002), partly in consequence of the ecological disasters of Love Canal (Usa) and Lekkerkerk (Holland), which were given great prominence by the media. The
5
fact that toxic substances, including dioxin, were found in residential centres brought to the attention of the public the serious risks posed by these sites (“toxic time bombs”, Swaigen, 1995) for human health and the development of certain regions. Public inter-est in these disasters persuaded governments to identify the nature of the risks posed by the presence of contaminated sites and to act quickly to clean them up. A site is
10
defined as contaminated when the ground, the surface waters or the ground-waters contain contaminating agents to a level that exceeds the maximum set by legislators (De Sousa, 2001). A distinction is often made between sites recognized as contami-nated and potentially contamicontami-nated sites, which are suspected of being so because of the use that has been made of them. On the other hand, terms as brownfield sites (in
15
Canada and the Usa), derelict lands (Great Britain) and former industrial sites (Europe) have often been used to designate abandoned urban areas or industrial sites that are potentially contaminated. Italian Law L. 426 of 12 September 1998 (G.U. n. 291, 14 December 1998), ”New measures in the environmental field”, identifies on a national level the industrial sites at greatest risk in terms of the health of workers, the
popu-20
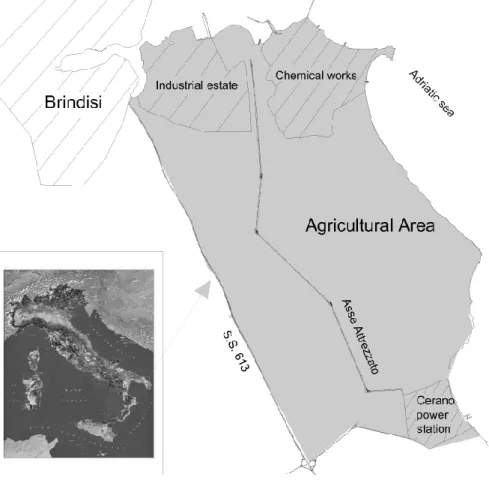
lation and the environment. In this law, the Italian Government recognized the area around Brindisi (Fig. 1) as being at environmental risk, one of 14 areas on a national level requiring urgent intervention with a view to reclamation and environmental im-provement. The potentially contaminated area around Brindisi was delimited by the Decree of 10 January 2000 (G.U. n. 43 of 22 February 2000). The purpose of this
25
study is the geological and hydrogeological characterization of this area. There have been many characterizations of various areas which also involved the integration of different survey types (Winde and Van Der Walt, 2004; Jeong, 2001; Sandberg et al.,
HESSD
2, 229–263, 2005 An integrated geological, hydrogeological and geophysical approach M. A. Di Paola et al. Title Page Abstract Introduction Conclusions References Tables Figures J I J I Back CloseFull Screen / Esc
Print Version Interactive Discussion
2002). In this paper, the geological, hydrogeological and geophysical methodologies used to characterize the site are described.
2. Stratigraphy
2.1. Geological, morphological and hydrogeological setting
The studied area lies almost entirely within the Italian Ordnance Survey Map sheet
5
IGM F. 204 (“Lecce”), with smaller portions covered by sheets F. 191 (“Ostuni”) and F. 203 (“Brindisi”). It is delimited to the north by the port of Brindisi, to the south by the “Cerano” power station, to the east by the Adriatic sea and to the west by the high-way connecting Lecce to Brindisi (Fig. 1). The area therefore lies on the eastern edge of the Brindisi-Taranto plain. The area of interest, part of the Apulian foreland, is an
10
emerged area of the Apulian Plate, consisting of a thick basement of carbonatic rocks. These Mesozoic limestones are covered by lower-middle Pleistocene deposits, result-ing from the sedimentary cycle of the Bradanic foredeep. These deposits are covered in succession by terraced bioclastic marine deposits in transgression, Holocene con-tinental deposits and recent concon-tinental deposits. This part of the foreland has been
15
partially affected by the Apenninic orogeny, with fractures, faults and large folds. The presence of deformations and fractures, caused by seismic activity in marine and con-tinental sediments associated with the last interglacial period (Moretti and Tropeano, 1996; Moretti, 2000) and by the strong seismic event reported in this area on 20 Febru-ary 1743 (Margottini, 1981), suggests that tectonically active structures are present,
20
though they have yet to be identified. The morphology of the area under study is char-acterised by a broad plain, slightly sloping towards the sea, in many places marked by natural and/or man-made channels which form the drainage network. The altitude is between 30 and 40 m above sea level, decreasing towards the “Fiume Grande” and the coastal zone. On the Adriatic coast near the “Cerano” power station, there is a
ver-25
HESSD
2, 229–263, 2005 An integrated geological, hydrogeological and geophysical approach M. A. Di Paola et al. Title Page Abstract Introduction Conclusions References Tables Figures J I J I Back CloseFull Screen / Esc
Print Version Interactive Discussion
the cliff decreases in height, leading to depressions below sea level (e.g. the “Salina Vecchia”). The current shoreline runs perpendicular to the drainage channels, with some steep cliffs in rapid retreat due to erosion. In other cases, the Holocene rise in sea levels led to the lower courses of the deepest rivers being submerged, forming inlets such as the “Canale Pigonati”, “Seno di Levante” and “Seno di Ponente”, which
5
form the natural port of Brindisi. Examination of the IGM maps from the 1948 survey (the north-west quadrant of map sheet 204 IV, on a scale of 1:25 000) reveals that along the southern side of the port of Brindisi up to “Capo Cavallo”, the shoreline was originally characterised by short and narrow stretches of sandy beach hemmed in by modest cliffs carved out of heterogeneous deposits and in places by modest cordons
10
of dunes. From “Capo Cavallo” to “Salina Vecchia” the shoreline was characterised by a rocky coast with a maximum height of 2 m; this was followed by a wide sandy beach, enclosed by a continuous cordon of dunes. Thereafter there were wide ponds and coastal swamps associated with the mouths of water courses and springs. Further inland, covered by topsoil and/or recent continental deposits, a series of ledges have
15
been recognized as corresponding to successive ancient coastlines. These morpho-logical elements, geomorpho-logically associated with the Terraced Deposits formation, testify to the periodic invasions of the sea and its respective retreats. These in turn are linked to the variations in sea level caused by the primarily glacio-eustatic phenomena that occurred in the Middle-Upper Pleistocene period. The drainage system in the area is
20
well developed. It is characterized by numerous shallow incisions that in many cases run directly into the sea (e.g. “Fiume Grande”, “Foggia Rau”, “Fiume Piccolo”, “Canale Palmarini-Patri”, “Canale Cillarese”). The watersheds are hard to identify. Numerous smaller channels drain into modest depressions which are subject to flooding even af-ter light precipitation. Near the mouth of the “Canale di Scarico” waaf-ter course is a broad
25
marshy area. The overall picture is of an area whose environment has been strongly conditioned by human activity. Especially over the last few decades, the hydrographical and morphological order has been modified not only by the imposition of a system of drainage channels but also by the frequent filling-in of depressions for the purposes of
HESSD
2, 229–263, 2005 An integrated geological, hydrogeological and geophysical approach M. A. Di Paola et al. Title Page Abstract Introduction Conclusions References Tables Figures J I J I Back CloseFull Screen / Esc
Print Version Interactive Discussion
agriculture and/or to render them suitable for industrial or residential construction. 2.2. Geological survey
The area under study is covered by topsoil and recent continental deposits which make direct observation of the underlying formations impossible in many places. However, numerous wells have been dug in this area to obtain water from the karstic aquifer
5
present in the carbonatic cretaceous substratum for the purposes of irrigation. The hy-drological data concerning all of these boreholes, as well as some of the relevant strati-graphies are kept in the archives of local agencies (“Genio Civile”, “Ente Irrigazione”). In order to obtain an exhaustive geological picture, it was decided to consider bore-holes just outside the area of study as well, taking the “Murge” hills to the west as the
10
limit of our investigation. The extensive human activity in the zone has resulted in many boreholes that are not as deep as the wells, but for which a quantity of data is avail-able, useful for the reconstruction of the lithostratigraphical succession. In summary, the study was organized into the following phases:
– geological surveys of the surface;
15
– geological surveys of the subsoil via direct observation of borehole cores; – identification of existing wells in the area;
– collection of all the stratigraphical data drawn from borehole cores and supplied by local agencies, from private research and publications in scientific journals (Tedeschi, 1969; Radina, 1968);
20
– processing of the above-mentioned data, taking account of new geological knowl-edge of the area (Ricchetti et al., 1988; Gentile et al., 1996; Coppa, 2002), and homogenisation of the geological and hydrogeological data from boreholes dug by local agencies such as: “Genio Civile”, “Ente Irrigazione” (Fig. 2);
HESSD
2, 229–263, 2005 An integrated geological, hydrogeological and geophysical approach M. A. Di Paola et al. Title Page Abstract Introduction Conclusions References Tables Figures J I J I Back CloseFull Screen / Esc
Print Version Interactive Discussion
– creation of a database, as mentioned above, managed using specific software (arcview);
– collection of all the hydrological and geo-technical data (piezometric levels, flow, permeability of the various formations, physical and granulometric characteristics) available from private research and scientific publications (Cherubini et al., 1987).
5
The data thus acquired and processed allowed us:
– to verify the horizontal extension in the subsoil of the formations; – to evaluate the thicknesses of the lithostratigraphical formations;
– to draw numerous two-dimensional cross sections of parts of the area under ex-amination (Fig. 3);
10
– to identify areas for which data are still lacking.
Furthermore, the identification of the existing wells provided an initial overall picture of the distribution and the density of the points of extraction from the deep aquifer, highlighting the possible overexploitation to which this may be subject. From the geo-logical surveys conducted by us, integrated with the data on the subsoil, the following
15
lithostratigraphical succession, from the surface downwards, was recognized (Fig. 4): – topsoil and material used for land infill A0
– marsh Deposits A4 (Recent Holocene) – lagoon Deposits A3 (Recent Holocene) – eluvial Deposits A2 (Recent Holocene)
20
– alluvial Deposits A1 (Recent Holocene)
HESSD
2, 229–263, 2005 An integrated geological, hydrogeological and geophysical approach M. A. Di Paola et al. Title Page Abstract Introduction Conclusions References Tables Figures J I J I Back CloseFull Screen / Esc
Print Version Interactive Discussion
– Brindisi sands (Lower-Middle Pleistocene) – Subapennine Clays (Lower Pleistocene) – Gravina Calcarenite (Lower Pleistocene) – Altamura Limestone (Upper Cretaceous) 2.2.1. Topsoil and material used for land infill A0
5
The topsoil is of a brown colour, tending to beige at greater depths, generally composed of slimy sands, generally with low organic content. The thickness of the topsoil varies between 0.3 m and about 6 m. It lies over almost all the area under examination (Fig. 5); it is lacking only where eluvial Deposits appear on the surface. Sands of varying density are sometimes found in reclaimed areas. They cover the eluvial stratum, from the
10
erosion of which they are generated. In some places, for example near the industrial zone of Brindisi and the port, the topsoil has been completely removed and replaced with infill material. The infill material is made up of rubble and coarse sand of various kinds, sometimes mixed with an abundant slime-clayey matrix.
2.2.2. Marsh Deposits A4
15
These are characterized by peat with considerable non-decomposed organic content, with varying percentages of sandy-slimy mud and clay. The organic content decreases with depth, while the clayey fraction and the plasticity increases. The clayey fraction varies from 23% to 54% while the percentage accounted for by the sandy fraction (2%– 25%) is less significant. These deposits are found especially in a marshy basin lying in
20
the alluvial plain of the “Canale di Scarico”, the terminal stretch of the “Fiume Grande”. The process of erosion and accumulation of the meanders of the “Fiume Grande” has, over time, extensively modified the original topographical surface, widening the flood plain of the river so as to form a broad marshy area. Marsh deposits can also be found in the proximity of the mouth of the “Fiume Piccolo”. The thickness of the peat varies,
HESSD
2, 229–263, 2005 An integrated geological, hydrogeological and geophysical approach M. A. Di Paola et al. Title Page Abstract Introduction Conclusions References Tables Figures J I J I Back CloseFull Screen / Esc
Print Version Interactive Discussion
reaching a maximum of about 25 m. The height of the peat bed is between 3 m above sea level and 25.8 m below sea level; the thickest parts lie directly on the subapennine Clays. The degree of saturation of these deposits is always very close to 100%. 2.2.3. Lagoon Deposits A3
These are composed of clayey and/or sandy-clayey slimes, and are grey, green and
5
nut-brown in colour, containing laminitic and carbonaceous residues as well as cal-careous concretions, randomly mixed, with patinas of oxidation. Their lithological and sedimentological characteristics indicate that they are deposits of a lagoon environ-ment or low-energy alluvial lowland. The granulometric composition is fairly evenly divided between the sandy, slimy and clayey fractions. The percentage of carbonate
10
is high. The degree of saturation is about 95%. The deposits are characterised by low permeability, favouring, in places, the formation of water bodies suspended above them in the infill material, and partially protecting the underlying superficial aquifer. The thickness varies between 60 cm and 9.6 m, but the most frequent values are between 1.50 m and 5 m.
15
2.2.4. Eluvial Deposits A2
The eluvial Deposits are formed by sands and clayey sands of eluvial origin, changing from brown-red to light-brown with depth. The deposits appear homogeneous, of low density and free of calcareous elements, except for the transition zone close to the underlying Terraced Deposits. The characteristic features of these deposits are: the
20
prevalence of the sandy fraction, the absence of slimes, the proportion of the clayey fraction (varying between 15% and 40%) and their mineralogical composition (almost free of carbonates). The saturation level is not high. The maximum thickness is about 6.2 m with mean values of 3 m. These deposits are not found across the whole of the area; where they are found, the bottom of this formation almost always lies about 10 m
25
HESSD
2, 229–263, 2005 An integrated geological, hydrogeological and geophysical approach M. A. Di Paola et al. Title Page Abstract Introduction Conclusions References Tables Figures J I J I Back CloseFull Screen / Esc
Print Version Interactive Discussion
2.2.5. Alluvial Deposits A1
These sediments are composed of sands and slimy sands predominantly light brown in colour, with abundant heterometric calcareous clasts. Stratigraphically, these deposits rest directly on the Terraced Deposits, though with a gradual transition;laterally, they border on deposits A2 and A3. The thickness of A1 varies between 40 cm and 8 m; the
5
bottom of the layer varies between 0 and 20 m above sea level. 2.2.6. Terraced Deposits
The Pleistocene formation of the terraced deposits (Fig. 6) is lithologically composed of yellowish coarse-grained calcarenites with sandy layers or layers of organogenic limestones varying in thickness from a few centimetres to 15 cm; in places, near the
10
contact with the subapennine Clays, layers of very compact and tenacious limestones, a few decimetres thick, are present. The sandy facies is composed mainly of quartz grains, feldspars and carbonatic material of detritic and bioclastic origin; mica crystals are present in a lesser proportion. The fossils are mainly lamellibranches and algae. The granulometry of the sandy facies in terms of gravel (0%–28%), sand (3%–84%)
15
and slime (2%–75%) varies greatly depending on the stratigraphical level. The nat-ural water content varies around an average value of 20.79% with the porosity index varying between 0.49 and 0.87. It may be assumed that this formation extends across the whole of the studied area. The transition to the underlying subapennine Clays is in some places direct and in others through the interposition of Brindisi sands. The
20
thickness of the formation varies considerably, from a few decimetres to about 20 m, although the most frequent values are in the range of 5–6 m. The top of this unit is found between 68 m and −33 m above sea level, while the bottom lies between −45 m to 60 m above sea level further inland.
HESSD
2, 229–263, 2005 An integrated geological, hydrogeological and geophysical approach M. A. Di Paola et al. Title Page Abstract Introduction Conclusions References Tables Figures J I J I Back CloseFull Screen / Esc
Print Version Interactive Discussion
2.2.7. Brindisi sands
This provisional and informal term is used to refer to sandy and slimy clayey deposits found in places between the Terraced Deposits and the subapennine Clays. The tran-sition between the Terraced Deposits and this formation is characterized by an abrupt lithological variation (from diagenetic calcarenite to sands) (Fig. 6); this transition was
5
observed in detail on the cliff near the “Cerano” power station. The erosional contact with the underlying subapennine Clays is also visible here. In terms of granulome-try, moving downwards, the transition involves an enrichment of the slimy-clayey frac-tion, interleaved with sandy layers a few millimetres or centimetres thick. In lithological terms, the Brindisi sands are composed of fine-grained sands whose colour shifts from
10
grey to yellow-light brown moving upwards; this sand contains abundant diagenetic concretions. The lower part of this formation is made up of clayey-sandy slimes of grey colour, with carbonaceous fragments. In mineralogical terms, the grains of the sandy fraction are mainly made up of carbonatic and quartzeous fragments. The clayey and sandy fractions comprise 35 to 38% of the lower part of the layer. The stratification is
15
indistinct. The thickness of this formation varies from a few decimetres to 20 m. The mean thickness is about 13–14 m.
2.2.8. Subapennine Clays
The Subapennine Clays formation (Lower Pleistocene) is made of clays and grey-blue sandy clays, rich in fossils (Fig. 6). These deposits can be defined as sands with
20
clay; nevertheless, there is considerable variation in the dimensions of the grains. The percentage of sand varies from 2% to 55%, that of slime about 10%; the average car-bonate content is 31%, this value increases moving towards the underlying Gravina Calcarenite. Inside the formation, whose thickness is never less than several decame-tres, there are sandy layers of a grey-blue colour whose lateral and vertical extension
25
is not easily measurable. The stratigraphical transition to the underlying Gravina Cal-carenite has never been observed in outcrop. The natural content water ranges from
HESSD
2, 229–263, 2005 An integrated geological, hydrogeological and geophysical approach M. A. Di Paola et al. Title Page Abstract Introduction Conclusions References Tables Figures J I J I Back CloseFull Screen / Esc
Print Version Interactive Discussion
14.05% to 43.5% and the degree of saturation also varies considerably, from 71.84% to 100%. Laboratory analyses, conducted by the “Consorzio Basi” consortium in confor-mity with law 471/99 on the uncontaminated samples of the clayey layer, demonstrate the low permeability (between 10−10 and 10−11m/s, average 1,81×10⁻¹⁰m/s) of the formation. The thickness of this formation is varies greatly from a few metres to over
5
50 m. Specifically, the thickness increases moving from the “Cerano” power station (average 20 m), forming the southern limit of the investigated area, to the port of Brin-disi, which forms the northern limit (average 45 m). Moving from west to east, the top of the Mesozoic limestones and the top of the overlying Pleistocene calcarenite tend to deepen, and the thickness of the subapennine Clays, which overlie the Pleistocene
10
calcarenite, increases. The top of the subapennine Clays is above sea level in the zone near the “Cerano” power station, while elsewhere the top is found at a maximum of 29 m below sea level.
2.2.9. Gravina Calcarenite
Gravina Calcarenite is the most ancient of the Pleistocene formations present in the
15
area. Characterized by coarse-grained calcarenite of a yellowish colour with abundant fossils, it overlies, with discontinuous and discordant contact, the carbonatic creta-ceous basement; the contact is clearly visible in several places in the Salento and was observed in the borehole cores in the area under study (Fig. 7). From the chemical point of view these deposits are composed of normal calcite with low magnesium
con-20
tent. Present in smaller amounts are kaolinite, illite, chlorite, smectite, gybsite and goethite, scattered in the sediment, along with single grains of quartz and feldspars (Andriani and Walsh, 2002). The micritic matrix is almost entirely absent. The porosity ranges from 42.90% to 49.40%. The thickness of the formation varies considerably and reaches maximum values of more than 30 m.
HESSD
2, 229–263, 2005 An integrated geological, hydrogeological and geophysical approach M. A. Di Paola et al. Title Page Abstract Introduction Conclusions References Tables Figures J I J I Back CloseFull Screen / Esc
Print Version Interactive Discussion
2.2.10. Altamura limestone
This formation, which outcrops immediately to the west of the studied area, is made up of alternating limestones and dolomitic limestones, both micritic, compact and tena-cious, whitish, light grey or hazel in colour, in layers varying in thickness from a few centimetres to about 1 m. In places the layers appear densely laminar; flakes may be
5
easily broken off pieces of the rock. The outcrops have a thickness of a few metres only, in places covered in topsoil. Greater thicknesses, (up to 30–40 m), are visible in the quarries located near the area under study, some of which are still in use while oth-ers are used as rubbish dumps. In many places the layoth-ers are fractured and disjointed. There are few macrofossils, characterized by fragments of rudists (Fig. 7), with smaller
10
amounts of coral and bivalves. The top of the carbonatic basement is also found at highly variable depths in nearby areas, indicating the presence of faults with slips of several decametres. In general, the top of this formation deepens moving from the “Murge” hills, where the described limestones outcrop, towards the sea, and from the south of the investigated zone (Cerano power station, where the top is 20 m below sea
15
level) towards the north (Brindisi port, where the top is 90 m below sea level) (Fig. 8).
3. Hydrogeology 3.1. Introduction
From the hydrogeological data obtained by us and the data retrieved from the literature (Zorzi and Reina, 1957; Radina, 1968; Cotecchia, 1977; Cherubini et al., 1987;
Ric-20
chetti and Polemio, 1996), it is clear that the area under study contains two overlapping and hydraulically separate aquifers:
– the first (superficial) aquifer is formed by the Pleistocene marine Terraced De-posits overlying the Pleistocene clays, holding a phreatic groundwater body (Fig. 9);
HESSD
2, 229–263, 2005 An integrated geological, hydrogeological and geophysical approach M. A. Di Paola et al. Title Page Abstract Introduction Conclusions References Tables Figures J I J I Back CloseFull Screen / Esc
Print Version Interactive Discussion
– the second (deep) aquifer lies in the Mesozoic limestones, made up of fractured and karstic carbonatic cretaceous rocks, and in the overlying Pleistocene cal-carenite. In these sediments circulate the waters of the deep groundwater body. This deep groundwater body floats on a base of sea water from continental inva-sion, in accordance with the principle of Ghyben-Herzber. Unlike the superficial
5
groundwater, found only in certain places, the deep groundwater extends across the whole of the Apulia region. The deep aquifer, lying below the subapennine Clays, contains water under pressure and is therefore of the Artesian type. The deep groundwater is replenished by precipitation where the cretaceous formation outcrops, by underground outflows from the adjoining “Murge” hills, and by
seep-10
age from the superficial aquifer. The piezometric gradients are very modest, even at some distance from the coast. For the aim of this study it was not considered necessary to perform hydrogeological investigations on the deep aquifer. The measurements performed served to determine the hydrogeological characteris-tics of the superficial aquifer, the one most likely to be affected by pollution.
15
3.2. Hydrogeological surveys
In order to characterize the superficial groundwater, hydrogeological investigations were performed in some boreholes located at regular intervals in the area under study. Measurements were taken for various parameters (temperature, pH, dissolved oxygen and salinity) at varying levels of the water column in each borehole. The instrument
20
used was the Multiparametric Hydrolab MiniSonde 4. During the surveys the depth of the water table was also measured using a piezometric probe. 14 surveys (Table 1) were performed in boreholes located along the route of the “Asse Attrezzato” conveyor belt which divides the studied area from north to south. Another 4 surveys were con-ducted in boreholes situated in the Brindisi agricultural area, so as to uniformly cover
25
the area. Briefly, the results of the investigations conducted enabled the following con-siderations to be made:
HESSD
2, 229–263, 2005 An integrated geological, hydrogeological and geophysical approach M. A. Di Paola et al. Title Page Abstract Introduction Conclusions References Tables Figures J I J I Back CloseFull Screen / Esc
Print Version Interactive Discussion
– in all the boreholes, temperature decreases with depth. This parameter is influ-enced by the external temperature; the recorded values vary between 20◦C and 18◦C, except for the borehole situated immediately to south of Cerano where val-ues varied between 21.8◦C and 19.8◦C;
– pH values did not vary significantly between boreholes, or with depth; the average
5
value was about 6.8;
– values for dissolved oxygen vary greatly both between boreholes and depending on depth in the same borehole. In general, as depth increases oxygen content de-creases, due to the presence in the aquifer of two hydraulically connected layers with different permeability. The aquifer is composed of marine Terraced Deposits,
10
of medium-high permeability, and the underlying sandy-slimy deposits (Brindisi sands), of medium-low permeability. Indeed, the data from the investigations con-ducted by the Consorzio Basi (2002) show that the permeability of the aquifer varies from a maximum of 4.9×10⁻⁴m/s to a minimum of 4.51×10⁻⁹m/s, with an average value of 2.33×10⁻⁵m/s. Moreover, inside the Terraced Deposits,
perme-15
ability values vary between 10−4m/s and 10−6m/s depending on the proportion of sands (which are present in discontinuous layers) in the matrix (Consorzio Basi, 2002). A sudden decrease in dissolved oxygen was recorded in the transition zone between these two Pleistocene formations. Further small variations were observed within the Terraced Deposits; these variations could derive from the
20
lithological heterogeneity of these deposits;
– the salinity values appeared to depend on the distance of the boreholes from the sea. However, in every well, a similar trend was recorded of salinity increasing with depth, from fresh-water to values typical for the transition zone between fresh and salt water. The recorded data highlight the irregularity of saline intrusion from
25
the coast inland.
When the geological data reported in Sect. 2 of this paper are taken into account, the following additional considerations on the characteristics of the superficial aquifer
HESSD
2, 229–263, 2005 An integrated geological, hydrogeological and geophysical approach M. A. Di Paola et al. Title Page Abstract Introduction Conclusions References Tables Figures J I J I Back CloseFull Screen / Esc
Print Version Interactive Discussion
can be made:
– the superficial groundwater is of the phreatic type, with semi-confined conditions in the upper part of the deposit where this is overlain with sediments of low per-meability (recent continental deposits);
– the water table of the superficial aquifer lies between 0.8 m and 7.4 m below the
5
surface, with a mean value of about 3.5 m;
– the impermeable base of the groundwater is provided by the subapennine Clays (Lower Pleistocene), which are present across the whole of the area;
– the saturated part of the superficial aquifer has a thickness varying from a few decimetres to over 30 m;
10
– the motion of the groundwater is characterized by an underground water flow towards the sea.
4. Geophysics 4.1. Introduction
Geophysical prospecting was conducted inside the mostly industrialized part of the
15
area and adjacent to the “Asse Attrezzato” (the industrial road/conveyor belt supplying the “Cerano” power station, whose floor lies below the water table), in order to better describe the site and to estimate the environmental impact. The choice of area to investigate was influenced by various factors:
– the presence of artificial structures with potential impact on the surrounding
habi-20
tat (the “Asse Attrezzato” and several factories);
– the presence of natural features of particular importance (“Fiume Grande” and “Canale di Scarico”);
HESSD
2, 229–263, 2005 An integrated geological, hydrogeological and geophysical approach M. A. Di Paola et al. Title Page Abstract Introduction Conclusions References Tables Figures J I J I Back CloseFull Screen / Esc
Print Version Interactive Discussion
– availability of geological and hydrogeological data to supplement the results of geophysical surveys;
– ease of access to the area. 4.2. Surveys
In the studied area eight electrical tomography profiles were carried out (Fig. 10): we
5
report only the three most significant (48 electrodes, electrode-spacing 3 m). For every profile two electrode arrays were used (dipole-dipole and Wenner-Schlumberger) in order to detect vertical and horizontal resistivity variations. To obtain 2D resistivity models, the experimental data were inverted using RES2DINV software (Loke, 1999), which uses the rapid inversion algorithm of Loke and Barker, 1996. The most significant
10
resistivity cross sections are shown in Fig. 11. They indicate that the subsoil can be subdivided into the following four distinct electro-layers (moving downwards from the surface):
Electro-layer 1: the thickness of this layer varies between 1 and 2 m and its resistivity values between 10 and 20Ω×m. This layer is attributable to infill material at the surface;
15
Electro-layer 2: the resistivity of this layer varies between 50 and 200Ω×m, and its thickness from 6 to 8 m. In profile P1 the bottom of this electro-layer lies at a depth of approximately 7.5 m below the surface; towards the middle of the cross section relating to this profile, an area of discontinuity can be seen. In P4 and P5 the bottom of this layer lies at a depth of approximately 10.5 m. This layer is attributable to
water-20
saturated calcarenite. These interpretations are supported by existing lithological and hydrogeological data;
Electro-layer 3: the thickness of this layer varies between 5 and 7 m; the bottom lies at a depth of between 12 m (P1) and 18 m (P4 and P5) and its resistivity values range from 8 to 20Ω×m. In P4 some horizontal discontinuity was observed, which is most
25
easily seen in the cross section obtained using the Wenner-Schlumberger array. This electro-layer may geologically be associated with saturated Brindisi sands;
HESSD
2, 229–263, 2005 An integrated geological, hydrogeological and geophysical approach M. A. Di Paola et al. Title Page Abstract Introduction Conclusions References Tables Figures J I J I Back CloseFull Screen / Esc
Print Version Interactive Discussion
Electro-layer 4: the resistivity of this last electro-layer is characterized by values below 8Ω×m. This layer corresponds to the subapennine Clays. The resistivity values decrease with depth and this is certainly due, in the absence of vertical lithological variations, to the increasing salinity of the water content.
The results of the surveys also point to differences between the resistivity values
5
recorded on the east and west sides of the “Asse Attrezzato”: the resistivity cross sections pertaining to profiles on the eastern side agree with the geological and hy-drogeological data obtained from specific points (i.e. boreholes); these data were cor-related together, enabling us to better describe the subsoil and to draw the geological cross sections shown in Fig. 12. On the western side (P4) the resistivity cross sections
10
accorded well with stratigraphical data but not with hydrogeological data.
5. Conclusions
This research has made it possible to characterize the superficial aquifer in the area of Brindisi. The stratigraphical succession was reconstructed in the area using geological surveys, which highlighted the heterogeneity of the subsoil. A sandy and sandy-slimy
15
interval was identified; previously included in the subapennine Clays, we have provi-sionally associated this interval with the as yet not formally recognised Brindisi sands formation, whose lithological characteristics, extension in the subsoil and relationship to the under- and overlying formations are described for the first time in this work. The identification of this interval has particular importance since it is a basic part of the
20
aquifer, the object of this study. In previous studies, the Brindisi sands were included in the subapennine Clays, the top of which was considered to represent the imper-meable base of the aquifer. The distinct nature of the Brindisi sands with respect to the Subappenine Clays – not only mineralogically, but above all in terms of its greater permeability – means that this formation is in fact part of the aquifer (constituting its
25
lower level), which must therefore be thicker than had previously been assumed. Con-sequently, it is impossible to give a general value for the permeability of the aquifer,
HESSD
2, 229–263, 2005 An integrated geological, hydrogeological and geophysical approach M. A. Di Paola et al. Title Page Abstract Introduction Conclusions References Tables Figures J I J I Back CloseFull Screen / Esc
Print Version Interactive Discussion
since the permeability of the Brindisi sands is lower than that of the Terraced Deposits. Hydrogeological surveys were carried out in order to characterize the waters of the superficial aquifer. To integrate and correlate geological data with hydrogeological data from specific points (boreholes), geophysical surveys were performed. The results of the surveys have enabled us to make the following considerations:
5
– the aquifer is of the phreatic type, with semiconfined conditions where its upper part is overlain with sediments of low permeability (recent continental deposits); – the subapennine Clays (Lower Pleistocene), present across the whole of the area,
constitute the impermeable base of the aquifer;
– the deposits that form the superficial aquifer are highly heterogeneous in terms
10
of permeability. The greatest permeability is found in the calcarenite deposits (Terraced Deposits, Middle-Upper Pleistocene). As the slimy fraction increases, the permeability of the deposit decreases;
– the lower section of the aquifer, characterized by the presence of slimy-sandy sediments (Brindisi sands, Lower-Middle Pleistocene), has lower permeability.
15
The results of the geophysical investigations have enabled us to reconstruct in detail the lateral and vertical lithological variations in the geological formations. It was seen that the data thus obtained can be used to supplement data from boreholes, meaning that fewer of these are necessary, an important consideration given that these are potential sources of pollution.
20
On the western side of the “Asse Attrezzato” (profiles P2 and P3), the distribution of the resistivity at the depths where the Brindisi sands and subapennine Clays are found was observed to be highly confused. In places, the resistivity values were significantly higher than those typically associated with these formations. It is difficult to account for this abrupt east-west variation with reference to natural factors (be they geological
25
HESSD
2, 229–263, 2005 An integrated geological, hydrogeological and geophysical approach M. A. Di Paola et al. Title Page Abstract Introduction Conclusions References Tables Figures J I J I Back CloseFull Screen / Esc
Print Version Interactive Discussion
human activity, possibly pollution. Indeed, it needs to be considered that the part of the “Asse Attrezzato” to which the surveys refer runs parallel to the “Canale di Scarico”, towards which flow the waters of the superficial aquifer from both east and west. Thus the “Asse Attrezzato”, whose floor lies below the water table, itself constitutes a bar-rier to the downflow towards the “Canale di Scarico” of at least the most superficial
5
portion of the groundwater, favouring the build-up, in places, of pollutants. Overall, the surveys carried out show that the “Asse Attrezzato” is a considerable impact factor for the subsoil. Support for this hypothesis is provided by profile P4, conducted on the western side of the “Asse Attrezzato”, which shows comparable resistivity values to the corresponding profile on the eastern side. This is due to the presence of the “Fiume
10
Grande”, which flows between the “Asse Attrezzato” and profile P4, and is assumed to carry away any pollutants borne in the groundwater as it downflows eastwards, toward the “Canale di Scarico”.
In conclusion, the integrated geological, hydrogeological and geophysical surveys performed in this way have made it possible to characterize to a high degree of detail
15
the superficial aquifer in the area of Brindisi, and may productively be used for the study of other areas. Furthermore, interesting results were obtained concerning the identification of factors disturbing the original hydro-geological make-up of the subsoil. Thus, further development in this research should involve:
– extension into other areas of the methodology;
20
– integration of the surveys performed in this way with others of a chemical and ecological type;
– further research in order to obtain resistivity values of reference, associated not only with given lithological types but also with other substances present in the subsoil, especially potential pollutants.
HESSD
2, 229–263, 2005 An integrated geological, hydrogeological and geophysical approach M. A. Di Paola et al. Title Page Abstract Introduction Conclusions References Tables Figures J I J I Back CloseFull Screen / Esc
Print Version Interactive Discussion
References
Andriani, G. F. and Walsh, N.: Physical properties and textural parameters of calcarenitic rocks: qualitative and quantitative evaluations, Engineering Geology, 67, 5–15, 2002.
Cherubini, C., Margiotta, B., Sgura, A., and Walsh, N.: Caratteri geologico-tecnici dei terreni della citt `a di Brindisi, Mem. Soc. Geol. It., 37, 689–700, 1987.
5
Consorzio Basi: Verifica dello stato qualitativo delle acque sotterranee all’entrata e all’uscita del polo industriale di Brindisi, Archives of Brindisi Genio Civile, 2002.
Coppa, M. G., De Castro, P., Marino, M., Rosso, A., and Sanfilippo, R.: The pleistocene with Aequipecten opercularis (Linneo) of “Campo di Mare” (Brindisi, Italy), Bollettino della Societ `a Paleontologica Italiana, 40, 3, 2002.
10
Cotecchia, V.: Studi e ricerche delle acque sotterranee e sull’intrusione marina in Puglia (Penisola Salentina), Quad. Ist. Ricerc. Acqua, Roma, 20, 1–462, 1977.
De Sousa, C.: Contaminated sites: The Canadian situation in an international context, Journal Environmental Management, 62, 131–154, 2001.
Gentile, G. M., Monterisi, L., and Ventrella, N. A.: Erosione del litorale adriatico ed arretramento
15
della falesia a sud di Brindisi (Puglia), Mem. Soc. Geol., 51, 781–791, 1996.
Jeong, C. H.: Effect of land use urbanization on hydrochemistry and contamination of ground-water from Taejon area, Korea, Journal of Hydrology, 253, 194–210, 2001.
Loke, M. H.: Electrical imaging surveys foe environmental and engineering studies. Users manual for Res2dinv. Electronic version available fromhttp://www.geometrics.com, 1999.
20
Loke, M. H. and Barker, R. D.: Rapid least-squares inversion of apparent resistivity pseudosec-tions using a quasi-Newton method, Geophysical Prospecting, 44, 131–152, 1996.
Margottini, C.: Il terremoto del 1743 nella Penisola Salentina, Memorie Conv. Ann. PFG-CNR, 251–279, 1981.
Moretti, M.: Soft-sediment deformation structures interpreted as seismites in middle-late
Pleis-25
tocene aeolian deposits (apulian foreland, southern Italy), Sedimentology, 135, 167–179, 2000.
Moretti, M. and Tropeano, M.: Strutture sedimentarie deformative (sismici) nei depositi tirreniani di Bari, Mem. Soc. Geol. It., 51, 485–500, 1996.
Petts, J., Cairney, T., and Smith, M.: Risk-Based Contaminated Land Investigation and
Assess-30
ment, Chichester, John Wiley & Sons, 1, 17–21, 1997.
HESSD
2, 229–263, 2005 An integrated geological, hydrogeological and geophysical approach M. A. Di Paola et al. Title Page Abstract Introduction Conclusions References Tables Figures J I J I Back CloseFull Screen / Esc
Print Version Interactive Discussion
Societ `a dei Naturalisti in Napoli, 57, 1968.
Ricchetti, E. and Polemio, M.: L’acquifero superficiale del territorio di Brindisi: dati geoidrologici diretti e immagini radar da satellite, Mem. Soc. Geol. It., Bari, 51, 1059–1074, 1996.
Ricchetti, G., Ciaranfi, N., Luperto Sinni, E., Mongelli, F., and Pieri, P.: Geodinamica ed evoluzione sedimentaria e tettonica dell’Avampaese Apulo, Mem. Soc. Geol. It., 41, 57–82,
5
1988.
Rivett, M. O., Petts, J., Burtler, B., and Martin, I.: Remediation of contaminated land and groundwater: experience in England and Wales, Journal of Environmental Management, 65, 251–268, 2002.
Sandberg, S. K., Slater, L. D., and Versteeg, R.: An integrated geophysical investigation of
10
the hydrogeology of an anisotropic unconfined aquifer, Journal of Hydrology, 267, 227–243, 2002.
Swaigen, J.: Toxic Time Bombs: The Regulation of Canada’s Leaking Underground Storage Tanks, Toronto: Montgomery, 1995.
Tedeschi, C.: Terreni ed opere di fondazione della Centrale Termoelettrica di Brindisi, Rivista
15
italiana di geotecnica, Napoli, 3, 1969.
Winde, F. and Van Der Walt, I. J.: The significance of groundwater-stream interactions and fluctuating stream chemistry on waterborne uranium contamination of streams-a case study from a gold mining site in South Africa, Journal of Hydrology, 287, 176–196, 2004.
Zorzi, L. and Reina, C.: Valutazione e sfruttamento delle risorse idriche sotterranee della Conca
20
HESSD
2, 229–263, 2005 An integrated geological, hydrogeological and geophysical approach M. A. Di Paola et al. Title Page Abstract Introduction Conclusions References Tables Figures J I J I Back CloseFull Screen / Esc
Print Version Interactive Discussion
EGU
Table 1. Example of hydrogeological survey.
DT
sb
AS
Date 28 Nov. 2003 Geographical coordinates Stratigraphy S 14
ID 18 X Y G.L. (m) A0 DT sb AS Borehole P 42 2772313 4502069 4.10 4.10 3.30 -3.10 -8.70
P.L. 1.08 (m/sl)
Table 1. Example of hydrogeological survey.
-1 4 -1 3 -1 2 -1 1 -1 0 -9 -8 -7 -6 -5 -4 -3 -2 -1 0 1 0 . 5 11 . 5 22 . 5 33 . 5 44 . 5 55 . 5 66 . 5 7 TD S ( g/ l ) -1 4 -1 3 -1 2 -1 1 -1 0 -9 -8 -7 -6 -5 -4 -3 -2 -1 0 1 0 . 0 0 . 5 1 . 01 . 5 2 . 0
Di ssol ved ox. ( mg/ l ) -1 4 -1 3 -1 2 -1 1 -1 0 -9 -8 -7 -6 -5 -4 -3 -2 -1 0 1 6 . 6 5 6 . 7 6 . 7 5 6 . 86 . 8 56 . 96 . 9 5 pH -1 4 -1 3 -1 2 -1 1 -1 0 -9 -8 -7 -6 -5 -4 -3 -2 -1 0 1 1 8 1 9 2 0 T emper at ur e ( °C) Depth ( m ) Depth ( m ) Depth ( m ) Depth ( m ) 251
HESSD
2, 229–263, 2005 An integrated geological, hydrogeological and geophysical approach M. A. Di Paola et al. Title Page Abstract Introduction Conclusions References Tables Figures J I J I Back CloseFull Screen / Esc
Print Version Interactive Discussion
Fig. 1. The site, underlined in grey, is delimited to the north by the city of Brindisi, to the south by the “Cerano Power Station”, to the east by the Adriatic Sea and to the west by highway 613 connecting Lecce to Brindisi.
HESSD
2, 229–263, 2005 An integrated geological, hydrogeological and geophysical approach M. A. Di Paola et al. Title Page Abstract Introduction Conclusions References Tables Figures J I J I Back CloseFull Screen / Esc
Print Version Interactive Discussion
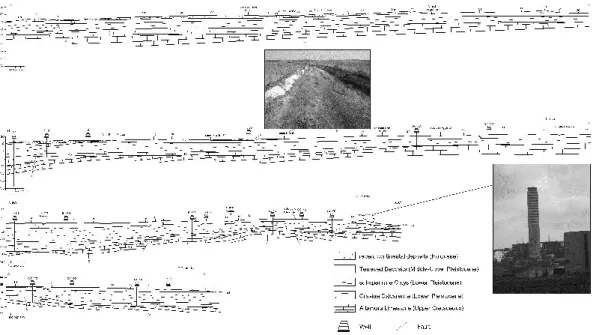
Fig. 2. Original stratigraphy provided by Ente Irrigazione (to the left) with relative interpretation (to the right).
HESSD
2, 229–263, 2005 An integrated geological, hydrogeological and geophysical approach M. A. Di Paola et al. Title Page Abstract Introduction Conclusions References Tables Figures J I J I Back CloseFull Screen / Esc
Print Version Interactive Discussion
HESSD
2, 229–263, 2005 An integrated geological, hydrogeological and geophysical approach M. A. Di Paola et al. Title Page Abstract Introduction Conclusions References Tables Figures J I J I Back CloseFull Screen / Esc
Print Version Interactive Discussion
Fig. 4. Schematic diagram showing the relations between different lithostratigraphical forma-tions.
HESSD
2, 229–263, 2005 An integrated geological, hydrogeological and geophysical approach M. A. Di Paola et al. Title Page Abstract Introduction Conclusions References Tables Figures J I J I Back CloseFull Screen / Esc
Print Version Interactive Discussion
HESSD
2, 229–263, 2005 An integrated geological, hydrogeological and geophysical approach M. A. Di Paola et al. Title Page Abstract Introduction Conclusions References Tables Figures J I J I Back CloseFull Screen / Esc
Print Version Interactive Discussion
Fig. 6. Outcrop north of the Cerano power station (cliff). (a) contact between continental Deposits (DC) and Terraced Deposits (DT), (b) contact between Terraced Deposits (DT) and Brindisi sands (sb), (c) contact between Brindisi sands (sb) and subapennine Clays (AS).
HESSD
2, 229–263, 2005 An integrated geological, hydrogeological and geophysical approach M. A. Di Paola et al. Title Page Abstract Introduction Conclusions References Tables Figures J I J I Back CloseFull Screen / Esc
Print Version Interactive Discussion
Fig. 7. Borehole core of Gravina Calcarenite with transgression breccia near the base (left). Borehole core of Altamura Limestone with remains and models of rudists (right).
HESSD
2, 229–263, 2005 An integrated geological, hydrogeological and geophysical approach M. A. Di Paola et al. Title Page Abstract Introduction Conclusions References Tables Figures J I J I Back CloseFull Screen / Esc
Print Version Interactive Discussion
HESSD
2, 229–263, 2005 An integrated geological, hydrogeological and geophysical approach M. A. Di Paola et al. Title Page Abstract Introduction Conclusions References Tables Figures J I J I Back CloseFull Screen / Esc
Print Version Interactive Discussion
Fig. 9. Exsurgence to the sea along the cliff near Cerano of the aquifer formed by the Pleis-tocene marine Terraced Deposits overlying the PleisPleis-tocene clays.
HESSD
2, 229–263, 2005 An integrated geological, hydrogeological and geophysical approach M. A. Di Paola et al. Title Page Abstract Introduction Conclusions References Tables Figures J I J I Back CloseFull Screen / Esc
Print Version Interactive Discussion
HESSD
2, 229–263, 2005 An integrated geological, hydrogeological and geophysical approach M. A. Di Paola et al. Title Page Abstract Introduction Conclusions References Tables Figures J I J I Back CloseFull Screen / Esc
Print Version Interactive Discussion
Fig. 11. Profiles P1, P4, P5 2D resistivity models: (a) P1, Wenner-Schlumberger array (b) P4, dipole-dipole array (c) P4, Wenner-Schlumberger array (d) P5, Wenner-Schlumberger array.
HESSD
2, 229–263, 2005 An integrated geological, hydrogeological and geophysical approach M. A. Di Paola et al. Title Page Abstract Introduction Conclusions References Tables Figures J I J I Back CloseFull Screen / Esc
Print Version Interactive Discussion
Fig. 12. Geological cross sections of eastern side (above) and western side (below) of the “Asse Attrezzato”, extrapolated from geophysical cross sections and stratigraphies from bore-holes present in the area.