HAL Id: halshs-00820783
https://halshs.archives-ouvertes.fr/halshs-00820783
Submitted on 6 May 2013HAL is a multi-disciplinary open access
archive for the deposit and dissemination of sci-entific research documents, whether they are pub-lished or not. The documents may come from teaching and research institutions in France or abroad, or from public or private research centers.
L’archive ouverte pluridisciplinaire HAL, est destinée au dépôt et à la diffusion de documents scientifiques de niveau recherche, publiés ou non, émanant des établissements d’enseignement et de recherche français ou étrangers, des laboratoires publics ou privés.
Heterogeneity in the Egyptian informal labour market:
choice or obligation?
Rawaa Harati
To cite this version:
Rawaa Harati. Heterogeneity in the Egyptian informal labour market: choice or obligation?. 2013. �halshs-00820783�
Documents de Travail du
Centre d’Economie de la Sorbonne
Heterogeneity in the Egyptian informal labour market: choice or obligation?
Rawaa HARATI
Heterogeneity in the Egyptian informal labour
market: choice or obligation?
Rawaa Harati
∗†‡March 2013
∗e-mail: rawaa.harati(at)malix.univ-paris1.fr
†Centre d’Economie de la Sorbonne, Universit´e Paris I Panth´eon-Sorbonne.
‡I thank Andrey Launov and Konstantin Shamruk for their attention and their help, and also
to the ERF for the use of data. The views expressed here are those of the author and do not necessarily reflect the views of the Economic Research Forum.
Abstract
This paper provides historical and empirical arguments that can explain the development of the Egyptian informal sector. After recalling the various approaches proposed in the literature, it identifies the configuration that over-rides the Egyptian labor market by allowing for the heterogeneity of informal jobs and therefore the existence of different segments within the informal sec-tor using a mixture model. It concludes that the Egyptian informal labor market in 2006 was composed of two segments with a distinct wage equations. This may point to the existence of barriers to entry to each sector, e.g. fixed cost related to social stigma which prevent people from working in the sector which offers them the highest expected wage.
JEL codes: O17, J42
Keywords: Informal market, Development Economics, Finite mixture model, Egypt, Segmentation, selection bias
R´esum´e
Ce papier fournit des arguments historiques et empiriques dont le but est d’expliquer le d´eveloppement du secteur informel en Egypte. Apr`es avoir rappel´e les diff´erentes approches propos´ees dans la litt´erature, il identifie la configuration du march´e du travail ´egyptien tout en permettant l’h´et´erog´en´eit´e des emplois informels et donc l’existence de diff´erents segments du secteur informel en utilisant un mod`ele de m´elange. Il conclut que le march´e du travail ´egyptien informel en 2006 ´etait compos´e de deux segments ayant chacun une ´equation de salaires distincts. Ceci peut indiquer l’existence de barri`eres `a l’entr´ee `a chaque secteur, par exemple, des coˆuts fixes li´es `a la stigmatisation sociale qui empˆechent les gens de travailler dans le secteur qui leur offre le plus haut salaire esp´er´e.
Codes JEL: O17, J42
Mots clefs: Economie informelle, d´eveloppement, mod`ele de m´elange, Egypte, Seg-mentation, Biais de s´election
1
Introduction
All studies agree on the large size of the Egyptian informal market which has grown fast over the last decades and was often ignored. Schneider (2011) measure of the share of informal employment in total non agricultural employment in Egypt is 45.9% between 2000 and 2007. Also the ILO statistical update on employment in the informal economy estimated this share to 51.2%. It is important to know what is the configuration that overrides the Egyptian labor market, the nature of the informal economy, are workers obliged to work informally or is it their choice? in order for policy makers to take adequate policy decisions.
In Egypt, each enterprise, according to the type of its activity, has to obtain a number of permits from concerned ministries. A small coffee shop must have permits from certain departments in the Ministries of Health, Tourism, Internal Trade and Industry as well as the District Authority. Despite the fact that such laws, rules and regulations may appear simple to undertake, practice proves otherwise. Completing any of the previous steps or conditions is both expensive and extremely time consum-ing. Some ongoing research suggests that it could take an enterprise up to one year to complete these procedures. Djankov and al. (2002) after analysing the regulation of entry in 85 countries including Egypt, concluded that heavier regulation of entry is generally associated with greater corruption and a larger unofficial economy. The whole regulatory and institutional set-up does not create an enabling environment for small enterprises. Therefore, it is wiser and more rational to sidestep them and operate informally. Moreover, the informal nature of firms impose informal contracts for its workers because there is no possibility to sign a contract or to be assigned with a social security program.
Many studies focused mostly on the actual size of the informal sector such as Schneider(1986), but other questions started to interest researchers and mainly the question of choice or obligation of workers to belong to the informal sector, i.e. whether the difference in earnings in the formal and informal sectors is the result of market segmentation or whether competitive labor market theories hold for the informal sector. The answer to this question is key to understanding labor market and giving sound policy recommendations.
The dominant approach explaining the existence of informal employment is based on the idea that the labor market is segmented into a formal primary market with high earnings and stable conditions of work, and an informal secondary market where all those without access to the primary market find themselves. This describes informal employment as a job of last resort in order to escape unemployment. Within this framework, any worker employed in the informal sector, will chose to work in the formal sector if he has the choice. This is the traditional dual labor market theory argued by Fields (1990) and Lewis (1954). After the monumental changes came to Peru as a result of the rural population’s migration to the urban areas, De Soto (1989) explained the reason why migrants became informal: “if they were to live, manufacture, trade, transport, or even consume, the city’s new inhabitants had to do so illegaly”. This labor market dualism is what has been called labor market segmentation or fragmentation. On the other hand, Maloney (2004) in his study on Latin America refutes the dualism view citing many reasons for workers to choose
voluntarily being “unprotected” (by a formal contract) and to rely more on informal safety nets in absence of medical insurance or saving for retirement in developing countries.
Each of these points of view treats the informal sector as homogeneous, assum-ing free entry and no segmentation of labor market. Other economists had different point of views: Hart (1973) enumerated many informal income opportunities de-scribing them as legitimate, and emphasizing the diversity of jobs in this sector, also Fields (1975) contended what empirical researchers label ”the informal sector” is best represented not as one sector nor as a continuum but as two qualitatively distinct sectors, it is only recently that economists have started to accept the hypothesis of heterogeneity in the informal sector. Fields (2005) presented 3 characterizations of informal sector labor markets: the informal economy as a last resort sector, the informal economy as a desirable sector and finally, an informal economy with its own internal dualism combining the first two.
Other prominent examples are G¨unther and Launov (2012), that studied the labor market in Cote-d’Ivoire using finite mixture of regression models to detect unobserved heterogeneity of informal employment opportunities, and Bensidoun and Bensalem (2011) who applied this same approach to Turkish data.
These different paradigms show several configurations of the labor market that can be structured around the following questions: Are informal jobs heterogeneous? Is the labor market segmented or competitive? Can we detect a voluntary component in informal jobs? In response, following G¨unther and Launov (2012) approach, we mobilize a finite mixture of regression models. This model provides consistent estimates of returns to individual characteristics within any of the segments of the informal sector, accounting for selection bias in the labor market. It also provides an intuitive approach to identify the size of voluntary and involuntary employment in the informal sector. The identification strategy relies on an implicit assumption that individuals strive to maximize their earnings: the fact that some individuals do not switch to the sector where they can earn more, indicates under this assumption to some constraints to free choice. However this assumption may be easily criticized as too restrictive, the microeconomic tradition assuming people to be utility maximizers in general instead of earning maximizers.
We contribute to the existing litterature on the informal market, by building up on the G¨unther and Launov approach to push further interpretations of heterogeneity of informal employment. Using the estimated finite mixture of regressions model, we calculate the probability that an individual belongs to a specified sector conditional on the observed earnings, and therefore define the segment of the labor market to which each individual belongs with a high degree of probability. Thus classifying individuals, we take a look at average characteristics of agents employed in each segment and therefore get to shed some light on their motivations.
On the other hand we add to the mass of studies of Egyptian informal economy, where little empirical work has been done and the most of contributors considered employment in the informal sector as a forced choice, a means of last resort of avoid-ing unemployment: Moawad (2009) considered the informal economy as an engine for poverty reduction and development in Egypt, finding that the informal enterprises in Egypt constitute 82% of the total number of economic units and the informally
employed - 40% of the total labor force. When linking informality and poverty, he concluded that the ratio of poverty is shocking in Egypt but being involved in the informal sector is better than not working at all. Galal (2004) tried to explain why Egyptian entrepreneurs choose to stay informal and assessed the likely wel-fare impact of formalization on different economic agents using a partial equilibrium model, concluding that under the current regulatory framework, formalization is not sociably desirable, although the potential net benefits of formalization may become positive conditional on reforms implementation. This result is in line with Loewe (2000), which stated that informality can simply result from tax evasion because of the unequal and inefficient social security system and low returns to contributions.
The rest of the paper is structured as follows: some essential facts and major historical and legal change in the Egyptian labor market are discussed in section 2; section 3 discusses the econometric issues and the specification of the mixture model; in section 4, we give the description of data and discuss results; section 5 concludes.
2
History of the legal status in the Egyptian labor
market
The first step to understand the importance, the size and the development of the informal economy in Egypt is to have a good look in the history, at the evolution of the labor market, and how it was affected by some global and regional crisis and by the government decisions during the past years. Al Mahdi (2005) emphasized the importance of the law 14 in 1964 which gave responsibility for the state to hire all graduate students from university and secondary school in government offices or in state owned companies within two or three years after the graduation, this was a populist economic policy which aimed at achieving social welfare in the form of free education, free health service, employment for everyone at the age of work, so the economic growth was sustained.
During the 70’s, Egypt was still instable not concentrating on its own economy but on its war against Israel. It is only after the camp David accord in 1978 that the Egyptian government started investing in the infrastructure.
In 1986 the country suffered from a serious budget deficit, balance of payments deficits, high inflation rate and high interest rate. Furthermore, the public sector had a very poor performance and the country was highly undebted. With these shortcomings, reforms were urgent.
In 1991, the government signed an agreement with the international Monetary Fund (IMF) and the World Bank (WB) to start the Economic Reform Structural and Adjustment Program (ERSAP) in order to correct the macroeconomic imbalances, privatizes the public sector, liberalize the foreign trade and adjust the exchange rate. Until now, It was the public sector and especially the government the main employer. The reform objective was to reduce the wage bill in order to cut the budget deficit. It is the private sector which has to be open for more job opportunities, and it became harder to find a job after graduation because there is no certainty that the public sector will hire, and the private sector employers started using this advantage to put hard conditions on workers. The ERSAP achieved good results in reducing the
budget deficit and the balance of payments deficit, it also stabilized the exchange rate and privatized most of the public sector units. But the ERSAP had also some negative consequences on employment. As Moawad (2009) explained, new entrants with no or low education, also some of those who were working in the public sector and lost their jobs, found no other option but to work informally. Therefore the informal sector was a large job absorber. So even though this program was well evaluated by the African development Bank, there is no evidence of labor allocation in the private and formal sectors (Wahba and McComick (2003)).
In 2003, some economic reforms were implemented stated by the law 12 which contains 257 articles that addresses the regulation of the Egyptian labor market. It aims to increase employment in the private sector. According to this law, private sec-tor employers can renew a temporary contract without transforming it automatically into a permanent employment status as it was stated by the previous law. Wahba, 2009 studied the impact of this law on informality in Egypt and concludes that labor flexibility introduced by this law increases formal employment. All these laws and reforms show how costs of entry and governance indicators in Egypt have changed overtime. This can help us to understand the development and the characteristics of the Egyptian informal market.
3
Econometric Issues
From the data base, we know who belongs to formal and informal market, and who is unemployed but the information which is missing is the share of people inside each informal segment if this informal sector is heterogeneous. The first step is to determine the optimal number of segments into which the informal sector could be divided, this will be the number and size of the informal segments that best describe the data. The model will give us the probability of belonging to each segment of the informal sector and the returns to individual characteristics. The second step will consist on comparing these probabilities to theoretical ones assuming that workers are earning maximizers to answer our question about the choice or obligation characteristic of the informal sector in Egypt. The third step will be to compute individual probabilities in order to understand more the characteristics of each group of the labor market.
To estimate the unknown partition of informal employment, it is not possible to use traditional parametric methods, since we estimate simultaneously the regression parameters, and the partition. That is why the most adapted method to model the heterogeneity of the informal sector will be to apply a the mixture models re-gressions to estimate parametric combinations of parametric laws, whose weights are not known. This method allows identifying homogeneous segments of informal workers in the sense that the Mincer equation is the same for all who belong to the same segment. For each segment of the labor market, we have a different wage equations. We assume that the number of segments is j, and thus density is less than the number of observations, which is to capture an unobserved heterogeneity between groups (discrete) rather than individual (continued). As our main interest in this paper is to test the heterogeneity of the informal population in Egypt, we
will assume that the formal sector is homogeneous. Our informal sector will be a mixture of different groups. In our case, individuals who are employed in formal and informal activities are known, unemployed are also known, but the segments which constitute the informal sector are unobservable, the mixture model will help us to identify them, if they exist.
For this purpose, we follow the specification model of G¨unther and Launov (2012). The labor market, denoted Γ, if heterogeneous, is characterized by J segments and each segment is characterized by a gain equation whose specificity is captured by the returns β of the individual characteristics.
ln yij = x ′
iβj + uij, i ∈ Γj, ui ∼ N (0; σj) (1)
Where yij is the wage of individual i in segment j. We suppose that there is no
correlation for errors across segments as each distribution is independent from the other. This means that the earning distribution within the segments are different and independent one another, and also the earning function and the returns (βj) to
individual characteristics (xi) varies from segment to segment.
To the extent that the sample of individuals for whom we observe wage is not necessarily random, the estimation of wage equations in each of the segments may be affected by selection bias: we have no information in our sample for those who are not employed ( non-random sample), so the corresponding observations cannot be used when estimating the wage equation. In order to take that into account this selection bias, we consider that individuals’ decision to work is a function of personal characteristics zi (Heckman 1979), as follows:
yis = z ′
iγ + uis, uis ∼ N (0; 1) (2)
z′
i contains the personal characteristics that affect the decision of working or
being unemployed. If the errors from the wage equation and the selection equation are correlated, the estimation of β is biased. Under the assumption that the joint dynamics of these errors follows a bivariate normal distribution, their correlation is equal to ρ . We apply the Bayes rule on conditional probabilities in order to write the distribution of earnings in each sector of the labor market. For the setup of the model, please see G¨unther and Launov, 2012.
The conditional distribution of wages for the entire labor market is deduced from the conditional distributions of observed wages in each segment, with a weighting by the relative size of each. However, none of it is observed. Nevertheless, it is possible to estimate the probability of belonging to a certain segment so that each segment is composed of homogeneous workers in terms of the relationship that links wages to individual characteristics.This probability can be written: P (i ∈ Γj) = πj, ∀j
where πj is the probability of any individual i to belong to any segment yj.
Using the notation θj = (ρ, σj, βj) , the distribution of observed wages takes
form: f (ln yi) = J X j=1 πjf (ln yi|yis > 0, θj) (3)
This model is a finite mixture with sample selection. Ahamada and Flachaire (2008) describes mixture models as a problem of missing data, when we have a sample
and we do not know from which group each individual comes from. The estimation will give the unknown parameters when considering the likelihood of each individual to belong to each sub group. The reason why we consider the mixture models is because they link the parametric estimation with the no-parametric estimation. If we take the extreme values: j=1, the mixture model will be reduced to a single parametric function. When we add more j’s the heterogeneity of the population will be taken into consideration. The other extreme will be j=n the number of groups we have is equal to the number of observations, the mixture will be reduced to an estimation of a density with the kernel density estimation method (non-parametric). For all j’s between 1 and the sample size n, the mixture model will be a semi-parametric model. The model is estimated with a Limited information maximum likelihood and the covariances have been corrected (Murphy and Topel, 1985)
4
Empirical application
4.1
Data
We apply this model to the case of Egypt. The data used is the ELMPS database for the year 2006. The survey is representative1 and is carried out by the Economic
Research Forum (ERF) in cooperation with the Egyptian Central Agency for public mobilization and Statistics (CAPMAS). The fieldwork for ELMPS06 was carried out from January to March 2006. The final sample consists of 8,349 households. The surveys provide a rich source of information on labor market conditions of individuals. They collect information on the characteristics of jobs such as on the presence of legal job contract and social security coverage.
Our analysis is conducted on the population of working age. Our sample includes (15-64) workers who are remunerated positively. Also, the database provides infor-mation on earnings only for waged employees, even if employers and self-employed are usually remunerated, we could not include them in our sample, and we are aware of this limitation. This leaves us with 19983 observations.
The definition used for informality is the ILO definition: Not having any contract or social security. This is the statistic definition of informal employment approved in 2003 in the 17th international conference of labor statisticians. These jobs are divided into formal and informal employment due to the characteristics of occupied jobs. The criterion of non-affiliation to social security allows identification of informal jobs. More precisely, all the workers who are not affiliated with any social security and who do not have any contract are considered informal.
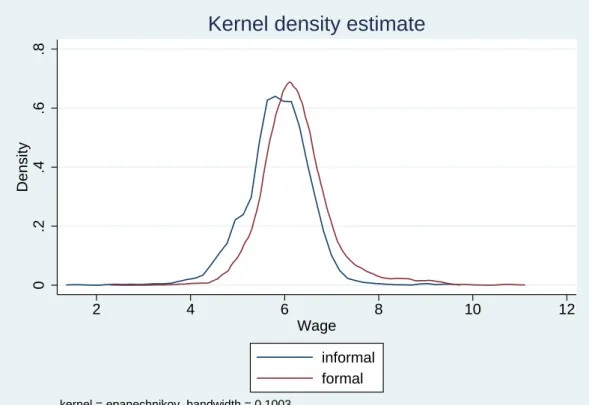
Figure 1 show kernel densities of monthly earnings in formal and informal sectors in 2006.
The graph shows an important difference in the mean earnings between the two sectors, this was confirmed by the descriptive table: on average formal workers are more paid than informal workers. Another interesting result shows that some informal workers earn more than the formal ones, also the densities of formal and 1See Assaad and Roushdy (2009) for the construction of the weights and Barsoum (2006) for
informal log-earnings are significantly different.
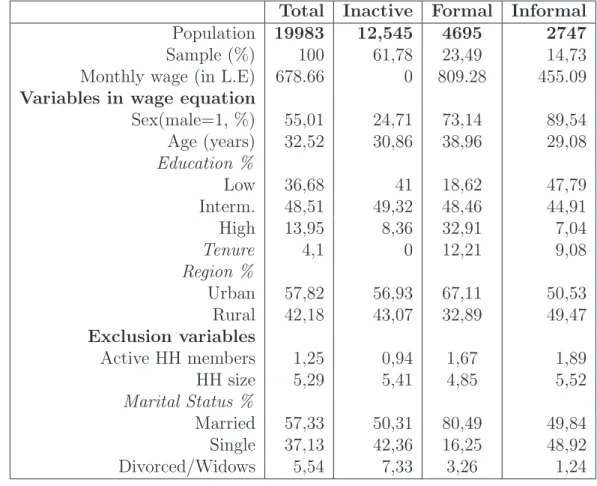
Table 3 contain descriptive statistics of all the variables used in both the wage and selection equations. The wage gap between formal and informal workers reaches 44%. Most of the workers (formal or informal) are male, and most of the unemployed are female. This is due to the society effect and the fact that women usually take care of the children and the house, while the husbands go to work. The average age for formal workers is 39 years, while it is only 30 for unemployed and it is even lower for informal workers (29 years). This means that the informal sector attracts younger workers. 33% of the formal sample is highly educated while only 7% of the informal workers attained high education. Tenure is the highest in the formal sector (12 years) but it is not insignificant in the informal sector (9 years) this means that informal workers can keep their jobs for a considerable period of time. And finally, half of the informal workers come from a rural area while only 32% of the formal employees come from this region. Additional variables are used in the selection equation: household size, the number of active members of the household, and finally, the marital status. These variables should affect the decision of participating or not in the labor market depending on individual opportunity cost of not participating, but they are not supposed to affect the earnings. One interesting finding is about the percentage of married people in each group. 77.73% of the formal workers are married, while only 39.62% of the informal one are in couple. Single have less responsabilities to worry about if they are employed on an informal basis. One can ask the question of the origin of formal vs informal workers: whether they belong to the very same category right from the beginning of their tenure. 32% (1506) of the formal workers were informal in their previous job. This can suggest that previous jobs for these employees were temporary or small jobs until they find an adequate one where they become formal. Only 3.5% (97) of the informal workers were formal in their previous job. Even after dropping these people from the sample (supposing that they are temporary informal and are looking for a formal job elsewhere), the results remain unchanged.
4.2
Choice of the number of segments
The first step in the implementation of the mixture models regression is to study the composition of the labor market. We know who belongs to the formal sector, but as we study the heterogeneity in the informal sector, we do not observe the affiliation of individual to the segments of the informal labor market. To choose the ultimate number of segments, different methods can be applied depending on our interest. As our principal interest is to estimate a density, the more adequate and simple method is to select the number of segment that minimizes the information criteria: Akaike (AIC), consistent Akaike (CAIC), Schwarz (SBC). Table 1 shows that for 2006, a two-segment informal market model is preferable to the model with homogeneous informal market. However, adding a third informal sector does not improve the specification in terms of information criteria. We conclude that the partition into two-segments is the best fitting model for the labor market .
Table 1: information criteria to select the model 2006 Homogenous 2 sectors 3 sectors AIC 32105,9 31745,8 31783.4 CAIC 32327,5 32046,6 32163.3 SBC 32228,2 31937,3 32044.0
AIC :Akaike Information Criteria; CAIC: Consistent Akaike; SBC: Schwarz
4.3
Empirical results
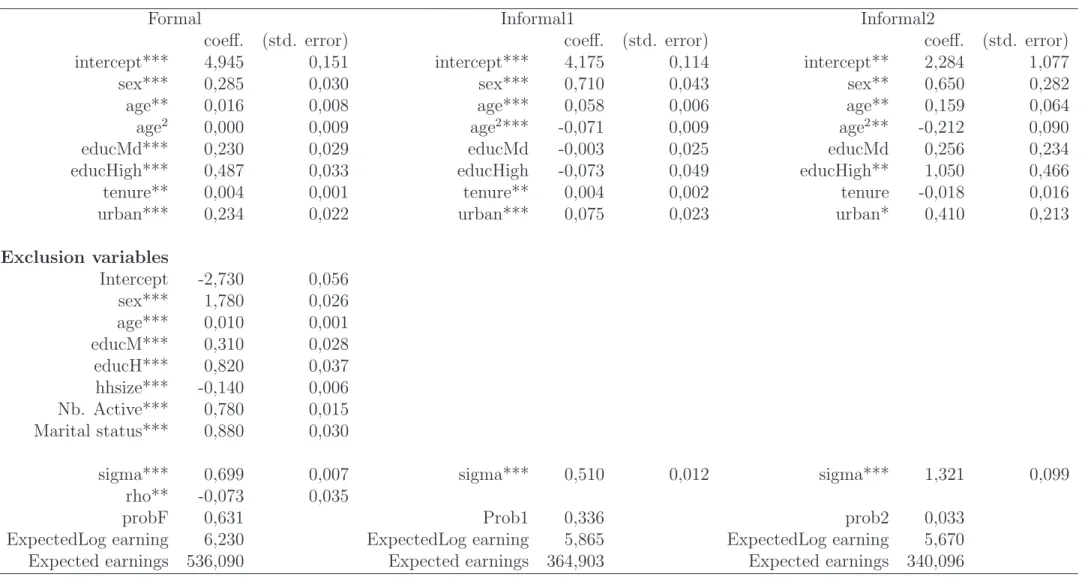
Table 5 present the results of the estimations. Informal 1 and informal 2 are the different segments in the informal sector.
The coefficient of correlation (rho) is significant. This shows how important it is to take into consideration the sample selection into the labor market when we estimate the coefficients of the wage equation.
The expected earnings in formal sector are much higher than those of the two segments of the informal market. In addition, workers, who belong to the first informal sector are in average better paid than workers in the second informal sector. (8% more approximatively)
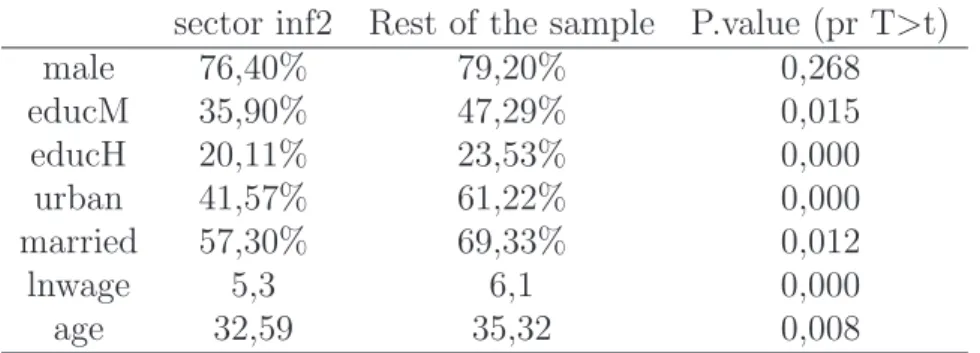
Furthermore, for the size of the informal segments, one constitute 33,2% of the whole labor market and the second one is considerably smaller (3,2%). It is true that one of the sectors is small but the reason why it is important to take it into consideration and treat it as a separate segment is the result we will see below that 28,7% of workers would have earned more if they worked in this sector. Table 6 in the appendix shows that this small informal sector is different from the rest of the sample but the difference is not outrageous.
Returns on education and tenure are the most significant in the formal sector. High education, even if not significant become negative in the higher paid segment of the informal sector. The medium education appears to have no influence at all in both informal sectors. Males are better paid than women in all the sectors. However, the discrimination between the wage of females and males is lower in the formal sector. This can be explained by the existence of some kind of control in the formal sector that prevents this kind of discrimination. Of course, this control is absent in the informal sectors. Another possible explication is that women who work in the formal sector could have better education and experience.
Location in urban regions have positive significant impact in the formal sector and the well paid informal sector but the impact is larger for the formal workers. This can be simply due to the fact that formal firms pay better in the urban areas because of their big sizes and large benefits.
The variable age is positive and significant in all the sectors, but especially in the lower paid informal one, younger workers are better off.
We can conclude that each of these segments shows a different pattern of returns to individual characteristics. But we can not conclude yet anything for the entry barriers which can exist between these sectors. The second step will be to answer the question on whether the distribution of workers between the three sectors is a
question of choice, in this case we have a competitive market where everyone is free to choose the sector he wants to work in, or it is a question of obligation where entry barriers segment the market and people would work in a certain sector but if they had a choice, they would be working elsewhere.
4.4
Choice or obligation?
Table 2: Actual and potential (earnings maximizing) distribution of individuals across sectors 2006
ˆ
πj π˜j πˆj/˜πj [Bootstrap 95% conf. int.]
Formal 0,63 0,47 1,34 [ 0,84 ; 2,07 ] Informal1 0,34 0,24 1,41 [ 1,40 ; 3,30 ] Informal2 0,03 0,29 0,10 [ 0,05 ; 0,56 ]
ˆ
πj: Estimated weights of the actual distribution. ˜πj: Estimated weights of the earnings maximizing distribution. Weights ratio ˆπj/˜πj distribution is obtained by bootstrap.
To shed light on the segmented and competitive character of the Egyptian labor market, the distribution of probability issued from the mixture model regressions with two segments (for 2006) is compared to the one resulting from a maximizing behavior of income by workers. The latter is obtained by computing the percentage of individuals in each segment for whom, given their individual characteristics, their income would be the highest in this segment:
P(i∈ yj) = P (E[log yij|yis ≻ 0; xi] = max
l,l∈[1,J]{E[log yil|yis ≻ 0; xi])}. (4)
So we identify for each individual, the segment in which his income is the highest, then for each segment we compute the proportion of individuals. If the estimated probabilities and theoretical probabilities are equal this means that individuals are in the segment that gives them maximum earnings, and therefore there is no barriers to enter the different segments of the Egyptian labor market. In this case, we can say that the labor market is competitive.
ˆ
πj is the actual estimated probabilities ˜πj is the earning maximizing
probabil-ity. Table 2 show that in Egypt, the distribution of the estimated probabilities is different from the one which can be deduced from a behavior of maximization of the revenue. 17% of formal workers would be better paid in the informal sec-tor depending on their individual characteristics, but we still do not know if they would be better paid in the first informal segment or the second one. There is also a difference in both probabilities for each informal sector. In the high paid informal sector, approximatively 24% are actually working in this sector but only 33% are earning their maximum wage in this sector. So some people would earn more in the formal sector or the low paid informal sector. The second surprising result is
for the second informal sector which constitutes only 3.3% of the whole labor mar-ket. If no barriers exist, 29% of workers would be better paid in this sector. The first impression one may have is that in developing countries, characterized usually by high unemployment, corruption and high level of poverty, people’s only concern is to find a job, no matter if it is formal or informal, but one can ask if that is true for the whole population. Is there any psychological cost for being informaly employed? Now, if the psychological effect does not matter for Egyptian informal workers, financial penalties can be very heavy. But corruption is very high in Egypt, and control if it exists, bribes can be paid to arrange the situation. However, The results found in this paper where the majority of the population would earn more in the informal sector, but still work formally or in another informal sector, suggest that these moral and financial penalities are important for some people in Egyptian society. Also workers could be maximizing utility and not only their income. The can chose to work informally because it can be easier and more flexible even if they know that the wage is higher in the formal sector.
We can conclude that the hypothesis of free entry is not respected. But these ta-bles give us only a general idea.In an attempt to understand more the characteristics of each group, we classify each individual in his group to see common characteristics of individuals belonging to the same group.
4.5
Posterior probabilities
Using the estimated model and given the observed earnings, we can assess the probability that an individual belongs to each particular sector according to the formula: P r[yi ∈ j|xi, yiθ] = πjfj(yi|xi, θj) PJ j=1πjfj(yi|xi, θj) (5)
This gives us a mean to identify the sector where each particular individual belongs to with a high probability. We superpose the results of this classification with the data on the individual-specific maximum potential earnings sectors obtained in the previous section. Table 4 quantifies the cohorts of people that chose their segment of work by obligation: the first column contains the “cohort” codes, the fist letter of each (F,I1,I2) designing the segment where individuals are actually employed, and the second letter designing the sector where these individuals would be paid the most given their individual characteristics (e.g. F-F is the group of formal workers who could not earn more by changing sector of employment, F-I1 are the formal workers who would earn more if they worked in the first informal sector I1, etc.). In G¨unther and Launov (2012) and Bensidoun and Bensalem (2012), more people would like to work in the formal sector than the number of people who already work there but we do not know if these people are actually working in the first informal sector or the second. Maybe if we knew who belongs to each group, we could understand the reasons why people took such decisions, and if they are really
obliged to stay in their sector or it is their personal choice. 2
From our results, it is obvious that the distortions to the earnings maximizing distribution of individuals are important. For example more than 35% of formally employed would be better off working in the second (smaller) informal segment, while more than half of informally employed individuals could earn more at the formal job market. This shows that there is virtual cost specific to each sector, impeding earning maximizing reshuffles. When we compute the average and total loss of wages due to non-earnings-maximizing sectors choice, we can see that the biggest average wage loss is experienced by some formal workers who do not work in their optimal informal sector: I2 and also for informal workers belonging to I1 who do not work in I2. This findings contradict the view, partially expressed in G¨unther and Launov (2012), that major distortions to the efficient distribution of workers stem from barriers to entry in the formal segment, and favor the non-monetary costs/benefits explanation.
5
Conclusion
In 2006, workers are overestimated in the formal sector, an opposing result to the one found by G¨unther and Launov (2012) for the Cˆote d’Ivoire sample, and the one found by Bensidoun and Bensalem (2009) for the Turkish data. Obviously, even if the average earning in the formal sector is higher than the informal one , for some individuals, depending on their characteristics, it can be more profitable for them to work in the informal sector. But they do not. These barriers to entry could be explained in this case as a risk aversion, some people do not dare to work in black because they fear either moral or financial penalties. Another explanation is the no-financial benefits offered to legal workers as stability, and also since 2003, more flexibility, reliable contracts and more rights (to strike per example) were offered to legal workers by the law 12 and this is not offered by the informal jobs. In this case, the assumption made here would be that workers maximize their utility and not their income. So for the formal workers, employment in Egypt appears to be an employment of choice. As for informal workers who could earn more in formal jobs, these barriers can simply be the lack of job opportunities in the formal sector; For these people, it is an employment of obligation, and for other informal workers, it is an employment of choice because of the financial and no-financial advantages offered by the informal market. Another interesting conclusion concerns the wage gap size for those formal workers who optimally would work in the informal sector, this wage gap was not big enough in order to attract them to take risks and work informally. The non-monetary benefits offered by formal jobs after the law 12 as stability and no moral judgment compared to informal employment are particularly important to offset the financial gap.
Finally, to reduce informal employment in the case the microeconomic recom-mendation militate in favor of more control on the informal sector, a maintenance of 2For instance, if we find that people who belong to I2-F live in rural regions and are married
and educated, we can understand that the reason why these people do not work in their optimal sector is that it is costy for them to migrate and find a job in the city because they are already old and have a family in their villages.
the law 12 of 2003 in order to give more benefits to legal workers and to keep them outside the informal sector and to create more job opportunities. Policymakers will need to reduce the costs and burdens of entering the formal economy. Some inter-esting extensions would be to find exactly where do these virtual prices come from, we made hypothesis to explain the results but our model do not allow us to conclude firmly on the reasons why the Egyptian workers are not distributed in their optimal sectors. Is it the transportation problem, is there risk aversion, is it fiscal evasion? what are exactly the virtual prices of being in one or another sector?
BIBLIOGRAPHY
AHAMADA I., & FLACHAIRE E. [2011], Nonparametric econometrics, Ox-ford University Press.
Al MAHDI A. [2002], Towards decent work in the informal sector: The case of Egypt, ILO, Geneva.
ASSAAD R., & ROUSHDY R. [2009], An analysis of sample attrition in the Egypt labor market panel survey 2006. In : The Egyptian labor market revisited The American university in Cairo Press.
BARSOUM G. [2006], Egypt labor market panel survey, final report, The Population Council, Cairo .
BENSALEM M., & BENSIDOUN E. [2011], Emplois informels h´et´erog`enes et segmentation du march´e du travail turc, CEE working paper, 151.
FIELDS G. [1975], Rural-urban migration, urban employment and underem-ployment, and job-search activity in LDCs., Journal of development economics, 2(2) p.165-187.
FIELDS G.S. [1990], Labour market modelling and the urban informal sector: theory and evidence: In D. Turnham, B. Salom´e, A. Schwarz (Eds.), The informal sector revisited ., Paris, OECD.
FIELDS G. [2005], A guide to multisector market models., World Bank Social Protection Discussion Papers, 0505.
De Soto H., [1989], The other path: the invisible revolution in the third world, Harpercollins.
DJANKOV S., & LA PORTA R., & DE SILANES F., & SHLEIFER A. [2002], The regulation of entry., The Quarterly Journal of Economics, MIT press, 117(1)p.1-37 .
GALAL A. [2004], The winners and losers from the merging the informal economy in Egypt , Center for International Private Enterprise(CIPE), 14.
G ¨UNTHER I., & LAUNOV A. [2012], Informal employment in developing countries, Journal of Development Economics, 97(1) p.88-98.
HART J.K [1973], Informal income opportunities and urban employment in Ghana, Journal of Modern African Studies, 11(1), p.61-89.
HECKMAN J. [1979], Sample selection bias as a specification error, Econo-metrica, 47(1), p.153-161.
LEWIS W.A. [1954], Economic development with unlimited supplies of labor, The Manchester School, 22(2), p.139-191.
LOEWE M. [2000], Social security in Egypt: an analysis and agenda for policy reform, ERF Working Paper , 2024.
MOAWAD S. [2009], The informal economy as an engine for poverty reduction and development in Egypt, MPRA, 13034.
MALONEY W.F. [2004], Informality revisited, World Development, 32(7), p.1159-1178.
MINCER J. [1974], Schooling, Experience and Earnings. , Columbia Univer-sity Press for National Bureau of Economic Research, New York.
MURPHY K., & TOPEL R. [1985], Estimation and inference in two step econometric models, Journal of Business and Economics Statistics, 3(4), p.370-379.
SCHNEIDER F. [1986], Estimating the size of the Danish shadow economy using the currency demand approach: An attempt, Scandinavian Journal of Economics , 88(4), p.643-68.
SCHNEIDER F. [2012], The shadow economy and shadow economy labor force: What do we (not) know?, IZA Discussion Paper No. 6423.
WAHBA J., & McCORMICK B. [2003], Migration and mobility in The egyp-tian labor market, ERF report, 0401.
WAHBA J. [2009], The impact of Labor market reforms on informality in Egypt: Gender and work in the MENA region, The Population Council Working Papers, 3.
0 .2 .4 .6 .8 Density 2 4 6 8 10 12 Wage informal formal
kernel = epanechnikov, bandwidth = 0.1003
Kernel density estimate
Figure 1: Density of monthly log-earnings
Table 3: Descriptive statistics for 2006
Total Inactive Formal Informal
Population 19983 12,545 4695 2747
Sample (%) 100 61,78 23,49 14,73
Monthly wage (in L.E) 678.66 0 809.28 455.09 Variables in wage equation
Sex(male=1, %) 55,01 24,71 73,14 89,54 Age (years) 32,52 30,86 38,96 29,08 Education % Low 36,68 41 18,62 47,79 Interm. 48,51 49,32 48,46 44,91 High 13,95 8,36 32,91 7,04 Tenure 4,1 0 12,21 9,08 Region % Urban 57,82 56,93 67,11 50,53 Rural 42,18 43,07 32,89 49,47 Exclusion variables Active HH members 1,25 0,94 1,67 1,89 HH size 5,29 5,41 4,85 5,52 Marital Status % Married 57,33 50,31 80,49 49,84 Single 37,13 42,36 16,25 48,92 Divorced/Widows 5,54 7,33 3,26 1,24
Source: ELMPS(2006), author’s computations. ”‘Total” refers to individuals between 16 and 65
Table 4: Number of workers who could gain more in each group and average and total loss for 2006
Groups N % Average Loss wage Total loss wage
F-F 2459 52,37 0 0 F-I1 567 12,08 39,13 22187,59 F-I2 1669 35,55 261,46 436379,1 I1-F 964 36,32 79,08 76239,01 I1-I2 479 18,05 273,12 130825,8 I1-I1 1211 45,63 0 0 I2-F 37 41,57 176,8 6543,9 I2-I2 20 22,47 0 0 I2-I1 32 35,96 136,99 4383,74
Table 5: Mixture Model for Heterogeneous (2 segments) informal sector 2006
Formal Informal1 Informal2
coeff. (std. error) coeff. (std. error) coeff. (std. error)
intercept*** 4,945 0,151 intercept*** 4,175 0,114 intercept** 2,284 1,077
sex*** 0,285 0,030 sex*** 0,710 0,043 sex** 0,650 0,282
age** 0,016 0,008 age*** 0,058 0,006 age** 0,159 0,064
age2 0,000 0,009 age2*** -0,071 0,009 age2** -0,212 0,090
educMd*** 0,230 0,029 educMd -0,003 0,025 educMd 0,256 0,234
educHigh*** 0,487 0,033 educHigh -0,073 0,049 educHigh** 1,050 0,466
tenure** 0,004 0,001 tenure** 0,004 0,002 tenure -0,018 0,016
urban*** 0,234 0,022 urban*** 0,075 0,023 urban* 0,410 0,213
Exclusion variables Intercept -2,730 0,056 sex*** 1,780 0,026 age*** 0,010 0,001 educM*** 0,310 0,028 educH*** 0,820 0,037 hhsize*** -0,140 0,006 Nb. Active*** 0,780 0,015 Marital status*** 0,880 0,030
sigma*** 0,699 0,007 sigma*** 0,510 0,012 sigma*** 1,321 0,099
rho** -0,073 0,035
probF 0,631 Prob1 0,336 prob2 0,033
ExpectedLog earning 6,230 ExpectedLog earning 5,865 ExpectedLog earning 5,670
Expected earnings 536,090 Expected earnings 364,903 Expected earnings 340,096
* significant at 10%; ** significant at 5%;
Table 6: Summary Statistics
sector inf2 Rest of the sample P.value (pr T>t)
male 76,40% 79,20% 0,268 educM 35,90% 47,29% 0,015 educH 20,11% 23,53% 0,000 urban 41,57% 61,22% 0,000 married 57,30% 69,33% 0,012 lnwage 5,3 6,1 0,000 age 32,59 35,32 0,008