HAL Id: halshs-01091725
https://halshs.archives-ouvertes.fr/halshs-01091725
Preprint submitted on 5 Dec 2014
HAL is a multi-disciplinary open access
archive for the deposit and dissemination of sci-entific research documents, whether they are pub-lished or not. The documents may come from teaching and research institutions in France or abroad, or from public or private research centers.
L’archive ouverte pluridisciplinaire HAL, est destinée au dépôt et à la diffusion de documents scientifiques de niveau recherche, publiés ou non, émanant des établissements d’enseignement et de recherche français ou étrangers, des laboratoires publics ou privés.
Public Private Partnership from Budget Constraints:
Looking for Debt Hiding?
Marco Buso, Frédéric Marty, Tran-Phuong Tra
To cite this version:
Marco Buso, Frédéric Marty, Tran-Phuong Tra. Public Private Partnership from Budget Constraints: Looking for Debt Hiding?. 2014. �halshs-01091725�
UNIVERSITÀ DEGLI STUDI DI PADOVA
Dipartimento di Scienze Economiche ed Aziendali “Marco Fanno”
PUBLIC PRIVATE PARTNERSHIP FROM BUDGET CONSTRAINTS:
LOOKING FOR DEBT HIDING? MARCO BUSO
University of Padova FREDERIC MARTY University of Nice TRA TRAN PHUONG
University of Paris
November 2014
Public Private Partnerships from Budget
Constraints : Looking for Debt Hiding ?
Buso M.
úMarty F.
†Phuong T. T.
‡Abstract
In this paper, we examine whether budget-constrained public authorities are more likely to use a PPP (Public Private Partnership) than traditional procurement methods. Then, we study the possible mechanisms underlying this choice. Our empirical test focuse s on France and consists of a two-stage approach. First, we examine the impact of budget constraints on the use of PPPs and find a positive relationship. Second, to better delineate the debt hiding effect, we exploit the 2011 changes to the ability to underwrite PPP debts. We find that debt hiding is a relevant, but not a sufficient element to explain budget-constrained governments’ attitudes towards PPP.
ú[email protected] INRA, Laboratoire d’Économie Forestiére, University of
Pa-dova
†[email protected]University of Nice Sophia-Antipolis ‡[email protected]Sorbonne Business School
We are grateful to Marco Bertoni, Massimiliano Bratti, Alessandro Bucciol, Michael Klien, Scott Masten, Johan Nystrom, Stéphane Saussier, Stéphane Straub, Luciano Greco, Mario Padula, Lorenzo Rocco, Paola Valbonesi, Luigi Moretti, Enrico Rettore and participants at the IRSPM 2013, RSSIA 2013, IIPF 2013 conferences and "The economics of Public Procurement workshop 2013" in Stockholm for their valuable comments and suggestions on different versions of this paper. The authors would also like to thank the Mission d’appui aux partenariats public privé (MaPPP) for providing data and useful information. Any remaining errors are the authors’ responsibility.
1 Introduction
In recent decades, governments’ behaviors and policies have been significantly affected by public financial restraints stemming from domestic policies, financial markets, or regulatory measures. One prominent example is the limits on deficits and debt imposed by the European Union according to the terms of the 1992 Maas-tricht Treaty. As a consequence, resources available for pursuit of public invest-ment strategies have been increasingly rationed, which in turn makes the choice of an efficient organizational structure crucial for the realization and management of public investments. In this context, alternatively to the traditional “market-hierarchy” or the “public-private” dichotomy,1, hybrid organizational forms such
as Public Private Partnership (hereafter PPP)2 has grown considerably in
re-cent decades and nowadays account for a significant portion of public investment (Posner et al. [2009]).
Under budget constraints, however, this organizational choice is subject to debate and criticism because PPPs are considered more costly than traditional public funding methods, in terms of both organizational and financial costs (see
Marty and Tran [2014] for a review).This question raises concerns because the determinants of organizational choice in the public sector are known to be par-ticularly crucial due to fundamental differences between public and private ac-tors’ respective organizational purpose, incentives, and behavior (Mahoney et al.
[2009], Hodge and Greve [2007],Rangan et al. [2006], Zeng and Chen [2003]). In this stream of literature, the private sector, which represents for-profit organiza-tions, has a smoother decision-making processes. In contrast, the public sector experiences more turbulence, interruptions, recycles, and conflict (e.g., Perry and Rainey [1988], Rainey et al. [1976], Ring and Perry [1985]). Moreover, as sug-gested by the long-standing theoretical tradition on public choice and the related emergence of New Public Management approach (hereafter NPM) in public pol-icy, public managers are not considered to differ from private managers. They are self-interested and rational decision makers who primarily seek to maximize their personal utility (Niskanen [1975]). Both types have conflicting incentives in meeting the responsibilities to manage the organization well and achieve some private benefits (Ronen and Yaari [2008]).
As a consequence, practitioners often consider the use of PPP under budget constraints as being to their fiscal advantage (NAO [2011]),PwC [2010]). Indeed, the 2004 Eurostat decision classifies PPPs as non-governmental according to the “risks and rewards” criterion (Heald and Georgiou [2011]). Following this guid-ance, public authorities can account for PPP activities as being off balance sheet when the construction risk and at least one of either availability or demand risk are transferred to the private operator3. This accounting rule might therefore
1. We refer to public enterprises as the “hierarchy” model, traditional public procurement as the “market” model, and privatization as the complete private model
2. PPP are contractual agreements allowing involvement of private sector capital and exper-tise in the realization and management of an asset that will be returned to the public sector after an adequate period of time (the “bundling” mechanism afterHart [2003a]).
increase incentives in favor of PPPs for reasons other than the to-be-achieved advantages of this organizational form. This motivation might be even more im-portant given the recent fiscal constraints on the public sector to reduce public debt. This trend has been reported not only in the UK, but also in other Euro-pean countries such as Greece, Spain, Portugal, and Ireland.4 As a consequence,
more officially, a July 2011 report by the UK House of Commons in recommended limiting the use of PPP (Parliament [2011]).
In the private sector, a similar accounting strategy (but more widespread in terms of practice) is called earnings management, i.e., a collection of managerial decisions that results in the true short-term, value-maximizing earnings as known to management not being reported (Ronen and Yaari [2008]). The motivation behind the use of this accounting strategy has been widely studied. In general, scholars find that managers often use this method to window-dress financial state-ments prior to public securities offerings. This strategy can have the objective of improving firms’ financial capacity, i.e. which is beneficial for shareholders. At the same time, it can reflect managers’ self-interested motivations such as increasing their own compensation and job security, even though such actions might destroy value and harm shareholders (see Ronen and Yaari [2008], Healy and Wahlen
[1999] for a review).
This question has also largely studied in terms of the public sector. Recently,
Klien and Tran [2014] find that under an environment of high political competi-tion, where mayors have uncertain futures, they are more likely to choose PPP instead of traditional procurement to realize public investment in infrastructure. The authors offer two main explanations of this result. First, mayors might seek to achieve better projects through PPPs. Second, mayors might seek to manage earnings, i.e., hide public debt, in order to gain voters support. However, no em-pirical evidence exists on this topic. Other scholars in the public finance field seem to agree regarding public managers’ motivation in using budget gimmicks to sat-isfy general regulatory measures (Buti et al.[2007], Von Hagen and Wolff [2006],
Milesi-Ferretti[2004],Peterson[2003],Briffault and Fund[1996],Easterly[1999]). In the public choice field, scholars also find evidence for public managers’ actions in terms of public policy towards balanced budget requirements. These practices might be either beneficial to public organizations (Hou [2013]) or opportunistic (Rose [2006]).
In this article, we aim to explain why the public actors choose PPP when they face some financial restraints. More specifically, we try to find evidence for man-agers’ adoption of a PPP strategy only for fiscal circumventing motivations, i.e., putting public debt off the balance sheet. Several studies have found a correlation between the use of PPPs and financial constraints (seeHammami et al. [2006] for the country level, andAlbalate et al.[2012] for the local government level). We go 4. For example, the Financial Times reported that in 2002, Goldman Sachs helped Greece raise its off balance sheet finance “by arranging a massive swaps transaction aimed at reduc-ing the cost of financreduc-ing.” The press report explained: Because it was treated as a currency trade rather than a loan, it helped Greece to meet European Union deficit limits while pushing repayments far into the future (Financial Times, Athenian arrangers, February 17, 2010, p7).
further in explaining the rationale behind the choice of this organizational form when governments are budget constrained.
Using data from France, we first empirically test if local governments are more likely to use PPPs under budget constraints. Exploiting a feature of French institutional context, where it has been mandatory for local PPP to be accounted for on the public account since January 1st, 2011, we are then able to identify if this behavior occurs due to a fiscal circumventing motivation, i.e. debt hiding. As a conclusion, we find that strict budget constraints are associated with a more frequent tendency to invest through a PPP. However, while the new rule negatively impacts the use of PPPs, the effect of budget constraints persists, especially when financial costs are considered. We then conclude that the adoption of PPPs is driven by restrictions on financial resources, not merely for debt hiding motivations.
We contribute to the literature in several ways. First, our research question sits at the cornerstone of both the Public Administration Management (hereafter PAM) and Public Financial Management (hereafter PFM) fields. While PAM scholars often focus on the activities and managerial practices of public adminis-trators (Svara[2001]), PFM research is well suited to address the effects of complex technical activity on these practices (Kioko et al. [2011]). Our paper follows the same approach in the sense of studying the impact of governments’ financial situ-ations on their organizational choices. Despite its relevance in the PFM field, this topic is rarely recognized in the PAM mainstream (Kioko et al.[2011])5. Second,
we are the first to study the adoption of PPPs according to its specific decision making structure, i.e., French municipalities. We benefit from the fact that we obtained data on all PPP projects adopted by local governments and that we are able to make a comparison between a suitable group of municipalities out of all 36,000 French municipalities. Finally, we are the first to shed light on the reason behind the choice of PPP under budget constraints. This is a crucial point as it has been contested by both academics and practitioners. Our conclusion can therefore provide better understanding of PPP adoption from both a theoretical and practical standpoint.
The paper is organized as follows. Section 2 describes the related literature and derives testable hypotheses. Section 3 discusses the French institutional con-text and legal environment regulating PPPs. Section 4 presents a description of the data and our empirical approach. Section 5 reports the analysis result and robustness checks. Section 6 discusses several main results. Finally, Section 7 concludes.
5. Some noteworthy exceptions of PFM studies that are relevant in the PAM field are Hou
2 Related literature and Hypothesis development
2.1 Financial constraints and PPP
The first objective of the present study is to determine whether public man-agers choose PPPs as an organizational choice when they are financially con-strained. This question is therefore not limited to the “make or buy” strategy but also the strategy of “how to buy”. Indeed, the choice of each available orga-nizational form has to be explained: why is this particular mode of transacting preferred over others? In our case, the most frequently considered alternative strategy to PPPs is the simple contract model, i.e., traditional procurement. As such, the question is more specifically why PPPs would be preferred over tradi-tional public procurement methods.
This question of organizational strategy represents the choice between hy-brid organizational forms (PPP) and the market model (traditional procurement). This aspect has been largely studied by transaction cost theory scholars (hereafter TCT). In this stream of literature, managers are believed to always select the lowest-cost transaction structures that effectively protect firms against partner opportunism ,i.e., “self-interest seeking with guile” (Williamson [1985]), ensure that partners fulfill contractual obligations, and provide a framework for dealing with uncertainties (Williamson[1996],Williamson [1991]). Under a hybrid model, the legal ramifications and coordination complexities are considered to typically involve higher costs than those of simple contracts (Hennart[1993], Kogut[1991],
Murray and Siehl [1989]). However, that simple contracts might become inade-quate for certain types of transactions for several reasons: first, partner oppor-tunism is often difficult to detect; second, firms invest in specific assets; and third, product attributes or performance objectives cannot be precisely specified ex ante (Heide and John [1988], Williamson [1975]). As a consequence, a hybrid model might be an efficient means to reduce these governance problems. Economic ef-ficiency implies that if the hybrid format is chosen, its benefits are judged to outweigh their higher costs (Hennart [1993],Kogut [1991]).
In the same line, and more relevant to our topic, scholars from the economics field argue that PPPs may be preferable to traditional procurement even when governments are credit constrained (see Engel et al. [2013], Auriol and Picard
[2013], Buso and Greco [2014]). These studies focus on analyzing how the costs imposed on taxpayers to collect funds for financing an investment, i.e., distor-tionary taxation, can affect the choice between PPPs and traditional procurement. According to Engel et al. [2013], the presence of a shadow cost of public funds (lower governmental spending capacity) is not a sufficient argument for preferring PPP in a multiperiod context unless governments are hit by liquidity constraints. Conversely,Auriol and Picard[2013] find that shadow costs become relevant when comparing the public regime with PPPs6 for the realization and operation of a
public facility7. Their paper examines a different context than that explored in
6. More precisely, they studied Build-Operate-Transfer (BOT) contracts. In this type of PPP, the private partner is in charge of construction, operation, and financing tasks.
Engel et al. [2013]. Indeed, their model assumes that the private actor is allowed to operate under a laissez-faire regime. Furthermore, under the PPP solution, the private actor is the project manager. Therefore, information asymmetries are much weaker compared to those in traditional procurement, where the public actor is the project manager. Despite following a different approach, Buso and Greco [2014] reach a similar result. Their theoretical model is also built under the context of asymmetric information but the level of public service provision is set by the government both under PPP and traditional procurement. Within this framework, savings on distortionary costs under PPP come from the implicit incentive of the private actor due to his long-term involvement in the project.
On the empirical side, evidence is found for the impact of fiscal restrictions on the choice of PPPs. At the local government level, Russo and Zampino [2010] correlate PPP investment and municipal budget data in the Italian context. They show a strong positive relationship between local public debt and the number of PPP projects. Deficit, in contrast, is not statistically related to PPP choice. Similarly, Albalate et al. [2012] find a positive impact of debt level on the level of private involvement in public projects in the US. However, their results show a negative impact from tax revenue. They argue that states with higher revenues are likely to be less reliant on private investment. Hence self-finance capacities seem to have the opposite effect of debt. In the same context as ours, Klien and Tran [2014] also find that French municipalities’ debt and deficit levels are positively associated with the use of PPP.
We then develop our first hypothesis:
Hypothesis 1: When governments are financially constrained, public managers are more likely to use PPP than traditional procurement to realize public infras-tructure.
2.2 PPP under Financial Restraints: Fiscal
Circumven-tion MotivaCircumven-tions
In the private sector, earnings management practices, i.e., a collection of man-agerial decisions that results in not reporting true short-term, value-maximizing earnings as known to management, have been widely studied (Ronen and Yaari
[2008]). Firms operating under financial constraints are found to be more likely to distort their reported financial performance. Motivations behind this strategy might be to raise capital, attract external financing, or improve investment effi-ciency (Linck et al. [2013], Dechow et al. [1996], Dechow et al. [2011], Jackson et al. [2009], Teoh et al. [1998]). In a different vein, other studies argue that private managers have self-interested motivations to use this accounting strategy (see Fudenberg and Tirole [1995], Adams et al. [2008] for theoretical perspec-tives on this issue). Many empirical studies have also found evidence regarding managers’ motivation to boost their own compensation (Burns and Kedia [2006],
Bergstresser and Philippon [2006], Efendi et al. [2007], Cornett et al. [2008]) or to address to their career concerns (DeFond and Park [1997]).
con-straints. The public finance literature focuses on this topic in a general way and stresses that public actors have an incentive to shift debt off the public budget, potentially to meet fiscal constraints or to gain voter support. Originally, East-erly [1999]’s theoretical model claims that constraints on conventional measures of budget deficits or public debt will only induce an illusionary fiscal adjustment since government will prevent changes to its net worth. The argument states that governments seek to maintain current spending levels while reducing explicit debt and deficits, by “(1) cutting public investment, (2) privatization, (3) shift-ing revenue and expenditure over time, or (4) runnshift-ing implicit liabilities.” Buti et al.[2007] found a positive correlation between deficits/debts and the recourse to stock-flow adjustment, i.e., hiding deficits or selling assets. They claimed that the adoption of the Stability and Growth Pact seemed to be associated with a greater use of fiscal gimmicks. Taking a broader approach, Milesi-Ferretti [2004]’s theo-retical model showed that under strong fiscal rules, creative accounting appears. Following this model, Von Hagen and Wolff [2006] provided empirical evidence regarding government use of creative accounting to circumvent fiscal rules. Ac-cording to their findings, the 1997 introduction of the Stability and Growth Pact in the European Union resulted in the use of creative accounting. More precisely, in order to hide deficits, governments used stock-flow adjustment such as annual changes in the debt level less annual budget deficits. As a result, in reality, the debt level should have been higher than official deficits suggest. Finally, with a similar objective, Milesi-Ferretti and Moriyama [2006] took a different approach and analyzed whether or not the reduction of government debt in the EU is cor-related with a reduction of government assets in the context of euro adoption. They found a strong correlation between debt reduction and asset sales as well as reductions in public investment in the previous year. This result suggests that “an exclusive focus on deficit and debt levels conveys a misleading picture of the evolution of the underlying fiscal situation.” As a result, in the context of financial restraints, a public manager may choose a PPP to reduce the official municipal debt burden.
In the same line of thought, scholars of the PFM and public choice fields fo-cus on the impact of balanced budget requirements on public policy in terms of financial issues (Hou and Smith [2010]. Among others, Chaney et al. [2003] conclude that balanced budget requirements reduce pension fund levels as states draw from these funds to meet balance requirements. Another finding concerns the debt management behavior of public managers. Indeed, Hou [2013] argues that under financial constraints, governments might seek to retire debt in boom years in order to preserve their debt capacity and reduce borrowing costs. How-ever, they will incur debt in bust years to obtain a lower interest rate. Finally, opportunistic behavior of public managers is drawn fromRose [2006]. This study shows that public managers, under strict no deficit carry-over rules, counter pre-election spending and post-pre-election restraint patterns that characterize political business cycles.
As a consequence, debt hiding might be a possible motivation to explain the adoption of PPPs in a budget-constraint context. In isolating specific debt hiding
motivations, we evaluate their relevance and the extent to which they explain the financial restraint effect on the use of PPP.
Hypothesis 2: Without the possibility of debt hiding, the impact of financial restraints on the use of PPPs should decrease significantly.
3 Institutional details
In this section, we first focus on describing French municipalities’ budget elab-oration and control processes. Then, we analyze how PPP accounting rules can lead to debt-hiding behaviors. Finally, we present the French PPP context.
3.1 French municipalities’ budgets
France has 36,000 municipalities, which are called “communes" and repre-sent the fifth administrative level in France. Each has a mayor and a municipal council who jointly manage the area’s administration and have exactly the same powers no matter the commune’s size. In terms of investment, they are in charge of pre-primary and primary schools, libraries, cultural/sport centers, and urban equipment. The principle of municipal self-government leaves gives the munici-pality wide scope to take responsibility for its own investments, organization, and financing. However, their budgets are constrained as they have to achieve a bal-anced public account for both investment and operation sections. This balbal-anced budget requirement contains both political and technical dimensions in the sense of Hou [2006].
Following the General Code for Local Authorities,8 municipalities are obliged
to annually specify their balanced budget for the coming year, which should con-tain a plan for balancing their investment and the operating budgets. ing revenue is mainly composed of local taxes and government grants. Operat-ing expenses are those related to the municipality’s on-goOperat-ing operations: staff salaries, infrastructure maintenance costs, expenses related to the municipality missions, and financial costs of existing debt. Investment revenue comes from several sources. Operating budget surpluses provide the majority of the invest-ment budget (42% in 2012). Governinvest-ment transfers and subsidies represent 24%, duties 10%, and finally, local taxes and loans represent the remaining 24% (OFL
[2013]). Investment expenses cover annual debt service payments as well as new investments in infrastructure. It is important to emphasize that France has a “golden rule" regarding the public budget: public authorities can borrow only to invest and not to fund current operational spending.
As enacted in the Constitution in 2008, public accounts must be balanced as a multi-annual objective. This objective is controlled by two levels: the Administra-tive Courts and the Regional Court of Accounts (Chambre régional des Comptes). The first control includes the Prefect’s supervision over the effective balance of 8. France’s General Code for Local Authorities (Code général des collectivités territoriales
-CGCT) includes laws and regulations applied to local authorities’ three main levels:
municipalities’ accounts, as well as the possibility of the administrative courts taking action against a mayor’s misuse of power. The second instrument aims at checking both the ex ante achievement of the balanced budget requirement and ex post excessive deficits with respect to balanced budget targets (5-10%)9.
In such a context, heavily indebted municipalities have higher levels of budget constraints placed upon their ability to achieve their infrastructures investment strategies (CES [2012]). Public investment levels in France are known to have dropped in the 1990s due to a hard budget constraint and a high level of public debt. In fact, existing debt is a burden for municipalities’ operating and in-vestment budgets: high level of existing debt pushes up both the corresponding financial costs (which are part of the operating expenses) and the annual debt service (which are part of the investment expenses). As a consequence, the self-financing capacity of these municipalities is reduced. In order to achieve the same level of investment as other municipalities, they can only take larger and more costly loans from commercial banks.
3.2 PPP and Debt Hiding motivations
As discussed above, given that PPP could be accounted off balance sheet fol-lowing the Eurostat decision in 2004, it seemed to offer a possible method to circumvent budget constraints. The Eurostat rule classifies infrastructure real-ized through PPP as non-governmental through the “risks and rewards” criterion (Heald and Georgiou [2011]). Following this guidance, public authorities have accounted PPPs off balance sheet when the construction risk and at least one of either availability or demand risk are transferred to the private operator. In such a manner, a PPP was accounted based on the logic of accrual accounting: the an-nual payment related to investment, financial, and operating costs was reflected in the public account; the remaining debt element was accounted as a multi-annual plan of payment in an appendix to the balance-sheet. As a consequence, debt corresponding to a PPP did not appear on the public balance sheet.
This accounting rule might increase incentives in favor of PPP procedures for other reasons than the to-be-achieved target of value for money. The first level is the budgetary level. As discussed in Section 3.1, PPPs can enable public authorities lacking a sufficient capital budget to nevertheless achieve their desired capital investment strategy. In fact, while a traditionally procured capital project presents a significant immediate hit to a municipality’s capital budget, PPPs will have a smaller (but much longer lasting) impact. Second, the French target, in place since 2005 to reduce Public Sector Net Debt from 66% of GDP to under 60%, could provide an incentive to favor PPP over spending funded directly by government borrowing. This reflects the fact that in the short term, a PPP scheme would result in reduced government borrowing and therefore a lower level of Public Sector Net Debt. Third, European level requirements, i.e., the Maastricht Treaty, obliges member states to avoid excessive budgetary deficits. More precisely, it states that governments’ annual deficit and debt should not exceed: (a) 3% for
the ratio of planned or actual government deficit to gross domestic product at market prices, and (b) 60% for the ratio of government debt to gross domestic product at market prices (OJEU [2004]). These European fiscal rules therefore motivate the use of investment methods that allow off balance sheet accounting. Finally, public managers’ self-interest can not be excluded. Indeed, a mayor might choose PPPs according to a debt hiding strategy in order to improve the public account with the objective of gaining voters support.
3.3 PPP in France and the New Accounting Rule
With a long tradition of using private capital in public services,10, the French
legal system features a wide range of PPPs which can be classified into two main categories: users-pay contracts and government-pay contracts (see MaPPP
[2013]). The Contrat de partenariat, the most used of all the government-pay contracts, is one of the main drivers of the current PPP trend in France (EPEC
[2012]). This form of PPP entails the bundling mechanism (in the sense of Hart
[2003b]) and is the equivalent of the Private Finance Initiative created in 1992 in the UK.
French public authorities have to follow three steps for implementing a PPP. The first one is to conduct an évaluation préalable (hereafter “assessment study" or “preliminary assessment"). In this step, the public authority carries out an anal-ysis (typically through a consultancy agency) to compare the PPP organizational form with alternative solutions regarding a project’s global cost, performance as-pects and risk sharing matters. In these preliminary assessments, the most used alternative solution is the traditional public procurement. This assessment of a central government project is then verified by the Mission d’appui aux partenariats public privé (hereafter MaPPP). This organization is the French PPP taskforce located in the Ministry of Economies and Finance. However, since its creation in 2004, the MaPPP department has produced appraisal reports for 163 local PPP projects. The second step is the procurement phase, where the competitive dialogue is the most-used awarding procedure. This step takes on average 15 months, after which comes the last step, where the preferred bidder is selected and the contract is signed (see EPEC[2012]).
At the end of 2010, the French Government introduced a Decree on the topic of PPP accounting rules. This Decree requires PPP projects at the local level to no longer be recognized off the balance sheet, and applies to both existing and new projects. Two reasons motivated this clarification of PPP accounting. First, it reflects a desire to follow the UK experience in PPP, which is the most advanced in the world. Indeed, in 2011, the UK Government committed to providing more transparency to PPP accounting. The Office for Budget Responsibility decided to include an assessment of the impact of PPP liabilities in their fiscal sustainability report, a break with previous years’ National Accounts (Parliament [2011]). Sec-10. One of the first still existant PPP (affermage) was created at the XIIth century (Carpentier
et al.[1987]). Moreover, the construction of the Eiffel tower in 1887 can be considered the first
ond, the application of the International Financial Reporting Standards (hereafter IFRS) implied a switch from the previously used “risks and rewards” criterion to the control criteria for PPP accounting. More precisely, under a PPP, if the public authority controls one of the following five aspects of the project, the correspond-ing debt should be accounted on balance sheet: (a) the private operator is not able to sell or take out a loan on the equipment, (b) the occupation of a public-owned domain, (c) the definition of the equipment’s main features, (d) public services’ management, (e) the revenue paid to the private operator for his service. This new rule has led to on balance sheet recognition of the asset and corresponding debt upon the infrastructure’s delivery. In other words, the balance sheet records the investment’s capital value as an asset, while the already-paid investment and remaining debt are recorded as liabilities. For both these reasons, we can argue that the rule is not affected by PPP’s supporters or detractors.
4 Data and empirical strategy
4.1 Data
4.1.1 Treated group: PPP Dataset
In the present study, we exploit the application of the 2011 Decree to isolate the possibility of debt hiding in order to answer to our research question. Indeed, the new regulation’s implementation ensures a greater transparency regarding the governmental body’s real financial situation and might therefore significantly reduce the temptation to choose PPPs to hide debt (Dupas et al.[2012]). To test our hypothesis, we choose to focus our analysis on the municipal level instead of including the two other levels of public administration, i.e., department and region. This choice allows us to study comparable public entities that have the same power of decision-making regarding public investment. Moreover, all studied dimensions are also equivalent among them.
Our principal dataset is comprises the totality of 101 PPP projects enacted at the municipal level. These projects were concluded between 2004 and Au-gust 2013 by 95 municipalities and inter-municipalities.11 In order to preserve
the comparability of the 101 observations, we choose the biggest municipality of the inter-municipalities as the public actor. We collaborate with the MaPPP de-partment to collect the main project characteristics such as the concerned public entity, year of signature, type of project, and its capital value.
Figures 1and 2describe PPP trends at the French municipal level since 2005. The number of PPPs has remained stable from 2007 to 2010, then increased considerably since 2011, before finally slowing down in 2013. Regarding the cu-mulative amount of projects, i.e., the value of the projects’ capital investment, it increased through 2008, then dropped in 2009, rose again in 2010, and finally fell in 2012. Although we observe a slow recovery in 2013, the reduced number
Figure 1: PPP trend in France: Number of projects at the municipal level
Figure 2: PPP trend in France: Cumulative amount of projects at the municipal level
of assessment studies suggests that the number of PPPs will not rebound to pre-2011 levels in the near future (Klien and Tran (2014)). We also note that our sample includes 55 PPP projects before 2011 and 56 after 2011. Therefore, the two groups are equivalent in terms of number for a comparison of the effect of the 2011 Decree.
4.1.2 Control group: Matching Strategy
To analyze the reasons behind the choice of PPPs in France under a budget constraint context, we utilize a matching strategy to select a control group that is similar to our treated group in terms of need for public infrastructure. This need is determined through a dataset describing the characteristics of all 36,000 French municipalities provided by the French National Institute of Statistics and Economic Studies (INSEE).12. The use of a matching strategy particularly fits our
need. Indeed, this choice-based sampling design is frequently chosen in evaluation studies to reduce costs of data collection in situations where the potential control population is much larger than the treatment sample (Rosenbaum and Rubin
[1985], Rubin and Thomas [2000],Heckman and Todd [2009]).
We first estimate the propensity score using a logistic regression and a nearest neighbor estimation. The dependent variable is a dummy describing whether or not a municipality has undertaken a PPP investment. The covariates represent municipalities’ need for infrastructure. We not only follow Bahl and Duncombe
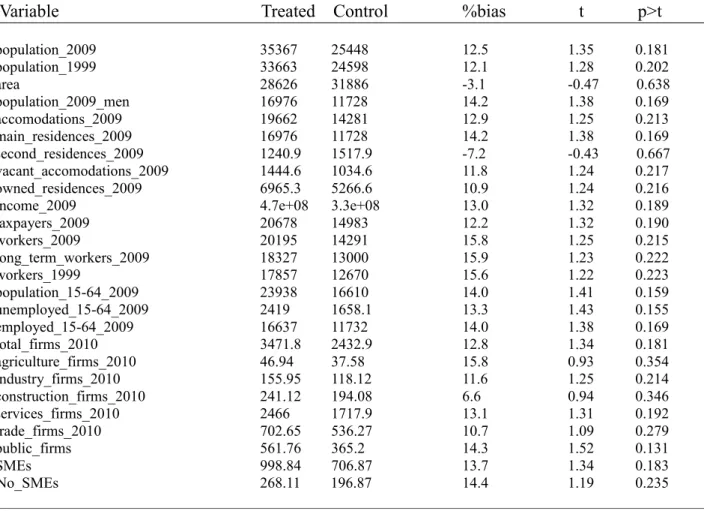
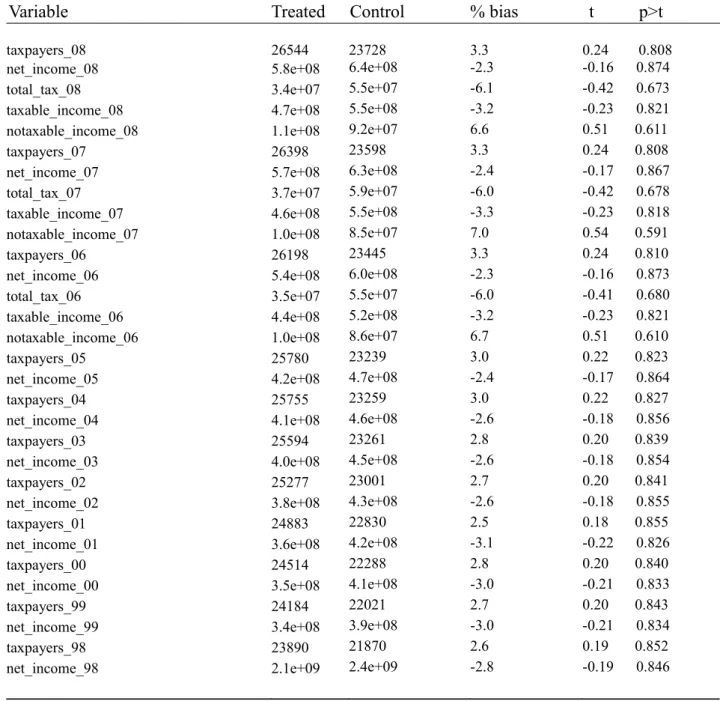
[1993] in using municipality population and the income level to measure pub-lic investment demand but also include other variables covering the years 2009, 2010, and 2011: population, area, number of households, total income, total tax revenues, number of workers, number of unemployed people, population age distri-bution, number of firms in different sectors, number of public firms, and number of small and medium enterprises. Second, we choose the two nearest neighbor observations in terms of propensity score for each municipality in our treatment group. We thus finally obtain a sample of 303 municipalities, with 101 included in the PPP group (hereafter “treated group”) and 202 in the group without PPP (hereafter “control” group). We report the similarities of our two groups during the study period in Tables 2 and 3.
4.1.3 Financial and Political Datasets
In order to analyze our research questions, we collected financial data for the period between 2004 and 2012 for virtually all French municipalities from the website of the Ministry of Economy and Finances.13 This dataset records the
general financial information on each municipality’s yearly accounting statement of such as investments and expenses, as well as the revenue structure including
12. This dataset is available on the INSEE website.
13. These financial informationare available on the website www.colloc.bercy.gouv.fr. We collect this information through the Python program. The dataset is therefore available from the authors upon request.
deficits and public debt. In this dataset, municipalities are organized in 30 “ref-erence groups” classified by population size, participation in public establishment of inter-municipal cooperation, and any additional tax systems adopted by the inter-municipal institution. For each reference group, the average value of each financial dimension is provided. Therefore, in our analysis, we are able to con-sider the difference of each financial variable for each municipality from those of its reference group. Accordingly, we are therefore able to compare municipalities to others within the reference group as well as compare each to the reference group over time. We also consider the gross value of each financial dimension as a robustness check and find that results do not differ. For the remainder of the paper, we therefore only mention the difference in value between municipalities’ financial dimensions.
Two other datasets are used to capture political and managerial dimensions. The first one comes from the Center of Socio-Political Data at the Paris Institute of Political Studies (Sciences Po). This dataset contains the main information about municipal elections, for example the mayor’s political party. We complement this by adding information on the mayor’s personal characteristics taken from the National Repertory of Politicians dataset of the Ministry of Interior.14
4.1.4 Final Panel Dataset
Table 1: Panel Dataset Description
Treated Control 101 obs 202 obs P P P≠ amount 32,3 0 Annual≠ Investment 26,2 29,9 Operation≠ result 4,8 5,5 Overall≠ result 4,7 5,9 Debt 63,6 45,2
Annual≠ debt ≠ payment 9,3 5,6
Subsidies 24,4 21,6
Reported value is the means in million euro over the period 2003 - 2012
Finally, we obtain a panel dataset allowing us to compute the effect of a municipality’s financial constraint on the use of PPPs instead of alternative orga-nizational forms. Table 1 gives the main financial characteristics of our treated and control groups. The reported values are the means over the period 2003 -2012. As the treated group is composed of 101 municipalities having concluded PPPs, the level of investment made under PPPs is on average 32.3 million euro. This value is logically 0 for the control group, i.e., the group without PPPs. In
general, we observe a better financial situation for the control group. Indeed, this group has a higher positive level of results in both the operation section of the budget, i.e., operation ≠ result (5.5 million euro versus 4.8 million euro) and the overall budget result, i.e., overall ≠ result (5.9 million euro versus 4.7 million euro). At the same time, the control group has lower subsidies from the central government helping the operation section (21.6 million euro versus 24.4 million euro). Moreover, while the control group annually invests more (29.9 million euro versus 26.2 million euro), they have lower debt levels, both in terms of stock of debt (45.2 million euro versus 63.6 million euro) and in terms of annual debt payment (5.6 million euro versus 9.3 million euro). These figures therefore show that the control group has a better self-financing capacity than the treatment group. The level of annual investment of these two groups also shows that municipalities in the control group have their own investment strategies but did not choose PPPs as their organizational form.
4.2 Description of variables
As we use a panel database covering the period 2003 to 2013, all variables are defined for each municipality i and each year t. The variables’ descriptions with the expected signs are reported in Table 4.
4.2.1 Time variables
As previously discussed, we are interested in explaining the use of PPPs by French municipalities. We introduce our dependent variable which represents municipalities that made PPP as an organizational choice. If municipality i in year t has implemented a PPP, then pppit equals to one in t and until the end of
the period, i.e., 2013; and equals zero for the entire period before year t15.
4.2.2 Explanatory variables
As there is no universally accepted measure of financially constrained firms (Linck et al. [2013]), even less for the public sector and municipality financial situation, we consider three measures for our explanatory variables. To avoid endogeneity issues, these variables are lagged by one year. We follow Bahl and Duncombe [1993] in using both stock and flow measures for debt burden. The stock variable, debtit≠1, captures the municipality’s ex ante exogenous situation.
We then use two flow variables to measure how a municipality’s conditions change during the period preceding the investment start: annual ≠ paymentit≠1 captures
annual debt expenses (interest and capital reimbursement), and self ≠financeit≠1
captures a municipality’s self-financing capacity (the surplus from the operating budget that can be used to finance new investment).16
15. This type of variable is the instrument used to perform the duration analysis presented in the Section 4.3
16. The notation of financial agencies such as Moody’s would be a good measure for a mu-nicipality’s financial situation. However, this notation is currently not available for all French
Debt hiding reasons for engaging in PPPs in France were ruled out in 2011. We account for this legal discontinuity by introducing the variable rulet, which
equals one for periods of time preceding January 1st 2011 and is zero otherwise.17.
We are interested in the interaction term among ruletand each financial restraint
proxy. These interaction terms show the extent to which the effect of each proxy changes after 2011.
Finally, we include the post2011 statistic, which is the sum of the effects of each financial proxy and its interaction term with the rule dummy. This coefficient captures the effect of each proxy on the use of PPPs after 2011.
4.2.3 Control variables
Given that we have a panel database and are comparing similar municipalities in terms of population features, we first select those financial covariates that vary over time and could influence both the dependent variable and financial restraint proxies. We consider financial variables that reflect municipalities’ capacity to deal with both the investment’s demand and the balanced budget requirements. The first variable controls for the balancing of the operating and the investment budgets as required by the balanced budget specifications. We use budget ≠ resultit≠1, which is the difference between the operation ≠ resultit≠1 and the
investment spending of municipality i at t ≠ 1. Finally, we consider two other variables that control for both the size of the investment and the level of the ex ante available resources: investmentit≠1, which captures the total level of
investment by municipality i at t ≠ 1, and subsidiesit≠1 which reflects the level of
national support the municipality received for its investment plans at t ≠ 1.18
We then include three political dimensions that may affect the selection of PPP at the municipal level: leftit≠1, centerit≠1, or rightit≠1, which equal one if
the mayor of municipality i is from the left (center or right) wing party at t ≠ 1 and is zero otherwise. This measure is widely used in the PPP literature (see
Klien and Tran [2014] for a review). The variable femaleit≠1 represents the sex
of the mayor and equals one if the mayor of municipality i is female at t≠1 and is zero otherwise. This measure is also widely used in the management literature to examine organizational choices (see Klien and Tran [2014] for a review). We also include the institutional proxy EQI (European Quality of Government Index) at the regional level (Charron et al. [2014]). This index is the combination of the level of corruption, protection of the rule of law, government effectiveness, and accountability at regional levels in the 27 EU Member States. The measures are collected in 172 EU regions, based on a survey of 34,000 residents across 18 countries (Charron et al. [2014]). It controls for the municipality’s institutional aspect.
municipalities.
17. In our regressions, we use the interaction between the dummy ruletand a trend variable
to capture the change in trend on the probability to implement PPP after the application of the Decree.
18. To prevent collinearity problems, we perform our regressions with each control variable as a robustness check.
Finally, we add three main variables used for the matching strategy as control variables to verify its efficiency: populationit≠1 (the log of the population of each
municipality), incomeit≠1 (the log of the income of each municipality), firmit≠1
(the log of number of firms in each municipality).
4.3 Empirical Strategy
We aim to explore the determinants of a municipality’s decision to use PPP or wait both before and after 2011, as that year marks the introduction of a new accounting rule into the legal system.
As some municipalities decide to invest after the creation of a PPP market, different investment times are available over the period 2005-2013. The starting year is the same for every municipality (2005), but data are incomplete. Mu-nicipalities that did not invest within the period are necessarily right censoring. Duration or hazard models are designed to take this issue into account (Hosmer et al. [1999], Machin et al. [2006], and Chen[2002]).
In duration or survival analyses time is the outcome variable of interest. More precisely, the dependent variable is defined as survival time because it provides the interval until a certain event (failure) occurs. The terminology suggests the main application areas are health and financial economics. However, this approach can be applied to any type of event that affects individuals in different moments. Our research question is a suitable application of the duration analysis because increasing numbers of municipalities used PPPs during the period 2005 - 2013 and we can expect that, in the long run, this technique would become even more widespread among public operators.
In our case, investment action under a PPP represents the event (failure), while the survival time is given by the number of years until an investment under a PPP takes place. In such an analysis, we use the entire database comprising both our treatment and control groups. Thus, the time is right censoring for all municipalities that do not experience the event prior to 2013.
The introductory step of the survival analysis consists of computing the Kaplan-Meier survival curve, S(t), and the Hazard rate function, h(t). The first is com-puted year by year and reports the proportion of municipalities that survive (do not use PPP) over time. The second gives the instantaneous potential per unit time for the event to occur given the survival up to time t.
The next step allows us to assess the relationship between explanatory vari-ables and survival time. More precisely, it allows us to identify the factors that determine the probability of implementing a PPP and how the new rule affected this propensity to use PPP. We approach the problem through two methods that aim at computing the hazard rate, that is, the instantaneous event rate.
The first one is a semi-parametric method, the Cox proportional hazard model. This model makes a major assumption that the hazard rate (instantaneous event rate) is proportional to the covariates (PH assumption). This means that the risk of failure (PPP use) is the same no matter how long the municipality has been followed (Hosmer et al.[1999]). This assumption is plausible for our analysis
where the probability to invest in PPP should not depend on how much time has elapsed since 2004, the starting year of our study. However, we perform a statistical test (stphtest) to assess the PH assumption: we first implement a PH global test that controls for all covariates simultaneously; then, we graphically test the PH assumption for the budget constraint regressors. The main regression for the Cox-Ph model is as follows:
h(t, x, —) = h0(t)f(x, —) (1)
where h0(t) is proportional to the survivor time, while f(x, —) characterizes
how the hazard function changes as a function of our covariates.
The strategy’s second method consists of implementing a full parametric model where survival time is assumed to follow a known distribution.
We assume the most common Weibull distribution, which is a general distribu-tion based on two parameters that can be reduced to an exponential distribudistribu-tion if the hazard is assumed to be constant over time. The hazard rate function that we are going to estimate through this method is given in the following expression:
h(t, x, —, ⁄) = ⁄t
⁄≠1
(e—0+—1x)⁄ (2)
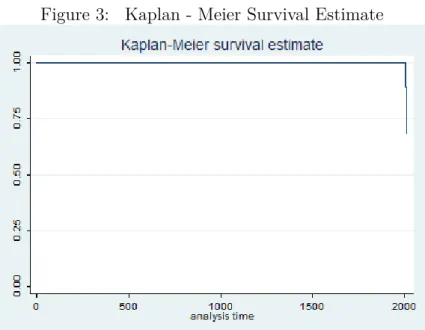
We then run a parametric model for each financial restraint proxy. A graph-ical method for checking the validity of the Weibull distribution is provided by examining the Kaplan-Meier log curves against log survival time. The graph in Figure 3 reports a straight line, thus providing evidence that the distribution of survival times follows a Weibull distribution.
5 Results and Robustness checks
5.1 Results
We first report the results of the computation of the Kaplan-Meier survival curve, S(t), and the Hazard rate function, h(t), in Figure4. The first graph looks like a step function given the discrete time. Prior to 2005, the survival probability equals to 1; after this year, some municipalities started to invest. At the end of the time period, the probability of investment is approximately 30%. This result reflects the composition of our dataset, which comprises 101 municipalities with PPP and 202 control municipalities that did not implement any PPP. The Hazard rate function highlights the increasing conditional likelihood to invest under PPP up to year 2011. Subsequently, after the application of the new accounting rule, the line shows a downward trend.
Before presenting the main results of the semi-parametric method under the Cox proportional hazard model, the global test lets us argue that the PH assump-tion is not violated in the implemented models. We further control for whether or not the budget constraint proxies separately respect the PH assumption. Figures
5, 6, 7 reports the fitted curves. They appear horizontal, which means that the scaled Schoenfeld residuals are independent with respect to survival time.
Our main results of the Cox proportional hazard model are reported in Table
5. We report both coefficients and hazard ratios in order to obtain a complete interpretation of our results.
The first set of variables reports the political features of the municipality. The EQI index (institutional aspect) is positive but not significant. The coefficient of the dummy female is also positive but also not significant. Finally, among dummies that reflect the political aspects of municipality governments, only the dummy right is significant; thus, when the mayor is from the right side of the political spectrum, the propensity to implement a PPP increases. This result is in line with previous studies on PPP determinants.
Among variables that control for the financial side, budget ≠ resultit≠1 has
a positive impact, while effects of investmentit≠1 and subsidiesit≠1 are negative.
Nevertheless, none of the covariates significantly affect the propensity to invest in a PPP. In contrast, financial restraints proxies have a significant impact on the propensity to implement PPPs. First, we observe a positive and significant effects for debtit≠1 and annual ≠ paymentit≠1 on the use of PPPs, and these persist after
2011.19 Debt positively impacts the hazard ratio by 18% before 2011 and 14%
after 2011, while the effect of the annual payment is 31% before the application of the rule and 26% after the new legislation. While the rule was found to have a negative effect, this effect alone was never significant. As a consequence, we can conclude that municipalities have not used PPPs to minimize debts, at either the stock or flow level. Second, for the proxy self ≠ financeit≠1 (which captures
the municipality’s self-financing capacity), the rule’s effect becomes significantly positive (a 6.7% increase in the probability that PPPs will be used). This change may be explained by a shift in French municipalities’ behavior. Before 2011, for a given level of debt, the availability of resources for further investment did not affect the propensity to implement a PPP. After the introduction of the rule, a municipality showed a higher tendency to use PPPs only when its budget is balanced, a trait which in itself represents a high self-financing capacity.
Results of the full parametric model where survival time is assumed to follow a known distribution are substantially equal to the ones of the Cox proportional Hazard model (Table 6). Indeed, we still found that the levels of debt and annual payments increase the probability of PPP use. These effects remain positive and significant after 2011, while the interaction term is not significant. We also found a similar result regarding municipalities’ self-financing capacity. The interaction term rule ≠ self ≠ finance affects positively the use of PPPs. This highlights how the presence of internal resources became a significant argument in favor of PPP investment, essentially after 2011.
5.2 Robustness checks
We performed various robustness checks to assess the sensitivity of our results. These are discussed below and results are reported at the end of the paper.
Matching strategy and Time periods issues We have already show how
the treated and control groups are similar not only with respect to the matching variables, but also by controlling for population characteristics related to the 2000 - 2009 time period. We include, as an additional test, all matching variables in our duration regressions. Our results are not substantially affected.
A further source of uncertainty remains in the interpretation of the interac-tion term between the accounting rule and financial restraint proxy. In fact, the policy’s impact can be anticipated or identified with hindsight by public actors. We therefore place the rule at different years only found non-significant impacts. Furthermore, external factors could exist that influence the trend of the budget constraint proxy but which are also correlated with the PPP dependent variables. An example would be a financial crisis that could make a PPP investment more costly for the public buyer, especially when the latter is constrained in terms of total available resources (Marty and Tran[2014]). This effect could overemphasize the rule’s potential impact; therefore we would be potentially overestimating the extent of debt hiding motivations and underestimating the relevance of alternative channels.
However, to control for the validity of our strategy, we further apply our du-ration analyses to the entire population of 36,000 French municipalities using our matching variables as controls. Results of the level of debt and annual payment for debt are not substantially affected, while the effect of the self-financing capacity of municipalities became non-significant after 2011 (Table 7).
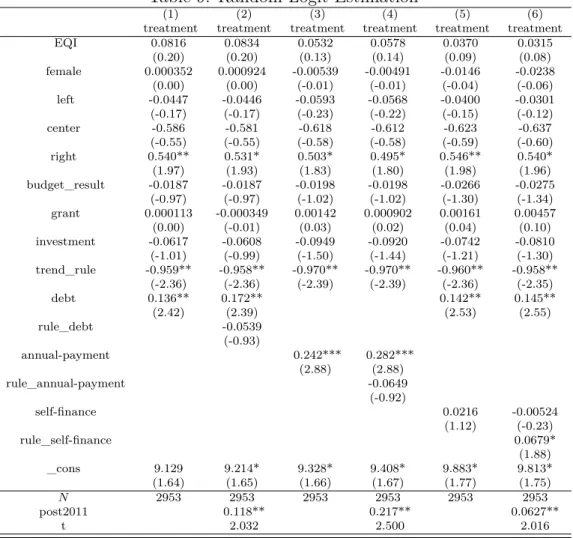
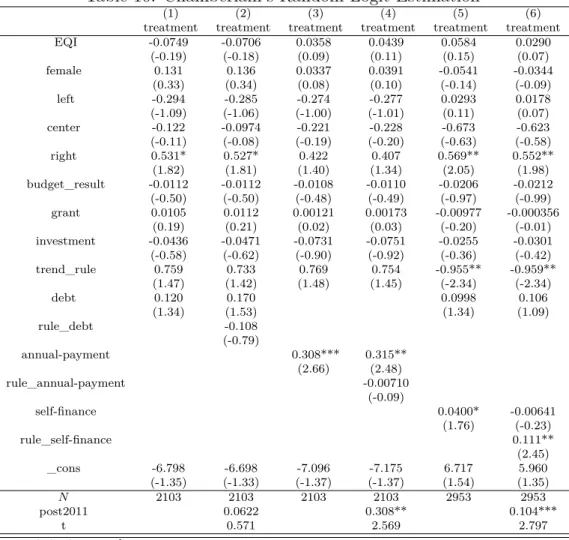
Panel strategy We propose an alternative empirical strategy in order to check
whether or not our results depend on the adopted specification. We choose to implement a panel strategy with a nonlinear model, where the dependent variable is a dummy that equals 1 if municipality i invests under a PPP during year t. Applying a fixed-effect estimation with a nonlinear model can be problematic. In fact, first differencing or use within a transformation does not permit elimination of unobserved heterogeneity. Moreover, attempts to add municipality or time dummy variables to the logit or probit estimations will result in biased estimators due to the incidental parameters problem unless the time period is very large. A possible solution to this problem may come from using the traditional Ran-dom Effect Probit. This strategy is appealing, but assumes that the unobserved components are strictly exogenous and thus independent from our covariates. An alternative approach would be the Mundlack estimation, which assumes an ex-plicit function for the latent variable. This method allows correlation between random effects and regressors and thus permits the marginal effects to be calcu-lated. It can be applied to our full sample and consists of computing a random effect logit or probit estimation including the average value over time for each
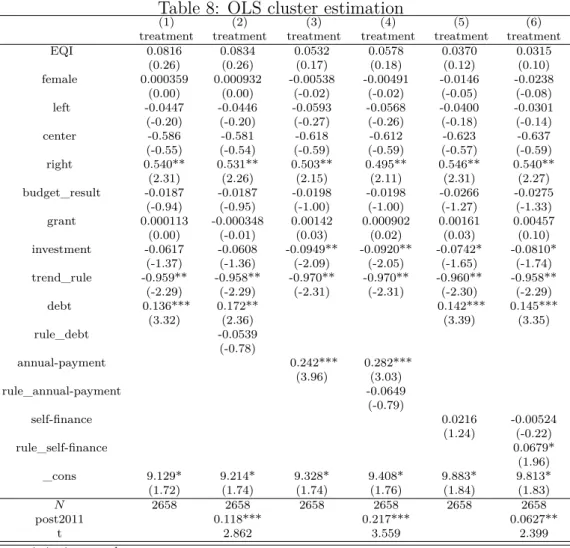
of our regressor municipalities. In this paper, we first estimate a simple OLS regression with clustered standard errors (by municipality). Results are reported in Table 8 in the Appendix. Subsequently, we implement the Random logit and the Mundlack Random logit approaches. Results are reported in Tables 9 and
10.20. Results in Tables 8 and 9 do not substantially change with respect to the
duration analysis. As in the previous regressions, budget constraint effects are relevant both before and after the rule’s application. The new accounting law affects the impact of the self-financing proxy as well as the relevance of new debt taken out at time t ≠ 1. When the Mundlack approach is followed (Table 10), although results for the level of annual payment and self-financing capacity stay the same, those for debt level become non-significant for the two periods. Debt level has therefore no impact on the use of PPPs.
Endogeneity problems Finally, we try to eliminate the debt endogeneity
prob-lem by substituting our financial constraints with their values in 2004 (before the period of interest). Results are reported in Table11(duration models). Results are not substantially affected apart from the impact of municipalities’ self-financing capacity, which is negative both before and after 2011.
6 Discussion
In this paper, we found different results demonstrating the impact of financial restraint on the use of PPPs. We also find evidence regarding the persistence of this impact even when off balance sheet accounting was no longer possible. As a consequence, the debt hiding motivation can be considered not relevant when French mayors make a decision whether or not to use a PPP as an organizational form for public investments.
However, we find that the Decree shows its efficiency in several ways. First, as shown by the Hazard rate function, the conditional probability of a municipality choosing a PPP increased up through 2011. Subsequently, after the application of the new accounting rule, the line shows a downward trend. Klien and Tran
[2014] found a similar trend after 2011 for PPP projects under the preliminary assessment phase. We can therefore consider that mayors pay more attention to the use of PPPs when there is no debt hiding possibility. Second, our results also show that the rule partially changed the relevance of financial restraint in explaining the propensity to choose PPPs as an organizational choice. Indeed, the impact of each municipality’s self-financing capacity shows a change in the reasons behind that municipality’s investment choice. Before the rule’s application in 2011, the presence of internal resources was not a determinant of PPP investment. Afterwards, a strict relation between an investment and balanced accounts was created, making a municipality’s investment decision become directly affected by the balanced budget requirements. We can then conclude that even if a PPP’s accounting advantage is not the only driver of this organizational choice, the 2011
Decree helped improving municipalities’ attentiveness regarding their financial situation before they made an investment decision.
Our main results show that municipalities facing a situation of financial re-straint choose PPPs for other reasons than the accounting advantage that nor-mally characterizes this organizational type. Some explanations for our results can be discussed. The first argument focuses on the financial dimension. Gov-ernments can face temporary liquidity constraints. In such a case, the upfront spending required by traditional procurement can become more expensive than the future transfers required by PPPs because the distortionary cost of taxation is higher now than in the future (Engel et al. [2013]). This benefit holds unless the planner can decide to optimally postpone the project (Engel et al. [2013]) or tra-ditional procurement repayment systems can be delayed by mimicking the timing allowed under PPPs.21 Second, from an efficiency point of view, the introduction
of asymmetric information can tilt the choice towards the PPP model over the traditional procurement by giving relevance to the shadow cost of public funds. In fact, through PPPs, governments can entrust the project to better-informed agents (the private operator) and a better controller (the lending bank) (Auriol and Picard [2013]). Under such an organizational choice, governments can also save incentive rents thanks to the private agent’s long-term involvement (Buso and Greco [2014]). Third, as demand factors and institutional constraints are the main drivers of the debt levels rather than governments’ capacity to finance (Bahl and Duncombe[1993]), public actors might pay less attention to their debt burden levels. Moreover, even if we control for some political dimensions, other political channels may exist that can explain our results. For example, Maskin and Tirole [2008] find that under a context with high lobbying, it is easier for a government that uses PPPs to favor some operators. Finally, we can also argue that even after introduction of the 2011 rule, debt hiding motivations could per-sist. This explanation should not be particularly relevant given the effectiveness of the French Decree in ruling out accounting advantages (see Section 2 which discusses the French institutional context).
7 Conclusions
In this paper, we first study whether or not a public authority burdened by a hard budget constraint is more likely to choose PPPs. Second, we examine the nature of this effect, i.e., is it made only out of a debt-hiding motivation? We find that a budget constraint is associated with higher use of PPPs. However, while the new accounting rule enacted in 2011 might have significantly changed the temptation for municipalities to hide debt and consequentially decrease the impact of financial pressure when employing a PPP investment, the budget constraint effect continues to be positive and significant for some financial constraint proxies. We therefore conclude that debt hiding is not the only motivation when financially 21. It is also important to highlight how high levels of public debt do not directly imply government liquidity constraints.
stressed municipalities choose PPPs as an organizational form.
Our empirical results contribute to the literature in several ways. First, we corroborate the traditional view in Public Administration literature. Indeed, as we do not find evidence for creative accounting adoption when financially constrained French mayors make their organizational choices, our results support the idea that public managers’ motivations are to serve the public interest, instigate social change, and shape policies that affect society (e.g., Frederickson and Hart[1985],
Perry and Porter [1982], Perry and Wise [1990]). Second, we contribute to the PFM literature as we found that a large debt burden level is not necessarily connected with a strategy of offloading debt. This is an interesting result in the context of a financial crisis, where governments around the world are forced to cut budgets, restructure service delivery strategies, reset priorities, and assume enormous new financial responsibilities (Kioko et al. [2011]). Third, we point out how PFM’s concerns can contribute to PAM core questions such as decision making, performance management, and organizational strategy. Finally and more narrowly, we contribute to the existing literature on PPPs. Our results do not only detect the effect of budget constraints on the use of PPPs, but also look at the possible motivations that induce constrained public authorities to choose this organizational form. This paper is, to the best of our knowledge, the first direct empirical analysis of this topic.
From a practical point of view, our paper has also several managerial impli-cations. First, our results provide more insight to regulation instances such as the MaPPP. Indeed, the non-relevance of debt hiding motivations is an argument to continue developing the PPP organizational form. Moreover, the impact of the 2011 French Decree on more balanced consideration made by public actors before choosing a PPP may help these instances in improving PPPs’ institutional framework in the future. Second, our results might also make public actors who are tempted to use PPPs for financial motivations to reconsider this organiza-tional choice. Third, our study may help private actors and private lenders in their deliberations regarding the possibility of collaborating with the public sec-tor. Indeed, knowing that public managers are not choosing PPPs for debt hiding motivations may encourage the private sector to financially participate in such a strategy. Finally, our results have “solved” the myth about PPPs’ motivation among practitioners. Our results can also partially explain why countries have increasingly turned to PPPs in recent years despite all these criticisms. In fact, a 2009 OECD report stated that PPPs have grown to comprise a portion, although not the majority, of capital budgets in several countries.22. This evolution
ex-perienced a temporary decline during the current economic crisis (EPEC[2012]), however, the long-term trend is expected to become positive (Wagenvoort et al.
[2010]). Our research addresses a very relevant problem in the current situation 22. The United Kingdom has had the longest experience, with PPPs currently comprising 10% to 15% of the capital budget in recent years. France and Korea have had similar experience, with PPPs comprising 20% and 15% of those countries’ capital budgets, respectively. Portugal reported the highest payments for PPPs, representing nearly 28% of the national budget or 9.4% of GDP; projects could eventually comprise up to nearly 20% of GDP (Posner et al.[2009])
where resources are scarce and much creativity is needed to incentivize economic growth.
References
Adams, R., Hermalin, B. E., and Weisbach, M. S. (2008). The role of boards of di-rectors in corporate governance: A conceptual framework and survey. Technical report, National Bureau of Economic Research.
Albalate, D., Bel, G., and Geddes, R. R. (2012). The determinants of contractual choice for private involvement in infrastructure projects in the United States. Technical report, University of Barcelona, Research Institute of Applied Eco-nomics.
Auriol, E. and Picard, P. M. (2013). A theory of bot concession contracts. Journal of Economic Behavior & Organization, 89(1):187–209.
Bahl, R. and Duncombe, W. (1993). State and local debt burdens in the 1980s: A study in contrast. Public Administration Review, pages 31–40.
Bergstresser, D. and Philippon, T. (2006). Ceo incentives and earnings manage-ment. Journal of Financial Economics, 80(3):511–529.
Briffault, R. and Fund, T. C. (1996). Balancing acts: the reality behind state balanced budget requirements. Twentieth Century Fund Press New York. Burns, N. and Kedia, S. (2006). The impact of performance-based compensation
on misreporting. Journal of financial economics, 79(1):35–67.
Buso, M. and Greco (2014). Public and private finance of PPPs. Mimeo.
Buti, M., Martins, J. N., and Turrini, A. (2007). From deficits to debt and back: political incentives under numerical fiscal rules. CESifo Economic Studies, 53(1):115–152.
Carpentier, J., Lebrun, F., and Le Goff, J. (1987). Histoire de France. Seuil. CES (2012). L’investissement public : malgré les difficultés, une priorité. Rapport
du Conseiléconomique, social et environnemental.
Chaney, B. A., Copley, P. A., and Stone, M. S. (2003). The effect of fiscal stress and balanced budget requirements on the funding and measurement of state pension obligations. Journal of Accounting and Public Policy, 21(4):287–313. Charron, N., Dijkstra, L., and Lapuente, V. (2014). Regional governance matters:
quality of government within european union member states. Regional Studies, 48(1):68–90.
Chen, M.-Y. (2002). Survival duration of plants: Evidence from the us petroleum refining industry. International Journal of Industrial Organization, 20(4):517– 555.
Cornett, M. M., Marcus, A. J., and Tehranian, H. (2008). Corporate governance and pay for performance: The impact of earnings management. Journal of Financial Economics, 87(2):357–373.
Dechow, P. M., Ge, W., Larson, C. R., and Sloan, R. G. (2011). Predicting mate-rial accounting misstatements. Contemporary accounting research, 28(1):17–82. Dechow, P. M., Sloan, R. G., and Sweeney, A. P. (1996). Causes and consequences of earnings manipulation: An analysis of firms subject to enforcement actions by the SEC. Contemporary accounting research, 13(1):1–36.
DeFond, M. L. and Park, C. W. (1997). Smoothing income in anticipation of future earnings. Journal of accounting and economics, 23(2):115–139.
Dupas, N., Gaubert, A., Marty, F., Voisin, A., et al. (2012). Les nouvelles règles de comptabilisation des partenariats public-privé. Revue Lamy des Collectivités territoriales, 75(janvier 2012):69–74.
Easterly, W. (1999). When is fiscal adjustment an illusion? Economic Policy, 14(28):55–86.
Efendi, J., Srivastava, A., and Swanson, E. P. (2007). Why do corporate man-agers misstate financial statements? the role of option compensation and other factors. Journal of Financial Economics, 85(3):667–708.
Engel, E., Fischer, R., and Galetovic, A. (2013). The basic public finance of public–private partnerships. Journal of the European Economic Association, 11(1):83–111.
EPEC (2012). France: PPP units and related institutional framework. PPP Expertise Centre Report.
Frederickson, H. G. and Hart, D. K. (1985). The public service and the patriotism of benevolence. Public Administration Review, pages 547–553.
Fudenberg, D. and Tirole, J. (1995). A theory of income and dividend smoothing based on incumbency rents. Journal of Political Economy, pages 75–93.
Hammami, M., Ruhashyankiko, J.-F., and Yehoue, E. B. (2006). Determinants of public-private partnerships in infrastructure. International Monetary Fund. Hart, O. (2003a). Incomplete contracts and public ownership: Remarks,
and an application to public-private partnerships*. The Economic Journal, 113(486):C69–C76.
Hart, O. (2003b). Incomplete contracts and public ownership: Remarks, and an application to Public Private Partnerships. Economic Journal, 113(485):C69– C76.