HAL Id: hal-01336836
https://hal.archives-ouvertes.fr/hal-01336836
Submitted on 23 Jun 2016
HAL is a multi-disciplinary open access
archive for the deposit and dissemination of
sci-entific research documents, whether they are
pub-lished or not. The documents may come from
teaching and research institutions in France or
L’archive ouverte pluridisciplinaire HAL, est
destinée au dépôt et à la diffusion de documents
scientifiques de niveau recherche, publiés ou non,
émanant des établissements d’enseignement et de
recherche français ou étrangers, des laboratoires
Statically and Dynamically Verifiable SLA Metrics
Elena Giachino, Stijn de Gouw, Cosimo Laneve, Behrooz Nobakht
To cite this version:
Elena Giachino, Stijn de Gouw, Cosimo Laneve, Behrooz Nobakht. Statically and Dynamically
Ver-ifiable SLA Metrics. Theory and Practice of Formal Methods - Essays Dedicated to Frank de Boer
on the Occasion of His 60th Birthday, 9660, Springer, pp.211-225, 2016, Lecture Notes in Computer
Science, 978-3-319-30733-6. �10.1007/978-3-319-30734-3_15�. �hal-01336836�
Statically and Dynamically verifiable SLA metrics
?Elena Giachino1, Stijn de Gouw2, Cosimo Laneve1, and Behrooz Nobakht2
1
Dep. of Computer Science and Engineering, University of Bologna – INRIA Focus {elena.giachino,cosimo.laneve}@unibo.it
2 SDL Fredhopper
{bnobakht,sgouw}@sdl.com
Abstract. There is a gap between run-time service behaviours and the contracted quality expectations with the customers that is due to the informal nature of service level agreements. We explain how to bridge the gap by formalizing service level agreements with metric functions. We therefore discuss an end-to-end analysis flow that can either statically verify if a service code complies with a metric function or use run-time monitoring systems to report possible misbehaviours. In both cases, our approach provides a feedback loop to fix and improve the metrics and eventually the resource configurations of the service itself.
1
Introduction
In Cloud Services and in Web Services, in general, resource provisioning is de-fined by means of legal contracts agreed upon by service providers and cus-tomers, called service level agreements – SLA. Legal contracts usually include measurement methods and scales that are used to set the boundaries and mar-gins of errors that apply to the behaviour of the service, as well as the legal requirements under different jurisdictions. The SLA documents have no stan-dardized format nor terminology, and do not abide by any precise definition, notwithstanding some recent attempts towards standardization – see [2] and the references therein.
Because of this informal nature, there is a significant gap between SLAs and the corresponding services whose quality levels they constrain. As a conse-quence, SLAs are currently not integrated in the software artefacts, and assessing whether a service complies with an SLA or not is always a point of concern. As a consequence, providers, in order to avoid legal disputes, very often over-provide resources to services with the result of wasting resources and making services more expensive.
This paper presents the approach taken in the EU Project Envisage [2] where the gap between (parts of) SLAs and services is bridged by (i ) using simple formal descriptions of SLAs in terms of metric functions and by (ii ) defining
?
This paper is funded by the EU project FP7-610582 ENVISAGE: Engineering Vir-tualized Services, http://www.envisage-project.eu.
a mathematical framework that is able either to derive the SLA quality levels from the service programs and to verify possible violations or to monitor service behaviours and document SLA quality levels mismatches.
Among the properties whose qualities are constrained by SLA documents [11], we focus in Section 2 on performance by analyzing the objectives that set the boundaries and margins of errors of service’s behaviours. In Section 3, these ob-jectives are formalized in terms of metric functions. Having at hand these func-tions, we address the problem to verify whether a given service complies with them or not. Two techniques are discussed in this paper for verifying perfor-mance properties of services: the static-time techniques and the run-time ones. In static-time techniques, the compliance of a service with respect to a metric function is shown by means of analysis tools that either directly verify the code (static analysis), or an underlying mathematical model (model checking, simula-tion, etc.). Whenever the service does not comply with the metric funcsimula-tion, the designer triggers a sequence of code refinements that lead to compliance. As an example, consider resource capacity that measures how much a critical resource is used by a service. Section 4 reports a static analysis technique that uses so-called behavioural types. These behavioural types are abstract descriptions of programs that support compositional reasoning and that retain the necessary information to derive resource usage. By means of behavioral types, we use ei-ther a cost equation evaluator – the solver systems [7,1] – or a theorem prover – the KeY system [3] – to prove compliance with the SLA. For instance, we demonstrate that the response time of a given method does not exceed a certain user-defined threshold.
In run-time techniques, the enforcement of properties is accomplished by using code that is external to the service and that continuously monitors it. In facts, there are (performance) metric functions that cannot be (even in principle) fully verified statically, due to factors under external control, such as the requests per minute by end users and failing machines in the underlying infrastructure. As an example, consider the percentage of successful requests, namely the number of requests processed by the service without a failure due to its infrastructure over the total number of received requests. In Section 5, we report a technique that uses an external monitoring system filtering service’s replies, counts them, and records the erroneous ones. The correctness of the composite system consisting of the service and monitoring code is established by means of either static analysis techniques or model checking.
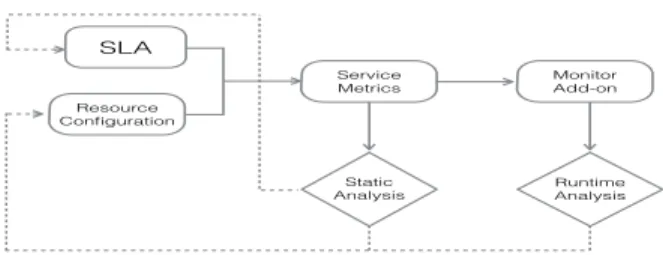
Figure 1 describes the flow of analysis techniques used in our approach. A feedback loop ensures corrections and improvements to the system. In particular, if the static analysis reports that a service does not match an SLA constraint, then, during the negotiation phase that constraint can be either relaxed or the resource configuration can be extended accordingly (with a possible charge for the client). Similarly, if a monitoring system verifies a run-time violation of an SLA constraint then, in order to avoid expensive penalties, the service providers trigger the resource configuration system to increase service’s resources.
SLA
Resource Configuration
Service
Metrics Monitor Add-on
Static Analysis
Runtime Analysis
Fig. 1: Analysis Flow: Resource Configuration refers to the configuration of resource types that are used for the service; Service Metrics denotes the set of metrics that define the quality of the service. The dashed lines present a feedback loop to a previous phase of analysis.
In Section 6 we discuss the issue of SLA metrics that have conflicting re-quirements. In this case, it is necessary to determine an upper bound in time for reaching a stable resource configuration. We also discuss complex metrics that actually are compositions of basic metrics discussed in Section 3. We report our analysis of related works and conclude in Section 7.
2
SLAs and performance properties
In the “Cloud Service Level Agreement Standardisation Guidelines” document [11], the qualities of services are assessed with SLAs according to the properties they have, which range from performance to security and to data management. In this paper, we will focus on performance. We discuss how it can be formalized and evaluated on source code of services.
The article [11] distinguishes three kinds of performance properties: availabil-ity, response time, and capacity. Availability is the property of a service to be accessible and usable on demand. By detailing the notion of “usability”, one gets different instances of availability and corresponding service metrics. For instance (i ) level of uptime, is the time in a defined period the service is up, over the to-tal possible available time; (ii ) percentage of successful requests, is the number of requests processed without an error over the total number of submitted re-quests; (iii ) percentage of timely service provisioning requests, is the number of service provisioning requests completed within a defined time period over the total number of service provisioning requests. Response time is the time period between a client request event and a service response event. The service metrics that are used to constrain response time may return either an average time or a maximum time, given a particular form of request. Capacity is the maximum amount of some resource used by a service. It also includes the service through-put metric, namely the minimum number of requests that can be processed by a service in a stated time period.
The example below discusses an industrial e-commerce use case and its cor-responding SLA constraints about performance. The next section formalises the involved metrics and we show how to verify/enforce them in the rest of the paper.
Example 1. A Cloud Service company offers search and targeting facilities on large product databases over cloud computing architectures to e-commerce com-panies. The offered services are exposed at endpoints and are typically imple-mented to accept connections over HTTP. For example, a query API allows users to query over a product catalog. Assume that the query API is implemented by means of a number of resources (virtual machines) that are managed in a mutual exclusive way by a load balancer (each resource is launched to serve exactly one instance of the query API). When an e-commerce company signs the SLA con-tract with the Cloud Service company, the performance properties of the query API are constrained by the following metrics:
– 95% of requests is completed within 1 minute, 2% within 3 minutes and 1% within 5 minutes. This is the “percentage of timely service provisioning requests” metric and it is used by the operations team of the Cloud Ser-vice company to set up an environment for the customer that includes the necessary resources to match the constraints. It is additionally used by the support team of the Cloud Service company to manage communications with the customer during the lifetime of the service for the customer.
– the service completes 8 queries per minute from 9:00 to 18:00 and 4 queries per minute otherwise. This is a service throughput metric and forms the basis of many decisions (technical or legal) thereafter, such as the definition of the necessary resources for the e-commerce company.
– the service replies to a query request (with the result or with a failure) within 7 minutes. This is a response time metric and may be determined by the size of database as well as by the size of the data managed by the query service (whenever the service accepts queries that are unbounded).
3
Metrics’ formalization
To determine the precise level of a metric, and verify whether the service matches the agreed levels, an indisputable formalisation is needed, rather than the infor-mal descriptions in the previous section. There have been several attempts to formalize SLAs, using techniques ranging from semantic annotations [17], to rewriting logics [19] and to constraint programming [5]. In this paper, follow-ing [18], we use a very simple formalization based on service metric functions.
Service metric functions aggregate a set of basic measurements into a single number that indicates the quality of a certain service characteristic. For instance µ(τ ) and ν(τ, δ) are two functions that respectively take one and two inputs, where
– τ is an interval of the form [d.t, d0.t0], where d, d0are days (d, d0 ∈ {1, · · · , 366}) and t, t0 are seconds in the day (t, t0 ∈ {0, · · · , 86399});
– δ can be an upper bound to the size in bytes of client’s requests, a time bound for getting a reply, or an upper bound to the number of resources used by the service.
To illustrate how performance metrics that are informally defined in SLA documents can be formalized, we further elaborate Example 1. In particular,
– the percentage of timely service provisioning requests of a service s can be formalized by the following function PTSs:
PTSs([1.0, 366.86399], x) = 0, 95 if x = 60s 0, 97 if x = 180s 0, 98 if x = 300s
– the service throughput of a service s can be formalized by the function STs
as follows: STs([1.t, 366.t0], 60) = 4 if t = 0 and t0= 32399 8 if t = 32400 and t0= 64800 4 if t = 64801 and t0= 86399
– the response time of a service s can be defined by the following function RTs:
RTs([1.0, 366.86399]) = 420s
4
Static-time analysis
Several static-time analysis techniques are possible to verify service properties and, in particular, service metrics like response time. In this section we discuss two approaches we use in the Envisage Project and we apply them to the response time metric of Example 1. We refer to [8,10] for further details on the technique described in Section 4.1. We refer to [3,6] for details on the technique discussed in Section 4.3.
4.1 Behavioural types
Behavioural types are abstract descriptions of programs that highlight the rele-vant informations to derive a particular property. This derivation usually consists of three steps:
1. an inference system parses the service program and returns a behavioural type;
2. the behavioural types are translated into low-level descriptions that are ad-equate for a solver;
3. the low-level descriptions are fed to a solver which produces the output. It turns out that behavioural types support compositional reasoning and are therefore adequate for SLA compliance, while low-level descriptions are not com-positional (and too intensional).
In the case of response time analysis, the behavioural types carry informa-tions about costs of operainforma-tions that are extracted directly from the source pro-gram. This means that the source program retains either resource-consumption
String searchDB(String s) { String u, v ; u = DB.query(s) ; job(h) ; v = this.add_info(u) ; return v; } class DataBase { String query(String s) { String z = this.elaborate(s); String value = this.search(z); job(k) ;
return value; } ... }
Fig. 2: The servicesearchDBperforming a query on a database.
annotations or resource-aware commands. The following code snippets use ex-plicit primitives for expressing the consumption of resources; in particular, the statementjob(e)specifies a requirement ofeCPU resources and is instrumental for modeling the time: depending on the available resources its execution might take an observable amount of time proportional to its cost. For instance, the execution of job(6) when only 3 CPU resources are available will be executed
within 6/3=2 units of time.
We illustrate our technique with two examples derived from Example 1. We assume a simple setting where every instance runs in the same machine with a fixed capacity of cCPU resources.
Consider the service that performs a query on a database, in Figure 2. The method searchDB sends a given query to the database and, when the result of the query is returned, it enhances the result with some information before re-turning it to the client. Thejob(h)statement specifies that the local operations ofsearchDB requireh CPU resources. Thequery method, which is implemented in a different class DataBase, receives a query, evaluates it, searches the corre-sponding item in the database, and returns the result. The overall cost for these operations iskCPU resources, as specified byjob(k). In this example we assume the methodselaborateandsearchcontain nojob statements, thus they do not require any resources. Their resource requirements are part of the k resources declared for thequerymethod.
An informal argument gives(k+h)/cas the total time required bysearchDBto reply to a query, wherecare the available CPU resources. This means that if we have a ResponseTime requirement of completing this method within a specific number of time units, then we are able to establish the minimum CPU resources of a configuration that complies with the SLA.
To formalise the above argument, we extract the program features that are relevant for the time analysis. The resulting descriptions are called behavioral types and primarily highlight cost annotations and method invocations. For ex-ample, the behavioural types of the above methods are
Service.searchDB(a[x], b[y]) { DataBase.query(b[y]) # h/x } : _ Service.addinfo(a[x]) {0} : _ DataBase.query(a[x]) { DataBase.query(a[x]) # DataBase.elaborate(a[x]) # DataBase.search(a[x]) # k/x } : _ DataBase.elaborate(a[x]) {0} : _
DataBase.search(a[x]) {0} : _
where
– the parameter a[x] binds the this object identity to a and the available capacity tox; similarly,b[y] binds the object identity of the receiver of the
queryinvocation toband its allocated capacity toy;
– the cost h/x is due to the amount of CPU requested by job(h) and the available CPU resourcesx(similarly fork/x);
– the term_is the time information corresponding to the returned value, which is in this case empty;
– the term 0 is the empty behaviour, meaning that no time units are consumed. With the behavioural type specifications at hand, we use two techniques for deriving services’ properties: one is completely automatic and uses solvers of cost equations, and another is semi-automatic (but more precise) and uses theorem provers. We discuss them in detail in the following two subsections.
4.2 The cost equation solver
To evaluate behavioural types specifications, we translate them into so-called cost equations, which are suitable for solvers available in the literature [7,1]. These cost equations are terms
m(x) = exp [se]
where m is a (cost) function symbol, exp is an expression that may contain (cost) function symbols applications. In some cases, more than one equation may be defined for the same function symbol: for instance the if-then-else statement has one equation for each branch. In this case, se is an expression representing the conditions under which the corresponding cost must be taken into account.
Basically, we translate behavioural types of methods into cost equations, where (i) method invocations are translated into function applications, and (ii) cost expressions occurring in the types are left unmodified. For example, the translations of the foregoing methods are:
searchDB(x,y) = query(y) + h/x + addinfo(x) query(x) = elaborate(x) + search(x) + k/x addinfo(x) = elaborate(x) = search(x ) = 0
It is worth to observe that, in this case, being x = y =c, the solver returns
(h+k)/c, as we anticipated previously.
Let us consider a variation of this example, where the service and the database run on different machines. In this case the configuration will include at least two different machines, let us call them ms and md with respectively cs andcd
allo-cated CPU resources. At the time of the creation of the service instance we can specify on which machine it will be deployed, by using a statement of the form:
Service service = new Service in ms;
Database database = new Database in md;
In this setting, all invocations on external machines are to be considered asynchronous, where the caller and the callee execute simultaneously, and the synchronization occurs when the caller attempt to access the result of the invo-cation. The snippet of the methodsearchDBis therefore refined into the following code where the asynchronous invocation is noted with “!” instead of “.” and
Fut<String>is the type of a futureStringvalue.
String searchDB(String s) { String u, v ; Fut<String> w ; w = DB!query(s) ; job(h) ; u = w.get ; v = this.add_info(u) ; return(v); }
The operation w.get explicitly synchronizes the caller with the callee. In this case, the cost equations of the above methods are
searchDB(x,y) = max(query(y) , h/x) + addinfo(x) query(x) = elaborate(x) + search(x) + k/x addinfo(x) = elaborate(x) = search(x ) = 0
Being x =csand y =cd, the solver returns the total cost ofmax(h/cs,k/cd).
4.3 The KeY system
The are cases where the cost equations solver either fails to deliver a result or the result is so over-approximated that it becomes unusable. In particular, the cost equations m(x) = exp [se] that the solver takes as inputs are constrained by the fact that se is a boolean expression in a decidable fragment of Peano arithmetic – presburger arithmetic which admits only addition and multiplication by integer constants. Therefore, whenever behavioural types use expressions that are not written in presburger arithmetics, we extend them by manually adding preconditions and in the postconditions specifying costs and metrics.
We use a semi-interactive theorem prover called KeY [6], which uses symbolic execution to analyze programs. Properties are specified in KeY using dynamic logic [20] and are demonstrated using the sequent calculus [9]. It turns out that most proof steps (usually more than 99%) are automatically applied by the proof search strategies. Behavioral types plus KeY verification support a compositional analysis: each type can be analyzed in isolation, on the basis of its own defini-tion and only the contracts of the other methods – without knowledge of the underlying definition of the other behavioral types. This is not the case of cost equations that, once produced, are a monolithic, global specification.
KeY can be leveraged by following the steps below:
1. replace the cost expression c in method bodies by an assignment time = time+c;;
2. add method contracts, specifying in the postcondition of each method the expected response time using the variable time and the capacities of ma-chines;
3. prove the resulting instrumented program with KeY.
Applying these steps yields the following annotated behavioral types:
//@ ensures time == \old(time) + k/y + h/x;
Service.searchDB(a[x], b[y]) {
DataBase.query(b[y]) # time = time + h/x } : _
//@ ensures time == \old(time);
Service.addinfo(a[x]) {0} : _
//@ ensures time == \old(time) + k/x;
DataBase.query(a[x]) {
DataBase.query(a[x]) # DataBase.elaborate(a[x]) # DataBase.search(a[x]) #time = time + k/x } : _
//@ ensures time == \old(time);
DataBase.elaborate(a[x]) {0} : _
//@ ensures time == \old(time);
DataBase.search(a[x]) {0} : _
For parallel programs with asynchronously executing threads, the above in-strumentation might overestimate the actual time and cost consumed: it always sums the cost of tasks. In these cases, the behavioural type is x.m() ||| y.n(), rather thanx.m(); y.n()(the operation “|||” represents parallel composition). KeY derives the cost ofx.m() ||| y.n()by taking the maximum of the costs of
x.m()and of y.n().
A useful task that KeY supports is the formal proof that response times of a method are under a defined threshold. This is achieved by the same instrumen-tation discussed above. The only change needed is in the behavioural types of methods: one can adjust the postcondition with an assertion of the formtime <
d, where dis a symbolic threshold. This is shown in the contract below.
//@ ensures time time < d;
Service.searchDB(a[x], b[y]) { ...
}
5
Run-time analysis
In order to enforce service metrics that cannot be verified statically (because of factors under external control, such as the underlying infrastructure) we use code external to the service that continuously monitors it. We discuss this tech-nique using two service metrics of Example 1: the percentage of timely service provisioning requests and the service throughput.
A simple implementation of the function PTSs defined in Section 3 uses a
monitoring method that intercepts all the HTTP invocations to a service and their corresponding replies. This allows the monitor to record the time taken by every request to be completed. Consider the following pseudo-code for this method
void monitor_service_time() { (service,method,msg,client,m_id) = HttpRequest.intercept(); time_start = time(); reply = service.method(msg); time_end = time(); HttpResponse.send(client,reply,m_id); log(m_id,time_start,time_end); }
The method percentage takes as input a time window and returnstrue if the percentage of requests complies with the definition of PTSs, is implemented by
the monitor:
boolean percentage(Time t_begin, Time t_end){ boolean v = true ;
/∗ retrieve from the log the total number of messages served in the time window ∗/
nmb_msg = get_total_messages(t_begin, t_end) ;
/∗ check whether the SLA percentages of served requests correspond to the observed ones ∗/
nmb_msg_completed = find(t_begin, t_end, 60) ;
v = v && (nmb_msg_completed/nmb_msg <= 0.95) ; //95% in 1 min
nmb_msg_completed = find(t_begin, t_end, 180) ;
v = v && (nmb_msg_completed/nmb_msg <= 0.97) ; //97% in 3 mins
nmb_msg_completed = find(t_begin, t_end, 300) ;
v = v && (nmb_msg_completed/nmb_msg <= 0.98) ; //98% in 5 mins
return v; }
Similarly, the monitor implementing the service metric STs in Section 3 is
the method:
boolean throughput(Log_file d, Time t_begin, Time t_end){ int daily = 0;
int nightly = 0;
/∗ collects the number of the served requests during the two specified time−frames ∗/
for each (m_id, time_init, time_end) in d {
if ((time_init >= 32400) && (time_init <= 64800)) // 9:00−18:00
daily = daily + 1 ; else nightly = nightly + 1 ; }
/∗ return true if 8 queries per minute are completed in 9:00−18:00 and 4 queries per minute in the remaining time ∗/
return ( ((daily/60*9)>8) && ((nightly/60*15)>4) ); }
The above straightforward development of monitoring systems allows service providers to report violations of the agreed SLA. However, the ultimate goal for a provider is to maintain the resource configuration in such a way that SLA violations remain under a given threshold while minimizing the cost of the system. The first objective can be achieved by adding resources to the service (for instance, adding more CPUs).
To this aim, the monitoring platform works in two cyclic phases: observation and reaction. The observation phase takes measurements on services – the fore-going methods percentage and throughput. Subsequently, if an SLA mismatch
is observed, in the reaction phase, the number of allocated resources are in-creased. The monitoring platform developed in the Envisage Project also allows to decrease the number of resources if it is too costly/high [18]. The following
reaction method verifies every 300s whether the percentage of timely service provisioning requests is reached and, in case of failures, adds one more CPU:
void reaction(Service s) { Time t ; Bool v ; t = time() ; idle(300) ; v = percentage(d,t, t+300) ; if (!v) MonitoringPlatform ! allocate(s) ; }
Correctness of the monitoring framework (i.e. that the monitors converge within a user-given time towards the service level objectives specified in an SLA) was investigated in [18]. The idea is to translate the code for the program in-cluding the monitoring code into timed automata for use with UPPAAL [4]. The service level constraints from SLAs are translated into deadlines for the automata. The translation can be done automatically, along the lines of [12]. It is then possible to prove that, if all timed automata are schedulable (no missed deadline), then the SLA of the service is satisfied in the given timeframe.
6
Further aspects of metrics’ definition and verification
In the previous sections we have discussed basic service metrics used in SLA documents. In this section we address two additional issues: (i ) metrics may be conflicting: one metric requires an increase of resources allocated to a service, while another one requires a decrease of the same resources, and (ii ) particular services may require complex service metrics.
Conflicting Metrics. Consider the following SLA constraints for the first example of Section 4.1: STsearchDB([1.t, 366.t0], 60) = 4 if t = 0 and t0= 32399 8 if t = 32400 and t0= 64800 4 if t = 64801 and t0= 86399 RTsearchDB([1.0, 366.86399]) = 420s
The analysis of Section 4.2 gave an upper bound for searchDB response time of
(k+h)/ctime units. Letting the available amount of CPU resources be 2 andk=5
and h=10, then we have a response time of 7.5 seconds. This satisfies the RTs
metrics, since it is well below the maximum response time imposed by the SLA. Therefore the initial configuration of 2 CPU resources is found to be well suited for assuring the required QoS. Notice that, considering the time for executing a single request of searchDB, we can deduce that the STsearchDB value is indeed
reasonable. In addition, assume that monitor_service_time, which observes the execution of the service, has not logged any entry wheretime_end-time_beginis greater then 420 seconds – i.e. the response time is still matched.
However, the launch of thethroughputmonitor reports that only 4 requests are served per minute, which violates the SLA (requiring to serve 8 requests per minute during the day) because of latency problems for scheduling the requests or for connecting to the database. Henceforth, thereaction method requests to the monitoring platform and obtains a machine with 2 additional CPU resources. The service is moved on the new machine and the throughputmonitor doesn’t find any violation anymore. However, during the night, half of the resources would have been sufficient for meeting the SLA requirement (which is only 4 requests per minute during the night). The customer is paying for unnecessary resources.
To overcome such issues, we consider an additional metric defining the budget for the service with respect to particular time windows:
BudgetsearchDB([1.t, 366.t0]) = 40 if t = 0 and t0 = 32399 80 if t = 32400 and t0 = 64800 40 if t = 64801 and t0 = 86399
Namely, BudgetsearchDB specifies that, during the day, the customer is willing to pay up to 80, while only half for the night.
The techniques discussed in Section 4 may verify whether a service complies with BudgetsearchDB or not. In particular, an adequate budget is the cost of the minimum number of resources the program needs to execute, which is the cost of an upper bound of resources needed by the program. Taking CPUs as relevant resources and assuming that each CPU resource costs 10, then the analysis will approve BudgetsearchDB, since the allocated money is enough to pay for 8 resources during the day and 4 during the night. However, a run-time CPU reallocation has been triggered by the throughput monitor. It turns out that the budget
compliance is not met anymore because the expenses for the resource usage double the nightly budget. In this case, thebudget_monitorreacts by requiring
a deallocation of half of the CPU units during the night.
It is worth to notice that the allocations and deallocations required by a monitoring system may lead to a cyclic behaviour that does not reach any sta-ble point. Therefore, in order to enforce stability, we also consider the notion of service guarantee time, namely the total amount of time from the start of the monitoring platform that a service is expected to meet its expectations of the SLA. In facts, we use the following refined version of reaction method of Section 5: void reaction(Service s) { Time t ; Bool v ; t = time() ; idle(300) ; v = percentage(d, t, t+300) ; if (!v) {
if (t > global_time_start + t_G) { // SLA is violated
notify(s, ‘‘SLA violation’’) ; } else MonitoringPlatform.allocate(s) ; }
Composite metrics. SLA documents may contain (performance) metrics that are not directly defined in terms of those in Section 3 but are a composition of them. We discuss an example.
Example 2. A mobile search app provides mobile offline search by means of on-device search indices that are built and distributed by a cloud service. A primary motivations for mobile offline search, besides increasing search availability and strengthen user privacy, is to reduce search latency by using consistently fast on-device storage rather than accessing mobile and Wi-Fi network with highly variable latency. As a consequence, the most relevant aspect for evaluating the quality of the provided service is the freshness of index data on the mobile device. This property specifies time-related guarantees about the interval between the publication of a document in the cloud and its indexing and availability on the mobile device.
The metric freshness of index data on the mobile device, noted FID, actually is the sum of the response time RTsand the delivery time DTs, namely the time to
transfer the data to the devices. This last metric DTsdepends on the data size of
the response and the available bandwidth. While the data size δ is a parameter, the bandwidth metric B(τ ) is another basic capacity metric (which has not been discussed in Section 3). B(τ ) is expressed in Mb/s and defines the minimum amount of bandwidth required by the service in a particular time frame. It turns out that DTs(τ, δ) = δ/B(τ ) and, therefore, we may define
FID(τ, δ) = DTs(τ, δ) + RTs(τ, δ) .
7
Conclusions and related works
The methodology we have presented in this paper is being devised in the context of the EU Project Envisage [2]. The aim of the project is to develop a semantic foundation for virtualization and SLA that makes it possible to efficiently develop SLA-aware and scalable services, supported by highly automated analysis tools using formal methods. SLA-aware services are able to control their own resource management and renegotiate SLA across the heterogeneous virtualized comput-ing landscape. The two examples we analyze in this contribution are taken from industrial case studies in the aforementioned project: the service described in Example 1 is an actual service provided by Fredhopper Cloud Services 3. The mobile app presented in Example 2 is the Memkite app by Atbrox4.
In the Envisage Project we also use other techniques for analyzing services, such as simulations and test generation covering critical scenarios. We intend to investigate if these additional techniques can be used for SLA compliance (and to what extent). For example, if they can provide augmented precision or more detailed descriptions of misbehaviours.
3
http://www.sdl.com/products/fredhopper/
4
Related Work. Several proposals define a language or a framework to formalize SLAs. However, there is no study how such SLAs can be used to verify or monitor the service and upgrade it as necessary. In this respect, up-to our knowledge, our technique that uses both static time analysis and run-time analysis is original.
As regards SLA formalizations, we recall few recent efforts. WSLA [14] in-troduces a framework that defines SLAs in a technical way and breaks down customer agreements in terms to be monitored. SLAng [15] introduces a lan-guage for defining metrics that deal with the problems of networks and studies a technique to ensure the corresponding service qualities. SLA? [13] introduces a generic language to specify SLAs with a fine-grained level of detail. In [16], a method is proposed to translate the SLA specification into an operational mon-itoring specification. This technique is being used by the EU Project SLA@SOI.
References
1. Elvira Albert, Puri Arenas, Antonio Flores-Montoya, Samir Genaim, Miguel G´omez-Zamalloa, Enrique Martin-Martin, Germ´an Puebla, and Guillermo Rom´ an-D´ıez. SACO: Static Analyzer for Concurrent Objects. In Proceedings of TACAS’14, volume 8413 of LNCS, pages 562–567. Springer-Verlag, 2014.
2. Elvira Albert, Frank de Boer, Reiner H¨ahnle, Einar Broch Johnsen, and Cosimo Laneve. Engineering virtualized services. In M. Ali Babar and Marlon Dumas, editors, Proceedings of NordiCloud’13, pages 59–63. ACM Press, 2013.
3. Bernhard Beckert, Reiner H¨ahnle, and Peter H. Schmitt, editors. Verification of Object-Oriented Software. The KeY Approach, volume 4334 of LNCS. Springer-Verlag, 2007.
4. Gerd Behrmann, Alexandre David, and Kim G Larsen. A tutorial on Uppaal. In Formal methods for the design of real-time systems, pages 200–236. Springer, 2004. 5. Maria Grazia Buscemi and Ugo Montanari. Qos negotiation in service composition.
J. Log. Algebr. Program., 80(1):13–24, 2011.
6. Crystal Chang Din, Richard Bubel, and Reiner H¨ahnle. KeY-ABS: A deductive verification tool for the concurrent modelling language ABS. In Proceedings of CADE-25, volume 9195 of LNCS, pages 517–526. Springer-Verlag, 2015.
7. Antonio Flores Montoya and Reiner H¨ahnle. Resource analysis of complex pro-grams with cost equations. In Jacques Garrigue, editor, 12th Asian Symposium on Programming Languages and Systems (APLAS’14), volume 8858 of LNCS, pages 275–295. Springer, November 2014.
8. Abel Garcia, Cosimo Laneve, and Michael Lienhardt. Static analysis of cloud elasticity. In Proceedings of the 17th International Symposium on Principles and Practice of Declarative Programming, Siena, Italy, July 14-16, 2015, pages 125– 136. ACM, 2015.
9. Gerhard Gentzen. Untersuchungen ber das logische schlieen. i. Mathematische Zeitschrift, 39(1):176–210, 1935.
10. Elena Giachino, Einar Broch Johnsen, Cosimo Laneve, and Ka I Pun. Time com-plexity of concurrent programs. To appear in Proceedings of FACS 2015, 2015. 11. Cloud Select Industry Group. Cloud service level agreement standardisation
guidelines, June 2014. Developed as part of the Commissions European Cloud Strategy. Available at http://ec.europa.eu/information_society/newsroom/ cf/dae/document.cfm?action=display&doc_id=6138.
12. Mohammad Mahdi Jaghoori. Composing real-time concurrent objects refinement, compatibility and schedulability. In Fundamentals of Software Engineering, pages 96–111. Springer Berlin Heidelberg, 2012.
13. Keven T Kearney, Francesco Torelli, and Constantinos Kotsokalis. SLA?: An ab-stract syntax for Service Level Agreements. In Grid Computing (GRID), 2010 11th IEEE/ACM International Conference on, pages 217–224. IEEE, 2010.
14. Alexander Keller and Heiko Ludwig. The WSLA framework: Specifying and mon-itoring service level agreements for web services. Journal of Network and Systems Management, 11(1):57–81, 2003.
15. D. Davide Lamanna, James Skene, and Wolfgang Emmerich. Slang: A language for defining service level agreements. In Proccedings of (FTDCS’03), page 100. IEEE Computer Society, 2003.
16. Khaled Mahbub, George Spanoudakis, and Theocharis Tsigkritis. Translation of SLAs into monitoring specifications. In Service Level Agreements for Cloud Com-puting, pages 79–101. Springer, 2011.
17. David L. Martin, Mark H. Burstein, Drew V. McDermott, Sheila A. McIlraith, Massimo Paolucci, Katia P. Sycara, Deborah L. McGuinness, Evren Sirin, and Naveen Srinivasan. Bringing semantics to web services with OWL-S. World Wide Web, 10(3):243–277, 2007.
18. Behrooz Nobakht, Stijn de Gouw, and Frank S. de Boer. Formal verification of service level agreements through distributed monitoring. In Schahram Dustdar, Frank Leymann Schahram, and Massimo Villari, editors, Proceedings of ESOCC 2015, LNCS, pages 125–140. Springer-Verlag, 2015.
19. Joseph Okika. Analysis and Verification of Service Contracts. PhD thesis, Depart-ment of Computer Science, Aalborg University, 2010.
20. Vaughan R. Pratt. Semantical considerations on floyd-hoare logic. In 17th Annual Symposium on Foundations of Computer Science, Houston, Texas, USA, 25-27 October 1976, pages 109–121, 1976.