HAL Id: halshs-00497446
https://halshs.archives-ouvertes.fr/halshs-00497446
Submitted on 5 Jul 2010
HAL is a multi-disciplinary open access archive for the deposit and dissemination of sci-entific research documents, whether they are pub-lished or not. The documents may come from
L’archive ouverte pluridisciplinaire HAL, est destinée au dépôt et à la diffusion de documents scientifiques de niveau recherche, publiés ou non, émanant des établissements d’enseignement et de
Does Inflation Targeting decrease Exchange Rate
Pass-through in Emerging Countries ?
Dramane Coulibaly, Hubert Kempf
To cite this version:
Dramane Coulibaly, Hubert Kempf. Does Inflation Targeting decrease Exchange Rate Pass-through in Emerging Countries ?. 2010. �halshs-00497446�
Documents de Travail du
Centre d’Economie de la Sorbonne
Does Inflation Targeting decrease Exchange Rate Pass-through in Emerging Countries ?
Dramane COULIBALY, Hubert KEMPF
Does Inflation Targeting decrease Exchange
Rate Pass-through in Emerging Countries ?
Dramane Coulibaly
∗Paris School of Economics
University Paris 1 Panth´eon Sorbonne
Hubert Kempf
†Banque de France
Paris School of Economics
University Paris 1 Panth´eon Sorbonne
∗This paper has been initiated while Dramane Coulibaly held a visiting research
po-sition at the Banque de France. Support provided by Banque de France is thus grateful acknowledged. The Banque de France does not necessarily share the opinions expressed in this paper. Usual caveats apply.
†Corresponding author : Hubert Kempf, Banque de France, Paris School of Economics
R´esum´e
Dans ce papier, nous examinons empiriquement l’impact de l’adoption du ciblage d’inflation sur le pass-through du taux de change dans les pays ´emergents. Nous utilisons une approche en panel VAR qui nous permet d’uti-liser un grand ´echantillon sur vingt-sept pays ´emergents (quinze cibleurs d’in-flation et douze non-cibleurs d’ind’in-flation). Nos r´esultats montrent que l’adop-tion du ciblage d’inflal’adop-tion dans les pays ´emergents a permis de r´eduire le pass-through du taux de change sur divers indices de prix (prix des imports, prix des producteurs et prix de la consommation) d’un niveau tr`es ´elev´e `a un nouveau niveau qui est significativement diff´erent de z´ero. L’analyse de la d´ecomposition de la variance montre que la contribution des chocs de taux de change dans la fluctuation des prix est ´elev´ee dans les pays cibleurs que dans les pays non-cibleurs, et la contribution des chocs de taux de change dans la fluctuation des prix dans les pays cibleurs a baiss´e apr`es l’adoption du ciblage d’inflation.
Mots-cl´es :Ciblage d’inflation, Pass-through du taux de change, panel VAR.
Codes JEL : E31, E52, F41.
Abstract
In this paper, we empirically examine the effect of inflation targeting on the exchange rate pass-through to prices in emerging countries. We use a pa-nel VAR that allows us to use the larger data set on twenty-seven emerging countries (fifteen inflation targeters and twelve inflation nontargeters). Our evidence suggests that inflation targeting in emerging countries has helped to reduce the pass-through to various price indexes (import prices, produ-cer prices and consumer prices) from a higher level to a new level that is significantly different from zero. The variance decomposition shows that the contribution of exchange rate shocks to prices fluctuations is more important in emerging targeters compared to nontargeters, and the contribution of ex-change rate shocks to price fluctuations in emerging targeters declines after adopting inflation targeting.
Keywords :Inflation Targeting, Exchange Rate Pass-Through, panel VAR.
1
Introduction
After New Zealand initiated inflation targeting in 1990, a large number of industrial and emerging countries have explicitly adopted an inflation target as their nominal anchor. In the last two decades, ten industrial economies
and twenty emerging economies1 have adopted the full-fledged inflation
tar-geting system for managing monetary policy. Many other emerging countries are intend to adopt this monetary framework in the near future. Given the vulnerability of emerging countries to exchange rate shocks, a key element for the success of this strategy depends on its ability to reduce the exchange rate pass-through. Various studies have shown a decrease in exchange rate pass-through in the last two decades : is it related to inflation targeting ?
Many studies have provided some evidence that adoption of inflation tar-geting is associated with an improvement in overall economic performance (Bernanke and Mishkin (1997) ; Svensson (1997) ; Bernanke et al.(1999) among others). Ball and Sheridan (2005), one of the few empirical papers critical of inflation targeting, argue that implementation of inflation targeting ap-pears to have been irrelevant in industrial countries. Precisely, based on OLS cross-section estimation, their results indicate that the reduction in the level and the volatility of inflation in inflation targeting countries simply reflects regression toward the mean, i.e., inflation will fall faster in countries that start with high inflation than in countries with an initial low inflation. Since countries having implemented inflation targeting had generally an initial high level of inflation, the bigger drop in inflation for those countries simply re-flects a tendency for this variable to revert to its mean. But, as their study focused solely on industrial countries, their results suffer from a selection bias problem. Gon¸calves and Salles (2008) extended Ball and Sheridan’s analysis for a subset of 36 emerging economies and found that, for those countries, the results are different. Specifically, countries which have adopted inflation targeting have experienced greater reductions in inflation and in growth vo-latility, even after controlling for mean reversion.
The present paper contributes to this literature on inflation targeting by analyzing the effect of inflation targeting on exchange rate pass-through in emerging countries. It is based on the hypothesis in Taylor (2000) that argues that exchange rate pass-though is lower in low-inflation environment.
1. The ten industrial countries targeters are Australia, Canada, Finland, New Zealand, Norway, Spain, Sweden, Switzerland and United Kingdom. Finland and Spain are now in euro area. The twenty emerging countries targeters are Brazil, Chile, Colombia, Czech republic, Ghana, Guatemala, Hungary, Indonesia, Israel, Korea, Mexico, Peru, Philippines, Poland, Romania, Serbia, Slovakia, South Africa, Thailand and Turkey. Slovakia ceased inflation targeting in January 2009 with its ERM II entry
More precisely Taylor’s argument is that in low-inflation environment firms expect a deviation of inflation to be less persistent and would therefore pass on less of an exchange rate-induced increase in the price of imported in-puts to its selling prices. This hypothesis has been supported by empirical evidence based on consumer price index (CPI), both for industrialized and emerging countries (see for example Gagnon and Ihrig (2001) or Choudhri and Hakura (2006)). Since Gon¸calves and Salles (2008) show that inflation targeting has helped to reduce inflation in emerging countries, it is inter-esting to analyze whether the adoption of inflation targeting has lead to a decrease in exchange rate pass-through. This idea was explored by Mishkin and Schmidt-Hebbel (2007). Mishkin and Schmidt-Hebbel (2007) empirically study the link between inflation targeting and some measures of economic performance including exchange rate pass-through. Using data on twenty-one industrial and emerging inflation-targeting countries (targeters) and thirteen industrial countries without inflation targeting (nontargeters) they employ panel VAR techniques. To test for differences, they adopt the difference-in-difference approach by comparing impulse response functions in different country samples, depending on whether a country has inflation targeting in place. The results of this analysis show that pass-through effect to consumer prices has been close to zero in industrial inflation targeters before and after inflation targeting and in nontargeters. But in emerging inflation targeters, the exchange rate pass-through to consumer prices fell after the countries achieved a stationary target but remains positive and significantly different from zero.
However, these of results Mishkin and Schmidt-Hebbel (2007) suffer from a selection bias as there is no emerging inflation nontargeters in the control group. This raises the following question : Does, by using emerging inflation nontargeters as control group, the exchange rate pass-through effect decreases in emerging countries targeters after adopting inflation targeting ? To answer this question, we extend Mishkin and Schmidt-Hebbel’s analysis to a subset of twenty-seven emerging economies (fifteen targeters and twelve nontargeters). After a first VAR analysis by including the consumer prices (CPI) as the only price, we conduct a second VAR analysis by including two other prices : import prices (IMP) and producer prices (PPI). The use of these two prices in the VAR allows us to directly answer to the Taylor’s hypothesis. A decrease in pass-through effect to import prices means that after the adoption of inflation targeting a retailing firm that imports goods from abroad absorbs a larger fraction of an exchange rate shock through a smaller variation in its selling prices. A decrease in pass-through effect to producer prices means that after the adoption of inflation targeting, a firm that imports its inputs from abroad absorbs a larger fraction of an exchange rate shock through a
smaller variation in the prices of its final products.
The main results of this paper are the following. The adoption of infla-tion targeting in emerging countries has helped to reduce the pass-through to consumer prices from a initial higher level to a new level that, howe-ver, remains significantly different from zero. For emerging nontargeters the story is different, the pass-through to consumer prices has not been signifi-cantly different from zero before 1999 and has signifisignifi-cantly become positive after 1999. By comparing emerging inflation targeters after adopting infla-tion targeting to emerging nontargeters after 1999, the pass-through effects to consumer prices are not significantly different among the two groups of emerging targeters and nontargeters. Finally, the decline in pass-through to consumer prices in emerging inflation targeters is attributable to the decline in pass-through effect along the prices chain. In fact, the pass-through effects to both import and producer prices fell significantly in emerging inflation targeters after adopting inflation targeting framework.
The remainder of the paper is organized as follows. Section 2 presents methodology and data. Section 3 presents the empirical results and theirs interpretations. Section 4 concludes the study.
2
Methodology and Data
Our quarterly dataset consists of twenty-seven emerging economies (fif-teen inflation targeters and twelve inflation nontargers), covering the 1989Q1-2009Q1 period. Using the panel VAR difference-in-difference strategy em-ployed by Mishkin and Schmidt-Hebbel (2007), we investigate whether, consi-dering emerging nontargeters as control group, inflation targeting has helped to reduce the exchange rate pass-through to domestic prices in emerging countries.
We use panel VAR techniques to estimate the impulse response functions. The use of panel VAR techniques has two main advantages. First, the VAR approach addresses the endogeneity problem by allowing endogenous inter-actions between the variables in the system. Second, the asymptotic results are easier to derive for panel data.
The econometric model takes the following reduced form :
Yit = Γ(L)Yit+ ui+ ǫit (1)
where Yit is a vector of stationary variables, Γ(L) is a matrix polynomial in
the lag operator with Γ(L) = Γ1L1 + Γ2L2 + . . . + ΓpLp, ui is a vector of
An issue in estimating this model concerns the presence of fixed effects. As fixed effects are correlated with the regressors, due to lags of the dependent variable, we use forward mean differencing (the Helmert procedure), following Love and Zicchino (2006). In this procedure, to remove the fixed effects, all variables in the model are transformed in deviations from forward means. Let
¯
ym
it =
PTi
s=t+1yism/(Ti−t) denote the means obtained from the future values
of ym
it, a variable in the vector Yit = (y1it, yit2, . . . , y
M
it )′, where Ti denotes the
last period of data available for a given country series . Let ¯ǫm
it denote the same transformation of ǫm it, where ǫit= (ǫ1it, ǫ2it, . . . , ǫ M it )′. Hence we get : ˜ ym it = δit(ymit −y¯it) (2) and ˜ǫm it = δit(ǫmit −¯ǫ m it) (3) where δit = q
(Ti−t)/(Ti−t + 1). For the last year of data this
transforma-tion cannot be calculated, since there are no future value for the constructransforma-tion of the forward means. The final transformed model is thus given by :
˜ Yit= Γ(L) ˜Yit+ ˜ǫit (4) where ˜Yit = (˜yit1, ˜yit2, . . . , ˜y M it)′ and ˜ǫit= (˜ǫ1it, ˜ǫ2it, . . . , ˜ǫ M it )′
This transformation is an orthogonal deviation, in which each observation is expressed as a deviation from average future observations. Each observa-tion is weighed so as to standardize the variance. If the original errors are not autocorrelated and are characterized by a constant variance, the transformed errors should exhibit similar properties. Thus, this transformation preserves homoscedasticity and does not induce serial correlation (Arellano and Bover, 1995). Additionally, this technique allows to use the lagged values of regres-sors as instruments and estimate the coefficients by the generalized method of moment (GMM).
Once all coefficients of the panel VAR are estimated, we compute the impulse
response functions (IRFs).2 In order to compute the IRFs we use Cholesky
decomposition. The assumption behind Cholesky decomposition is that se-ries listed earlier in the VAR order impact the others variables contempora-neously, while series listed later in the VAR order impact those listed earlier
2. The panel VAR is estimated by using the package provided by Inessa Love. This package is a Stata programs for Love (2001) and it is used in Love and Zicchino (2006).
only with lag. Consequently, variables listed earlier in the VAR order are considered to be more exogenous.
We apply bootstrap methods to construct the confidence intervals of the IRFs. Since we cannot assume independence among the various samples, we also employ bootstrap methods to construct confidence intervals for
diffe-rences in IRFs rather than simply taking their diffediffe-rences.3
Following Ito and Sato (2007, 2008)4, we set up a 5-variable VAR model,
Yit = (∆oilit, gapit, ∆mit, ∆nerit, ∆cpiit)′, where oil denotes the natural log
of world oil prices ; gap the output gap ; m the natural log of money supply ; ner that of the nominal exchange rate ; cpi that of the consumer price index (CPI) ; and ∆ represents the first difference operator. The change in oil prices is included to identify the supply shock. We include the output gap to capture the demand side. The money supply is included in the VAR to allow for the effect of monetary policy in response to a large fluctuation in exchange rate or devaluation.
To answer directly the Taylor conjecture, we also attempt to conduct an additional estimation with 7-variable VAR model by including two other price indexes : the producer price index (PPI) and the import price index (IMP). As mentioned above, a decrease in the pass-through effect on im-port prices will mean that retail firms that imim-port their commodities pass through a lower fraction of an exchange rate shock into their selling prices ; and, a decrease in the pass-through effect on producer prices will mean that firms that import their inputs pass though a lower fraction on such a shock into the final goods prices. According to Burstein, Eichenbaum and Rebelo (2002, 2005), the extent of CPI inflation after a large changes in exchange rate depends on the relative importance of imported inputs being used for domestic production and the presence of distribution costs. The production or distribution channels can dampen the effect of exchange rate changes and account for a low pass-through to consumer prices. Then, the 7-variable VAR model allows us to examine the exchange rate pass-through along the pricing chain. In other words, it allows us to examine whether inflation targeting could have negatively impacted on the pass-through to consumer prices by lowering pass-through to imported and/or producer prices.
As discussed above, the order of endogenous variables is central to the identification of structural shocks. The change in oil prices included to iden-tify the supply shock is ordered first in the VAR. The output gap is placed
3. If we assume sample independence, the confidence intervals for differences in IRFs would be narrower.
4. Ito and Sato (2007) used VAR technique to compare the exchange rate pass-through effects of East Asia and Latin American Countries, while Ito and Sato (2008) applied VAR analysis to exchange rate pass-through in East Asian countries .
second. The demand and supply shocks that affect the output gap are as-sumed to be predetermined. The money supply is ordered third and before the nominal exchange rate and the price variables. Then, for the 5-variable VAR the ordering is : ∆oil, gap, ∆m, ∆ner, ∆cpi. In 7-variable VAR it seems appropriated to place import prices ahead of producer and consumer prices and to place consumer prices last in the ordering. Thus, for the 7-variable VAR the ordering is : ∆oil, gap, ∆m, ∆ner, ∆imp, ∆ppi, ∆cpi.
3
Empirical Results
This section presents the results of the impulse response function ana-lysis. The details of the data for empirical estimation are presented in the appendix. Before conducting the structural VAR estimation, we tested for stationarity. Since the oil price is a variable that does not depend on coun-tries, the stationarity test on this variable is conducted by using the stan-dard Augmented Dickey-Fuller unit root test. For the other variables, we use Maddala and Wu (1999) panel unit root test. The tests results (see Table 1) show that the oil price, three types of domestic prices, the money supply and the nominal exchange rate are non-stationary in level but stationary in first-differences for all countries. The output gap is found to be stationary in level. Previous studies (for example Ito, T. and K. Sato 2007, 2008, Mishkin, F. and K. Schmidt-Hebbel, 2007) suggest to include in a VAR the output gap in level together with other variables in first-difference. We follow this methodology in our structural VAR analysis. The model yields similar IRFs when we include two lags or more. Hence, we selected a lag order of two for reasons of parsimony.
We start by discussing the impulse responses of CPI to an exchange rate shock in the 5-variable VAR model for targeters and nontargeters. We also discuss the impulse responses of all prices (CPI, PPI and IMP) to an exchange rate shock in the 7-variable VAR model for targeters.
3.1
Comparison of Exchange pass-through to domestic
CPI of targeters and nontargeters
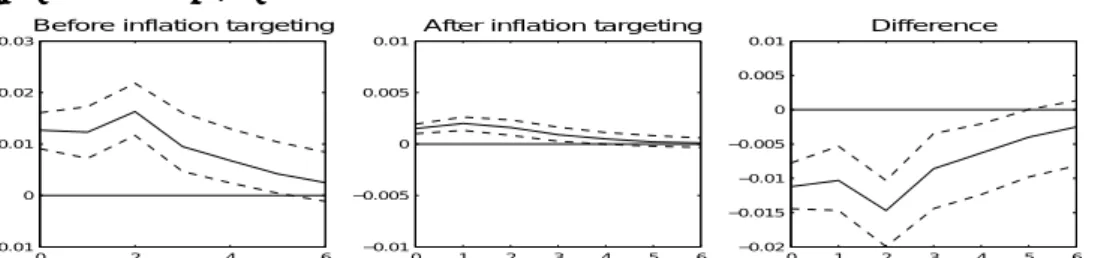
In this subsection we discuss the impulse responses of CPI to an exchange rate shock in the 5-variable VAR model for targeters and nontargeters. The impulse responses for the different samples are reported in Figures 1-3. Each figure focuses on a comparison between the dynamic response of two sample groups. Figure 1 reports before-and-after comparisons for inflation targeters before and after adopting inflation targeting. Figure 2 reports
before-and-Table 1 – Unit Root test Variables P-value oil 0.4644 ∆oil 0.0000 g 0.0000 m 0.4642 ∆m 0.0000 ner 0.8206 ∆ner 0.0000 cpi 0.6313 ∆cpi 0.0000 imp 0.1448 ∆imp 0.0000 ppi 0.4041 ∆ppi 0.0000
Note : The unit root test for oil and ∆oil is Augmented Dickey-Fuller (ADF) test since these variables do not depend on countries (the p-value is MacKinnon approximate p-value). The null hypothesis of the ADF test is that the variable is non-stationary. For other variables, the unit root test is the panel unit root test developed by Maddala and Wu (1999) with the the null hypothesis that all series are non-stationary against the alternative that at least one series in the panel is stationary. The test is implemented by Stata module xtfisher. No lag is used for g. 4 lags are used for oil. 13, 5 , 8, 7, and 9 lags are used for m, ner, cpi, imp and ppi, respectively. Using a lag length higher, the results were still found to be the same. For the level of variables, constant and time trend are included. For the first-difference of variables, only constant is included.
after comparisons for inflation nontargeters before and after 19995. Figure
3 reports comparisons across the two sample of targeters and nontargeters : inflation targeters after adopting inflation targeting are compared to nontar-geters after 1999. In these figures the third cell reports the difference between the two preceding responses (the response in the second cell minus the res-ponse in the first cell).
Figure 1 shows a positive significant exchange rate pass-through to consu-mer prices in inflation targeting countries that decreases after they adopted inflation targeting. As reflected by the confidence intervals in third cell, the decrease in exchange rate pass-through to consumer prices is statistically different from zero. As reported in Figure 2, for nontargeters the exchange
5. 1999 is around the average of the adoption date of inflation targeting in emerging countries. We also ran estimations using, 1998, and 2000 as the demarcation periods. These changes did not substantially affect our results.
rate pass-through to CPI has not been significantly different from zero before 1999 and has become significantly positive after 1999. Figure 3 shows that the exchange rate pass-through to consumer prices is the same for targeters after inflation targeting and nontargeters after 1999.
We reach some conclusions from our comparison of dynamics of pass-through effects from exchange rate shocks to domestic consumer prices. First, the adoption of inflation targeting in emerging countries has helped to duce the pass-through from a higher level, and the pass-through effect re-mains significantly different from zero. Second, for emerging nontargeters, the pass-through has not been significantly different from zero before 1999 and becomes significantly positive after 1999. Finally, by comparing emerging inflation targeters after adopting inflation targeting to emerging nontargeters in recent years, the pass-through effects are not significantly different among the two groups of emerging targeters and nontargeters.
The decrease in the exchange pass-through to consumer prices can be attributable to the decline in the exchange rate pass-through to import or domestic producer prices. In the next subsection we will focus on the charac-teristics of this mechanism.
Figure 1 – Response of CPI to an exchange rate shock : Emerging targeters
(5-variable VAR) 0 1 2 3 4 5 6 −0.01 −0.005 0 0.005 0.01
After inflation targeting
0 1 2 3 4 5 6 −0.02 −0.015 −0.01 −0.005 0 0.005 0.01 Difference 0 2 4 6 −0.01 0 0.01 0.02 0.03
Before inflation targeting
Note : The solid line shows the impulse response to an exchange rate shock. The dashed lines indicate five standard error confidence band around the estimate. Error are generated by Monte-Carlo with 500 repetitions.
3.2
Exchange Rate pass-through along pricing chain
in emerging inflation targeters
In the previous subsection, we have obtained evidence that inflation tar-geting has helped the exchange rate pass-through to consumer prices to de-crease. As discussed above, the response of consumer prices to changes in ex-change rate depends on the extent of imported inputs being used for domestic production and the presence of distribution costs. The production or distri-bution channels can dampen the effect of exchange rate changes on consumer
Figure 2 – Response of CPI to an exchange rate shock : Emerging nontar-geters (5-variable VAR)
0 1 2 3 4 5 6 −0.01 −0.005 0 0.005 0.01 Before 1999 0 1 2 3 4 5 6 −0.01 −0.005 0 0.005 0.01 After 1999 0 1 2 3 4 5 6 −0.01 −0.005 0 0.005 0.01 Difference
Note : The solid line shows the impulse response to an exchange rate shock. The dashed lines indicate five standard error confidence band around the estimate. Error are generated by Monte-Carlo with 500 repetitions.
Figure 3 – Response of CPI to an exchange rate shock : targeters versus
nontargeters (5-variable VAR)
0 1 2 3 4 5 6 −0.01 −0.005 0 0.005 0.01
Emerging targeters after IT
0 1 2 3 4 5 6 −0.01 −0.005 0 0.005 0.01
Emerging nontargeters after 1999
0 1 2 3 4 5 6 −0.01 −0.005 0 0.005 0.01 Difference
Note : The solid line shows the impulse response to an exchange rate shock. The dashed lines indicate five standard error confidence band around the estimate. Error are generated by Monte-Carlo with 500 repetitions.
prices and account for a low exchange rate pass-through to consumer prices. In order to take into account the production and distribution channels we estimate a 7-variable VAR that includes two other price indexes : the pro-ducer price index (PPI) and the import price index (IMP). This estimation helps us to directly check the hypothesis made by Taylor who argues that in a low-inflation environment firms expect a deviation of inflation to be less persistent and would therefore less adjust its selling prices in response to an exchange rate-induced increase in the price of imported inputs.
Figures 4 and 5 display the response of the three indexes to an exchange rate shock for inflation targeting countries and non targeting countries,
res-pectively6. Figure 4 reports before-and-after comparisons for inflation
tar-geters before and after adopting inflation targeting. Figure 5 reports before-and-after comparisons for inflation nontargeters before and after 1999. In addition, figure 6 reports comparisons across the two samples of countries : inflation targeters after adopting inflation targeting are compared to nontar-geters after 1999.
Figure 4 shows that the decline in pass-through to consumer prices in emerging inflation targeters is attributable to the decline in pass-through ef-fect along the price chain. The pass-through efef-fects to all the three prices significantly falls in emerging inflation targeters after adopting inflation tar-geting to levels that are significantly different from zero.
Figure 5 shows that the increase in pass-through to consumer prices in emerging nontargeters after 1999 results from the increase in pass-through to import prices. As shown in Figure 5, before 1999, pass-through to prices in nontargeters are not significantly different from zero. While after 1999 pass-through to prices in nontargeters are significantly positive. This result (by comparing to that result in 5-variable VAR) can be interpreted as the fact that the significant increase in the pass-through to consumer prices in nontargeters after 1999 reflects the increase in the pass-through to import and producer prices in nontargeters after 1999.
Figure 6 compares the exchange rate pass-through to prices in targeters after inflation targeting to those in nontargeters after 1999. The impulse responses function in Figure 6 indicate that the exchange pass-through to import and producer prices in inflation targeting countries after the adoption of this monetary strategy is significantly higher than that in nontargeters after 1999, while the exchange pass-through to consumer prices in targeters after inflation targeting is not significantly different than that in nontargeters
6. For nontargeters sample, China and Uruguay are not included in the 7-variable VAR. We have not data on import and producer prices for China and we have not data on producer prices for Uruguay.
Figure 4 – Response of prices in emerging targeters to an exchange rate shock (7-variable VAR)
0 1 2 3 4 5 6 −0.01 0 0.01 0.02 0.03 0.04 0.05 0.06
Response of IMP before IT
0 1 2 3 4 5 6 −0.01 0 0.01 0.02 0.03 0.04
Response of IMP after IT
0 1 2 3 4 5 6 −0.03 −0.025 −0.02 −0.015 −0.01 −0.005 0 0.005 Difference 0 1 2 3 4 5 6 −0.005 0 0.005 0.01 0.015 0.02 0.025 0.03
Response of PPI before IT
0 1 2 3 4 5 6
−0.01 −0.005 0 0.005
Response of PPI after IT
0 1 2 3 4 5 6 −0.025 −0.02 −0.015 −0.01 −0.005 0 0.005 Difference 0 1 2 3 4 5 6 −0.005 0 0.005 0.01 0.015 0.02 0.025
Response of CPI before IT
0 1 2 3 4 5 6 −0.01 −0.005 0 0.005 0.01
Response of CPI after IT
0 1 2 3 4 5 6 −0.02 −0.015 −0.01 −0.005 0 0.005 0.01 Difference
Note : The solid line shows the impulse response to an exchange rate shock. The dashed lines indicate five standard error confidence band around the estimate. Error are generated by Monte-Carlo with 500 repetitions.
Figure 5 – Response of prices in emerging nontargeters to an exchange rate shock (7-variable VAR)
0 1 2 3 4 5 6 −0.01 −0.005 0 0.005 0.01
Response of IMP before 1999
0 1 2 3 4 5 6 −0.02 −0.01 0 0.01 0.02 0.03
Response of IMP after 1999
0 1 2 3 4 5 6 −0.02 −0.01 0 0.01 0.02 0.03 Difference 0 1 2 3 4 5 6 −0.01 −0.005 0 0.005 0.01
Response of PPI before 1999
0 1 2 3 4 5 6 −0.01 −0.005 0 0.005 0.01
Response of PPI after 1999
0 1 2 3 4 5 6 −0.01 −0.005 0 0.005 0.01 0.015 Difference 0 1 2 3 4 5 6 −0.01 −0.005 0 0.005 0.01
Response of CPI before 1999
0 1 2 3 4 5 6 −0.01 −0.005 0 0.005 0.01
Response of CPI after 1999
0 1 2 3 4 5 6 −0.01 −0.005 0 0.005 0.01 Difference
Note : The solid line shows the impulse response to an exchange rate shock. The dashed lines indicate five standard error confidence band around the estimate. Error are generated by Monte-Carlo with 500 repetitions.
Figure 6 – Response of prices to an exchange rate shock : targeters versus nontargeters (7-variable VAR)
0 1 2 3 4 5 6 −0.01 0 0.01 0.02 0.03 0.04
Response of IMP in ITers after IT
0 1 2 3 4 5 6 −0.01 −0.005 0 0.005 0.01
Response of PPI in ITers after IT
0 1 2 3 4 5 6 −0.01 −0.005 0 0.005 0.01
Response of CPI in ITers after IT
0 1 2 3 4 5 6 −0.02 −0.01 0 0.01 0.02 0.03
Response of IMP in NITers after 1999
0 1 2 3 4 5 6 −0.01 −0.005 0 0.005 0.01
Response of PPI in NITers after 1999
0 1 2 3 4 5 6 −0.03 −0.02 −0.01 0 0.01 0.02 0.03 Difference 0 1 2 3 4 5 6 −0.01 −0.005 0 0.005 0.01 Difference 0 1 2 3 4 5 6 −0.01 −0.005 0 0.005 0.01
Response of CPI in NITers after 1999
0 1 2 3 4 5 6 −4 −3 −2 −1 0 1 2 3 4 x 10⁻³ Difference
Note : The solid line shows the impulse response to an exchange rate shock. The dashed lines indicate five standard error confidence band around the estimate. Error are generated by Monte-Carlo with 500 repetitions.
after 1999.
By comparing the exchange rate pass-through along the price chain, the results show that the response is the largest in import prices, then in producer prices, and the least in consumer prices. This finding is consistent with those of previous results such as McCarthy (2000), Hahn (2003), Faruque (2006) and Ito and Sato (2007, 2008).
In summary, we have obtained evidence that the adoption of inflation targeting has helped to reduce the pass-through to all three price indexes from a higher level to a new level that remains significantly different from zero. By comparing targeters after the adoption of inflation targeting to nontargeters after 1999, our evidence suggests that exchange rate pass-through to import and producer prices in targeters after adoption is significantly higher than that in nontargeters after 1999, while the exchange rate pass-through to consumer prices in targeters after adoption is not significantly different than that in nontargeters after 1999.
Our evidence confirms the view that when initial credibility of emerging markets’ central banks is low, practicing inflation targeting makes their mo-netary policy more credible, and thus leads to a lower inflation environment. More specifically, in accordance with the argument made by Taylor, inflation targeting by implementing low inflation environment in emerging countries induces input-importing firms as well as retailing firms to pass through less of the exchange rate depreciation in the form of higher prices (producer prices and import prices). Hence exchange rate fluctuations lead to smaller exchange rate pass-through to domestic producer and import prices.
3.3
Variance decomposition
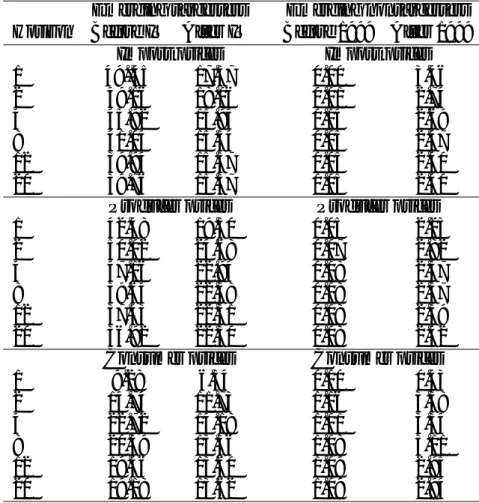
Even though impulse responses give information about the size of ex-change rate pass-through to domestic prices, they do not show how important exchange rate shocks are in explaining domestic price fluctuations. To assess the importance of exchange rate shocks for domestic prices fluctuations, we perform a variance decomposition of domestic prices. We begin by exami-ning the importance of exchange rate shocks for consumer prices by using the 5-variable VAR (Table 2). Table 2 indicates that exchange rate shocks are more important in explaining consumer prices fluctuations in targeters countries. The results contained in Table 2 also show that the contribution of exchange rate shocks to consumer prices fluctuation decreases in targeting countries after they adopted inflation targeting, while it increases in nontar-geting countries after 1999. Exchange rate shocks explain (after 20 quarters) 19.40% of consumer prices forecast variance for targeting countries before they adopted inflation targeting. This percentage declines to 11.03% after
the adoption of inflation targeting. In nontargeting countries, exchange rate shocks explain (after 20 quarters) 0.92% of consumer prices variability before 1999, and, this percentage increases to 6.39% after 1999.
Table 2 – Percentage of consumer prices forecast variance attributed to
exchange rate shocks (5-variable VAR)
Emerging targerters Emerging nontargerters
Horizon Before IT After IT Before 1999 After 1999
1 9.52 5.47 0.00 3.69 2 15.36 10.42 1.01 6.78 4 22.78 12.28 0.88 6.39 8 20.39 11.33 0.89 6.50 12 19.55 11.11 0.91 6.40 20 19.40 11.03 0.92 6.39
Table 3 displays the contribution of exchange rate shocks in explaining the fluctuations of all three price indexes using the 7-variable VAR. The results in Table 3 indicate that exchange rate shocks are more important to explain the fluctuations of all three indexes in targeters countries, while the contribution of exchange rate shock to the fluctuations in price indexes in nontargeters countries is insignificant. The percentage of price forecast variance attributed to exchange rate shocks declines in targeting countries after they adopted inflation targeting, while it slightly increases in nontarge-ters after 1999. In targenontarge-ters before they adopted inflation targeting exchange shocks explain (after 20 quarters) 39.76%, 36.92% and 19.18% of the variance of import prices, producer prices and consumer prices, respectively . After the adoption of inflation targeting, these percentages fall to 15.57%, 22.30% and 13.62%, respectively. In nontargeters before 1999, exchange rate shocks explain (after 20 quarters) 0.05%, 0.08% and 1.09% of the variance of import prices, producer prices and consumer prices, respectively. After 1999, these contributions are 2.40%, 2.42% and 2.94%, respectively.
In summary, the variance decomposition analysis indicates that exchange rate shocks explain an important part of prices fluctuations in targeters coun-tries, while the contribution of exchange rate shocks to the fluctuations in prices in nontargeters countries is insignificant. The variance decomposition analysis also shows that the contribution of exchange rate shocks to prices fluctuations in targeting countries declines after the adoption of inflation tar-geting. Hence the variance decomposition analysis corroborates the decline in exchange rate pass-through in targeting countries after adopting inflation targeting.
Table 3 – Percentage of prices forecast variance attributed to exchange rate shocks in emerging targerters (7-variable VAR)
Emerging targerters Emerging nontargerters
Horizon Before IT After IT Before 1999 After 1999
Import prices Import prices
1 49..45 17.57 0.00 3.46 2 49.16 18.06 0.01 2.74 4 45.92 15.94 0.04 2.69 8 41.04 15.54 0.05 2.47 12 39.94 15.57 0.05 2.40 20 39.76 15.57 0.05 2.40
Producer prices Producer prices
1 42.48 19.50 0.05 2.23 2 50.02 24.68 0.07 2.82 4 47.16 22.94 0.08 2.37 8 39.64 22.38 0.08 2.37 12 37.43 22.31 0.08 2.39 20 36.92 22.30 0.08 2.42
Consumer prices Consumer prices
1 9.28 6.34 0.00 0.43 2 14.74 11.73 1.16 3.38 4 22.72 14.18 1.01 3.34 8 20.59 13.56 1.08 3.11 12 19.46 13.60 1.09 2.95 20 19.18 13.62 1.09 2.94
4
Conclusion
In this paper, we have empirically examined the effect of the adoption of an inflation targeting strategy on the exchange rate pass-through to prices in emerging countries. To conduct this empirical study, we used panel VAR techniques using data on twenty-seven emerging countries (fifteen inflation targeters and twelve inflation nontargeters). To test for differences, we have adopted the difference-in-difference approach by comparing impulse response functions in different country samples, depending on the adoption of inflation targeting.
The adoption of inflation targeting modifies the pricing decisions in emer-ging countries in a way which is consistent with the credibility view. The adoption of inflation targeting has helped to reduce the pass-through to all
three price indexes that we considered (import prices, producer prices and consumer prices) in targeting countries from a higher level to a new level that remains significantly different from zero. For nontargeters countries ex-change pass-through to all three price indexes is not significantly different zero before 1999, while after 1999 exchange rate pass-through to all the three prices is significantly different from zero. By comparing targeters after infla-tion targeting to nontargeters after 1999, our evidence suggests that exchange rate pass-through to import and producer prices in targeters after inflation targeting is significantly higher than that in nontargeters after 1999, while the exchange pass-through to consumer prices in targeters after inflation tar-geting is not significantly different to that in nontargeters after 1999. The variance decomposition corroborates these results. The variance decomposi-tion analysis indicates that the contribudecomposi-tion of exchange rate shocks to prices fluctuations in targeters countries is important, while the contribution of ex-change rate shocks to prices fluctuations in nontargeters countries is insigni-ficant. The variance decomposition analysis also shows that the contribution of exchange rate shocks to prices fluctuations in targeters countries declines after the adoption of inflation targeting.
Finally, our evidence suggests that countries experiencing high exchange rate pass-through were more prone to adopt inflation targeting in order to gain credibility, than countries with low pass-through.
References
Arelano, J. and O. Bover, 1995. “Another look at the instrumental va-riable estimation of error-components model” Journal of Econometrics 68, pp.29-51.
Ball, L. and N. Sheridan. 2003. “Does inflation targeting matter ?” .In B.S. Bernanke and M. Woodford, Editors, The Inflation-Targeting Debate, Uni-versity of Chicago Press (2005)
Bernanke, B. and F. Mishkin. 1997. “Inflation targeting : a new framework of monetary policy ?” Journal of Economic Perspectives 11, pp.97-116. Mishkin, F. and K. Schmidt-Hebbel. 2007. ”Does inflation targeting make a difference ?” National Bureau of Economic Research, NBER Working Paper 12876.
Burstein, A., M. Eichenbaum and S. Rebelo, 2002, “Why Are Rates of Infla-tion So Low After Large DevaluaInfla-tions ?” NBER Working Paper 8748, Na-tional Bureau of Economic Research.
Burstein, A., M. Eichenbaum and S. Rebelo, 2005, “Large Devaluation and the Real Exchange Rate” Journal of Political Economy 113, pp.742-784. Choudrhi, E.U. and D.S. Hakura. 2006. “ Exchange Rate Pass-Through to Domestic Prices : Does inflationary Environment matter ?” Journal of
Inter-national Money and Finance 25, pp.614-639.
Faruqee, H., 2006. “Exchange Rate Pass-Through in the Euro Area” IMF
Staff Papers 53(1), pp.63-88.
Gagnon, J.E. and J. Ihrig. 2004. “Monetary Policy and Exchange Rate Pass-through” Board of Governors of Federal Reserve System, International
Fi-nance Discussion Papers n#704.
Gon¸calves, C. E. S. and J. M. Salles. 2008. “Inflation targeting in emerging economies : What do the data say ?” Journal of Development Economics 85, pp.312-318.
Hahn, E., 2003. “Pass-Through of External Shocks to Euro Area Inflation ”
European Central Bank Working Paper, n#243.
Ito, T. and K. Sato 2007. “Exchange Rate Pass-Through and Domestic In-flation : A comparison between East Asia and Latin American Countries” Research institute of Economy, Trade and Industry, RIETI Discussion
Pa-pers n#07040.
Ito, T. and K. Sato. 2008. “Exchange Rate Changes and Inflation in Post-Crisis Asian Economics : VAR Analysis of Exchange Rate Pass-Through”
Journal of Money, Banking and Credit 40 (7), pp. 1407-1438
Love, I., 2001. Estimating Panel-Data Autoregressions, Package of Programs for Stata. Columbia University, Mimeo.
invest-ment behavior : Evidence from a panel VAR” Quarterly Review of Economics
and Finance 46, pp.190-210.
Maddala, G.S. and S., Wu, 1999. “A Comparative Study of Unit Root Tests With Panel Data and A New Simple Test” Oxford Bulletin of Economics and
Statistics 61, pp. 631-652.
McCarthy, J., 2000. “Pass-Through of Exchange Rates and Import Prices to Domestic Inflation in Some Industrialized Economies” Federal Reserve Bank
of New York Staff Reports n#111, .
Svensson, L.E. 1997. “Inflation forecast targeting : implementing and moni-toring inflation targets” European Economic Review 41, pp.111-146.
Taylor, J., 2000. “ Low Inflation, Pass-Through, and the Pricing Power of Firms” European Economic Review 44, pp.1389-1408.
Appendix
.1
Countries in the sample
Emerging inflation targeters and adoption date of inflation targeting : Brazil (1999 :Q2), Chile (1991 :Q1), Colombia (1999 :Q4), Czech Re-public (1997 :Q4), Hungary (2001 :Q2, Indonesia (2005 :Q3), Israel (1991 :Q4), Mexico (1998 :Q4), Peru (1999 :Q3), Philippines (1999 :Q3), Poland (1998 :Q3), South Africa (2001 :Q1), South Korea (1997 :Q4), Thailand (2000 :Q2), Turkey (2006 :Q1).
Emerging inflation nontargeters : Argentina, Bulgaria, China, Estonia,
India, Latvia, Lithuania, Malaysia, Singapore, Taiwan, Uruguay, Vene-zuela.
.2
Variable and their sources
The world oil price : The US dollar-basis oil price index that is an average
of the three spot price index of Texas, U.K. Brent and Dubai. The world oil price is seasonally adjusted using the Census X12 method. Data source : IMF, International Financial Statistics (henceforth, IFS).
The output gap : The output gap is generated by applying the
Hodrick-Prescott (HP) filter to eliminate a strong trend in the seasonally adjus-ted real gross domestic product (GDP). If the original GDP series is not adjusted, series is seasonally adjusted using the Census X-12 method. The quarterly data are collected using Datastream. The data sources depending on the countries are the following :
Argentina : GDP volume index (2000=100), IMF’s International Fi-nancial Statistics (IFS)
Brazil : GDP volume index (1995=100) (seasonally adjusted), Instituto Brasileiro de Geografia e Estatistica (IBGE) (Brazil).
Bulgaria : GDP volume index, IFS.
Chile : GDP at 2003 prices (seasonally adjusted) Banco Central de Chile
China : GDP at current price (from IFS) divided by CPI.
Colombia : GDP at 2000 prices (seasonally adjusted), National Admi-nistrative Department of Statistics (Colombia).
Czech Republic : GDP at 2000 prices, (seasonally adjusted), Organiza-tion of Economic Co-operaOrganiza-tion and Development (OECD).
Hungary : GDP volume index (2000=100)(seasonally adjusted),OECD. India : GDP Volume index (2005=100) (seasonally adjusted), OECD. Indonesia : GDP at 2000 prices (seasonally adjusted), OECD.
Israel : GDP at 2005 prices (adjusted series), Central Bureau of Statis-tics (Israel).
Latvia : GDP at 2000 prices, Central Statistics Bureau of Latvia (Lat-via).
Lithuania : GDP at 2000 prices (seasonally adjusted), Statistics Lithua-nia (LithuaLithua-nia).
Malaysia :GDP volume index (2000=100), IFS. Mexico : GDP volume index (2000=100), IFS. Peru : GDP volume index (2000=100), IFS.
Philippines : GDP at 1985 prices (seasonally adjusted), National Sta-tistical Coordination Board (NSCB) (Philippines).
Poland : GDP at 2000 prices (seasonally adjusted),OECD. Singapore : GDP volume index (2000=100), IFS.
South Africa : GDP at 2000 prices, (seasonally adjusted),IFS.
South Korea : GDP at 2000 prices (seasonally adjusted),OECD, (Quar-terly National Accounts).
Taiwan : GDP at 2001 prices, Directorate General of Budget, Accoun-ting and Statistics (DGBAS).
Thailand : GDP at 1988 prices (seasonally adjusted), Office of National Economic and Social Development Board (Thailand).
Turkey : GDP at 1995 prices, Eurostat.
Uruguay : GDP volume index (2005=100) (seasonally adjusted), Banco Central de Uruguay (Uruguay).
Venezuela : GDP at 1997 prices (seasonally adjusted), Banco Central de Venezuela (Venezuela).
Money supply : The data is collected using Datastream. For some
coun-tries, base money is used. For others, M1 is used. If the original series is not adjusted, series is seasonally adjusted using the Census X-12 me-thod. The data sources depending on countries are the following : Argentina : Base money,IFS.
Brazil : Base money, (seasonally adjusted), IFS. Bulgaria : Money M1 (Banking Survey), IFS. Chile : Money M1, IFS.
China : Money Supply, People Bank of China. Colombia : Money M1 (Banking Survey), IFS. Czech Republic : Money M1 (Banking Survey), IFS.
Estonia : Money M1 (Banking Survey),(seasonally adjusted), IFS. Hungary : Monetary Base, IFS.
India : Money M1 (Banking Survey), IFS.
Indonesia : Money M1 (Banking Survey) (seasonally adjusted), IFS. Israel : Money M1 (seasonally adjusted), IFS.
Latvia : Money M1 (Banking Survey) (seasonally adjusted), IFS. Lithuania : Money M1 (Banking Survey) (seasonally adjusted), IFS. Malaysia :Money M1, (seasonally adjusted), IFS.
Mexico : Money M1 (Banking Survey) (seasonally adjusted), IFS. Peru : Money supply, IFS.
Philippines : Money M1 (Banking Survey) (seasonally adjusted), IFS. Poland : Money M1, IMF, International Financial Statistics (IFS). Romania : Money M1 (Banking Survey) (seasonally adjusted), IFS. Singapore : Money M1 (Banking Survey) (seasonally adjusted), IFS. South Africa : Money M1, IFS.
South Korea : Money M1 (seasonally adjusted), IFS. Taiwan : Money supply, Bank Central of China. Thailand : Money M1 (Banking Survey), IFS.
Turkey : Money M1 (Banking Survey) (seasonally adjusted), IFS. Uruguay : Money M1 (Banking Survey)(seasonally adjusted), IFS. Venezuela : Money M1 (Banking Survey)(seasonally adjusted), IFS.
Exchange rate : The data is collected using Datastream. The period
ave-rage bilateral nominal exchange rate vis-`a-vis the US dollar are used. For all countries, expected Taiwan, the data is taken from IMF’s IFS. For Taiwan the data is taken from IFO World Economic Survey (WES).
Consumer Prices Index : The data is collected using Datastream. For all
countries expected China the consumer price index (2000=100) is ta-ken from IMF, International Financial Statistics (IFS). For china, the monthly CPI taken from EOCD is used to construct the quarterly CPI. All series are seasonally adjusted using the Census X-12 method.
Import Prices Index : The data is collected using Datastream. The
im-port prices index are expressed in home currency. All series are seaso-nally adjusted using the Census X-12 method. The data sources depen-ding on countries are the following :
dol-lar (2000=100) taken from IFS multiplied by the exchange rate. Brazil : The import price index is the import unit value in US dollar (2000=100) taken from IFS multiplied by the exchange rate.
Bulgaria : The quarterly series of import price index is constructed by dividing the total import value by the total import volume (1995 prices). The import value and the import volume are taken from Na-tional Statistics Institute (Bulgaria) and Eurostat, respectively.
Chile : Import Price Index (2003=100), Banco Central de Chile (Chile). Colombia : The import price index is the import unit value in US dol-lar (2000=100) taken from IFS multiplied by the exchange rate. Czech Republic : Import Price Index (2005=100), Czech Statistical of Office. Estonia : The quarterly series of import price index is constructed by dividing the total import value by the total import volume (2000 prices) Statistics Estonia. The data are taken from Statistics Estonia (Esto-nia).
Hungary : The import price index is the import unit value in US dollar (2000=100) taken from IFS multiplied by the exchange rate.
India : The quarterly series of import price index is constructed by di-viding the total import value by the total import volume (1990 prices). Data are taken from OECD.
Indonesia : The quarterly series of import price index is constructed by dividing the total import value by the total import volume (2000 prices). Data are taken from EOCD.
Israel : The import price index is the import unit value in US dollar (2000=100) taken from IFS multiplied by the exchange rate.
Latvia : The import price index is the import unit value in US dollar (2000=100) taken from IFS multiplied by the exchange rate.
Lithuania : The quarterly series of import price index is constructed by dividing the total import value by the total import volume (2000 prices). The data are taken from Statistics Lithuania.
Malaysia : The quarterly series of import price index is constructed by dividing the total import value by the total import volume (2000 prices). The data are from Department of Statistics (Malaysia).
Mexico : The quarterly import price index is constructed by the monthly import price index (1980=100) taken from Banco de Mexico (Mexico). Peru : The quarterly import price index is constructed by the average monthly import price index (1994=100) taken from Banco Central Re-serva (Peru).
Philippines : The import price index is the import unit value in USdol-lar (2000=100) taken from IFS multiplied by the exchange rate. Poland : The import price index is the import unit value in US dollar
(2000=100) taken from IFS multiplied by the exchange rate.
Singapore : The import price index is the import unit value in US dol-lar (2000=100) taken from IFS multiplied by the exchange rate. South Africa :The import price index is the import prices index in US dollar (2000=100) taken from IFS multiplied by the exchange rate. South Korea : The import price index is the import unit value in US dollar (2000=100) taken from IFS multiplied by the exchange rate. Taiwan : The quarterly import price index is constructed by the ave-rage monthly import price index (manufactruing goods) (2001=100) taken from Directorate General of Budget, Accounting and Statistics (DGBAS).
Thailand :The import price index is the import unit value in US dollar (2000=100) taken from IFS multiplied by the exchange rate.
Turkey :The import price index is the import unit value in US dollar (2000=100) taken from IFS multiplied by the exchange rate.
Venezuela : The import price index is the import unit value in US dol-lar (2000=100) taken from IFS multiplied by the exchange rate.
Producer Prices Index : The data is collected using Datastream. For all
countries expected Taiwan and Turkey, the producer prices index are taken form IFS. For Taiwan the quarterly producer prices index are the average monthly output prices index (2006=100) taken from Taiwans Directorate General of Budget, Accounting and Statistics. For Turkey the quarterly data are taken from Turkeys National Institute of Statis-tics.