HAL Id: cea-02615745
https://hal-cea.archives-ouvertes.fr/cea-02615745
Submitted on 25 May 2020
HAL is a multi-disciplinary open access archive for the deposit and dissemination of sci-entific research documents, whether they are pub-lished or not. The documents may come from teaching and research institutions in France or abroad, or from public or private research centers.
L’archive ouverte pluridisciplinaire HAL, est destinée au dépôt et à la diffusion de documents scientifiques de niveau recherche, publiés ou non, émanant des établissements d’enseignement et de recherche français ou étrangers, des laboratoires publics ou privés.
Method for detecting and characterising
actinide-bearing micro-particles in soils and sediment of
the Fukushima Prefecture, Japan
Hugo Jaegler, Fabien Pointurier, Yuichi Onda, Jaime Angulo, Nina Griffiths,
Agnès Moureau, Anne-Laure Faure, Olivier Marie, Amélie Hubert, O. Evrard
To cite this version:
Hugo Jaegler, Fabien Pointurier, Yuichi Onda, Jaime Angulo, Nina Griffiths, et al.. Method for detecting and characterising actinide-bearing micro-particles in soils and sediment of the Fukushima Prefecture, Japan. Journal of Radioanalytical and Nuclear Chemistry, Springer Verlag, 2019, 321 (1), pp.57-69. �10.1007/s10967-019-06575-w�. �cea-02615745�
A methodology for detecting and characterising actinide-bearing
micro-1particles in soils and sediment of the Fukushima Prefecture, Japan
23
Hugo Jaegler1, Fabien Pointurier2, Yuichi Onda3, Jaime F. Angulo4, Nina M. Griffiths4, Agnes
4
Moureau4, Anne-Laure Faure2, Olivier Marie2, Amélie Hubert2 & Olivier Evrard1*
5
6
1Laboratoire des Sciences du Climat et de l’Environnement, LSCE/IPSL, Unité Mixte de
7
Recherche 8212 (CEA-CNRS-UVSQ), Université Paris-Saclay, F-91198 Gif-sur-Yvette, France 8
2CEA, DAM, DIF, F-91297 Arpajon, France
9
3Center for Research in Isotopes and Environmental Dynamics (CRIED), University of Tsukuba,
10
Tsukuba, Japan 11
4Laboratoire de Radio Toxicologie, CEA, Université Paris-Saclay, 91297 Bruyères-le-Châtel,
12
France 13
14
(*) Corresponding author (email address: olivier.evrard@lsce.ipsl.fr). 15
16
Abstract:
17
The Fukushima Dai-ichi Nuclear Power Plant (FDNPP) accident released limited amounts of 18
actinides on soils of Japan. Characterisation of these particles is essential to determine the fate 19
of actinides in the environment. The method presented in this paper, based on α-tracks 20
detections, microscope observations and mass-spectrometry measurements, was designed to 21
identify and characterize actinide-bearing particles in soil samples. The method was tested on a 22
road dust sample collected in the main radioactive plume of the Fukushima region. Accordingly, 23
α-tracks detection was demonstrated to provide a powerful technique to localise these particles 24
and prepare their morphological, elemental and isotopic characterization. 25
26
Keywords
27
Fukushima Dai-ichi Nuclear Power Plant accident; actinide-bearing particles; Solid State Nuclear 28
Track Detector; microscope characterisation; mass spectrometry 29
30
Introduction
31
Most radionuclides released into the environment during the Fukushima Dai-ichi Nuclear Power 32
Plant (FDNPP) accident were activation or fission products, like radioiodine or radiocesium. In 33
contrast, the estimated releases of uranium and plutonium emitted in the atmosphere were 34
comparatively very low [1]. Therefore, only trace amounts of plutonium [2–4] and uranium [1, 35
5–8] isotopes from the nuclear fuel have been detected in environmental samples collected in 36
the vicinity of the power plant. 37
38
It has been shown that actinides released by nuclear events like atmospheric tests [9], nuclear 39
weapon accidents [10, 11] and more recently the Chernobyl accident [12] are at least in part 40
contained in microparticles. After the FDNPP accident, several authors investigated the 41
occurrence of radioactive microparticles, and successfully detected cesium-rich microparticles in 42
the environment [13–15]. These microparticles were identified from 137Cs gamma emission
43
using gamma-imaging plates. However, when detected, uranium was a minor constituent of 44
these particles [16–18]. Actinide-bearing microparticles do not necessarily contain fission 45
products, because actinide and fission products are characterised by different levels of volatility 46
and melting points. Actinide-bearing particles therefore are not necessarily detectable with 47
gamma-radiography. Following the FDNPP accident release of plutonium particles was 48
suspected [19, 20] and the emission of uranium particles was confirmed [16, 21]. The post-49
accidental fate of these actinides is strongly influenced by several factors including the size, the 50
geometry, the microstructure and the different elemental (i.e. in other chemical elements than 51
actinides) and molecular composition of these particles. These characteristics require 52
investigation as they will influence the dissolution, the mobilization, the transport or the 53
retention processes affecting the actinides [9]. 54
55
Since uranium and plutonium were already present in the environment before the FDNPP 56
accident, as a result of the global fallout associated with atmospheric nuclear weapon tests, the 57
source of these actinides need to be carefully investigated [22]. Furthermore, compared with 58
the very low additional input of FDNPP-derived uranium, naturally-occurring uranium is found at 59
concentrations ranging around 1.9 ± 1.2 µg/g , 2σ in the Japanese soils ( [23, 24]). These sources 60
of uranium are characterised by different isotopic compositions, mainly for 235U and 238U.
61
Moreover, the measurement of 236U – a minor uranium isotope - may also provide a strong
62
indicator of the anthropogenic source of uranium [1, 25], as the 236U/238U isotope ratio provides
63
a very good discrimination between different sources of uranium [6]. Measurements of these 64
isotope ratios were mainly performed by “bulk” analyses [1, 5–8]. The characterisation of 65
FDNPP-derived uranium particles deserves isotopic analyses atthe particle scale. 66
67
To the best of our knowledge, Imoto et al. [15] are the only authors who determined uranium 68
isotope ratios based on Secondary Ion Mass Spectrometry (SIMS) measurements in three 69
caesium-containingmicroparticles extracted from paddy soil and gravel located below 70
drainpipes from the Fukushima region. They identified the source of uranium in these particles 71
showing an isotopic ratio 235U/238U value close to 0.03 ± 0.003 (compared to 0.0072 in natural
72
uranium), which is characteristic of enriched nuclear fuel. They thereby demonstrated that 73
these particles were composed of uranium from FDNPP. However, these particles were 74
detected with gamma-imaging plates, which does not allow the detection of particles with 75
uranium as a major component. To do so, nuclear track radiography provides a more 76
appropriate screening method to identify selectively uranium particles, when analysing a soil 77
sample or another type of powder sample composed of large amounts of any type of particles. 78
79
Nuclear track radiography has been used in numerous studies [26, 27], mainly in those 80
investigations conducted after the Chernobyl accident [9, 28–30], to identify and extract “hot” 81
radioactive particles from soil samples. These experiments consist in positioning a contaminated 82
sample in close contact with a Solid State Nuclear Track Detector (SSNTD). When emitted by 83
radionuclides contained in the particles, α-particles generate damage on the SSNTD located just 84
above the particle, leaving characteristic tracks (the so-called α-tracks) with well-known star-85
shapes whose centre is located just above the α-emitting particle. 86
The current research was conducted on a road dust sample, also referred to as “black 88
substance”, in order to maximize the probability to detect anthropogenic particles. Indeed, after 89
the FDNPP accident, several studies [1, 8] were performed on this type of material, which is 90
composed of aerosol and tyre particles, asphalt and environmental residues including soil and 91
lichen debris. “Black substances” are accumulated on the sides of the roads as a result of wind 92
and water erosion, and were shown to contain particularly high concentrations of radionuclides. 93
In previous studies [1, 8], this type of material was analysed using “bulk” analytical methods to 94
characterise uranium and plutonium isotope ratios, i.e. without focusing the investigations on 95
individual actinide-bearing micro particles. 96
97
To meet this goal a preliminary study was carried out in order to check the occurrence of µm-98
sized actinide-bearing particles in a powder sample. Then, we developed a new methodology 99
for the detection and isolation of these particles.The elemental, morphological and isotopic 100
characterisation of these particles was finally performed together with the isotope analyses on 101
these µm-sized particles. The overall objective of this work was therefore to develop an 102
innovative method for the detection and characterisiation of actinide-bearing micro-particles 103
found in environmental samples contaminated with the radioactive fallout associated with the 104 FDNPP accident. 105 106
Methodology
107 108Sampling 109
110
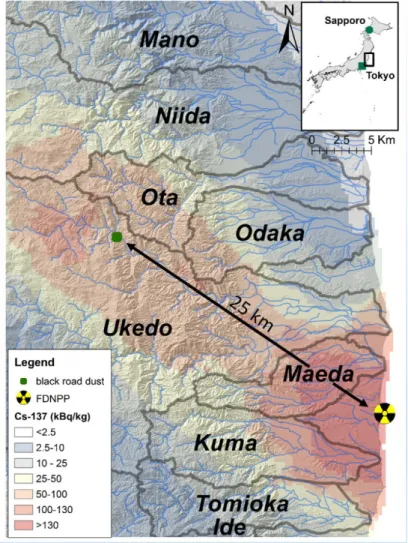
The “black substance” sample was collected in November 2015 in the Ukedo River catchment 111
along a road located in the main radioactive plume, approximately 25 km to the northwest of 112
FDNPP (GPS coordinates: N 37.553371; E 140.834940, see Fig. 1) in the Namie Municipality. The 113
emitted radiation dose measured at the sampling location with a radiameter (LB123 D-H10, 114
Berthold Technologies) exceeded 100 µSv h-1 at 1-cm distance from the soil surface.
115
116
117
Fig. 1 Location of the sampling site of the road dust sample within the main radioactive pollution plume of
120
Preliminary study: sample screening by means of Scanning Electron Microscopy and Energy-121
Dispersive X-ray spectrometry 122
123
The goal of this preliminary study was to check the presence of actinide particle in sub-samples, 124
so as to confirm that the collected sample was appropriate for the implementation of the 125
developed methodology. For this purpose, samples were directly analysed by Scanning Electron 126
Microscopy (SEM) and Energy-Dispersive X-ray spectrometry (EDX). Observations by SEM (FEI 127
Quanta 3D FEG, Eindhoven, The Netherlands) were conducted in the low vacuum mode (60 Pa) 128
to allow the analysis of non-conductive materials, with the use of backscattered electron 129
detectors on a wide field (approximately 500 µm by 500 µm). This allows the detection of the 130
particles with a density higher than an average atomic number of 20 with the chosen analytical 131
parameters (detection size limit is 0.55 µm for uranium particles), which likely corresponds to 132
radioactive particles. Among the detected particles, only those identified as “uranium particles” 133
(i.e. those for which uranium was the major constituent) were analysed individually by EDX 134
spectroscopy (EDAX Apollo SDD 10 mm2) for chemical characterisation. Due to the low
135
abundance of plutonium in nuclear fuel (both irradiated UO2 and MOX) compared to that of
136
uranium, it is very unlikely to detect directly plutonium in particles. Accordingly, only those 137
particles in which uranium is a major constituent were initially targeted by these experiments. 138
139
In this preliminary experiment, two milligrams of the sample were randomly collected with 140
Sticky Carbon Tapes (SCT, n=14) dabbed onto walls of the vials containing the road dust sample. 141
SCTs consist of double sided carbon-based electrically conductive and non-porous adhesive 142
mounted on an aluminum holder, which is a suitable support for SEM and EDX analyses. 143
Accordingly, SCTs were directly analysed by SEM and EDX following a three-step process: i) 144
automated search for particles with high average atomic numbers, including particles for which 145
uranium is the major constituent, using the Gun Shot Residue (GSR) software. This software also 146
provides an EDX spectrum and indicates the major elemental constituents of the detected 147
particles; ii) more precise EDX spectrum for each particle identified as ‘uranium-particle’ with a 148
longer acquisition time (one minute instead of a few seconds) to confirm the presence of 149
uranium as a major constituent and to identify minor constituents (i.e. with concentrations 150
above 1%); iii) high resolution imaging of the detected actinide particles with high 151
magnification. 152
153
In previous studies, uranium was shown to be associated with Zn-Fe oxide [15] or trapped in 154
spherical SiO2 particles [14], so that the occurrence of particles of Fe and Zn or spherical
155
particles of Si were also investigated in order to verify the possible presence of uranium and Cs 156
as minor constituents in these particles. 157
158
Nuclear track autoradiography to isolate actinide-bearing particles 159
160
Following investigation of the occurrence of actinide-bearing particles in the sample, the 161
difficulty of micro-particle transfer from the SCTs to carbon plate to conduct isotopic 162
measurements led to the development of a second screening method. To this end, the 163
detection and the isolation of actinide-bearing particles were performed through alpha-164
autoradiography using a Solid-State Nuclear Track Detector (SSNTD). 165
166
The SSNTD used in the current study was the Tastrak™ detector (TASL, Ltd, Bristol, UK) with a 167
density of 1.30 g/cm3, a thickness of 500 µm and a cut-off angle of 20° for alpha particles. A key
168
point for α-track autoradiography is the measurement of the yield of the experiments, as it 169
determines the capability of the SSNTD to record the activity of particles. We experimentally 170
estimated the yield through by the deposition of different concentrations of a 242Pu solution
171
(Plutonium-242 Radioactivity Standard, Standard Reference Material 4334I, National Institute of 172
Standards & Technology, CERCA-LEA, F 26701 PIERRELATE cedex; www.lea-cerca.com) on a 173
rough filter to simulate the particulate nature of the sample. The SSNTD was put in close contact 174
with the filter that was protected by mylar foil (3.5 µm thickness) during 6, 10 and 11 weeks. 175
Thenumbers of α-tracks on the SSNTD were counted by microscopy observation using a ccd 176
camera piloted by Archimed (version 7.0.10) and the number of tracks quantified using Histolab 177
(version 8.0.10) form Microvision instruments, (Lisses, France; https://www.microvision.fr). The 178
number of tracks allowed to calculate the activity and to compared it with the activity of the 179
strandard reference solution. The experimental yield cannot exceed 50 %, as only half of the α-180
particles are emitted upwards and will therefore impact the SSNTD. Moreover, alpha-particles 181
are subject to self-attenuation within the particle and in the bulk sample, which will significantly 182
reduce the yield factor. We estimated the yield of the α-track experiments to be 30 % of the 183
242Pu certified solution. Accordingly, the yield correction factor (𝜂) was set to 0.3 in the
184
calculations. This value is in good agreement with those found in the literature [26]. 185
186
With regard to the road dust sample, a thin sample layer of dust was deposited on square 187
polycarbonate support plates (n = 90) with collodion to ensure a perfect immobilisation of the 188
sample during experiments. Sample support plates and SSNTD were welded and pierced 189
together in order to provide coordinates in order to locate of α-emitting particles for isolation. 190
Tastrak SSTND was positioned in close contact with the sample during 2, 4 and 6 months. 191
Twenty SSNTD plates were revealed and observed after 2 months, then twenty additional plates 192
after 4 months and, finally, fifty plates after 6 months. At the end of each experiment, SSNTD 193
was etched in a 6 M NaOH solution at 80°C during 1 h. Tracks were observed by optical 194
microscopy. After localisation of track clusters, SSNTD and plates were separated and α-195
emitting particles were localised using the coordinates on both SSNTD and plates. The support 196
plates containing the α-emitting particles were then analysed by SEM and EDX, using the same 197
methodology as described for the preliminary experiments (see section ‘Sample screening by 198
means of SEM/EDX’). 199
200
The number of α-tracks per cluster was used to estimate the activity of the corresponding 201
particle. It was hypothesized that: 1) all α-emitters had the same yield, 2) the samples were 202
assumed to be composed of the following three proportions of actinides: 203
204
Composition 1: natural uranium ore with 99.3 % of 238U, 0.720 % of 235U and 0.005 % of
205
234U, which contains also α-emitter daughter nuclides of 235U and 238U - 234U decay chains
206
(devoid of plutonium); 207
Composition 2: nuclear fuel composition at the moment of the accident in reactor 1 [31], 208 with 97.5 % of 238U, 1.66 % of 235U, 3.10×10⁻⁴ % of 234U, 0.455 % of 239Pu and 0.157 % of 209 240Pu ; 210
Composition 3: MOX fuel with 2.5 % of plutonium (80 % of 239Pu and 20 % of 240Pu) and
211
97.5 % of uranium (98 % of 238U, 2 % of 235U and 0.01 % of 234U) (Reactor 3);
212
Composition 4: natural uranium with 99.3 % of 238U, 0.720 % of 235U and 0.005 % of 234U,
213
which contains also α-emitting daughter radionuclides from 235U and 238U - 234U decay
214
chains and global fallout plutonium (estimation of 239Pu and 240Pu abundances based on
215
the 239Pu concentrations measured in Japan [32])
216
217
Then, the number of atoms of actinide in the particle (nact) was estimated based on the number
218
of α-tracks recorded on the SSNTD (nα-tracks) divided by the yield η, the time t (in second), 𝑎𝑖 the
219
atomic abundances of the α-emitter isotope i (which is an isotope of uranium or plutonium), 220
and the 𝜆𝑖 the decay constant of α-emitter i (which is an isotope of uranium or plutonium) as in
221 Eq. (1). 222 nact= nα-tracks η × Δt × ∑ (𝑎𝑖 𝑖× 𝜆𝑖) (1) 223
The equivalent diameter 𝜙 of the particle (assumed to be spherical and made of UO2) is
224
therefore calculated as in Eq. (2) [33]. 225
𝜙 = √ 6 × nα-tracks× 𝑀𝑈𝑂2
𝜋 × 𝜌 × 𝒜 × 𝜂 × Δt × ∑ (𝑎𝑖 𝑖× 𝜆𝑖)
3 (2)
Where 𝒜 is the Avogadro Number, 𝜌 the density of UO2 (10.97 g/cm3), 𝑀𝑈𝑂2 the molar mass of
227
UO2 (270 g/mol).
228
229
Secondary Ion Mass Spectrometer measurements 230
231
SIMS measurements were performed to determine the isotopic composition of the particles. 232
Prior to SIMS analysis, a small part of the polycarbonate plate (square shape, 5 mm side) was 233
cut around the theoretical position of the uranium-bearing particle. These subsamples that 234
were assumed to include the particle were dissolved in ethanol overnight and deposited on a 235
carbon plate with PolyIsoButylen acting as a sticking agent. Samples were heated in a furnace at 236
400°C for 30 min to evaporate the liquid deposition and eliminate any organic residue. 237
238
Details on SIMS function have been described elsewhere [34]. In brief, the SIMS instrument is a 239
double focusing instrument (Cameca IMS 7f, Gennevilliers, France) equipped with a 240
duoplasmatron (O2+) source. This primary beam was accelerated to 15 keV, whereas the
241
secondary ion beam was acccelerated to 5 keV. The mass resolving power was set to 450 in 242
order to obtain flat-top peak. An Automatic Particle Measurement (APM) software allows the 243
efficient detection of uranium particles, through the acquisition of ion images of 238U+ in a series
244
of 500 µm × 500 µm fields over the entire carbon plate. Ion images at m/z=233 and 234 were 245
also recorded and used as indicators of isobaric interference levels in the sample. After APM 246
data acquisition, microbeam measurements were performed on the selected individual particle. 247
234U+, 235U+, 236U+ and 238U+ isotopic intensities were measured to determine precisely the
uranium isotopic compositions. Mass bias of these measurements was corrected through the 249
measurement of certified particles, and the 236U signal was corrected from 235UH species. Ion
250
images of 235U+ and 238U+ were also acquired for visualizing the particle. In order to investigate
251
the potential presence of plutonium isotope in the particle, a mass scan was also performed 252
from 238U to 242Pu masses.
253
254
Results and discussion
255
256
Sample screening by means of SEM/EDX 257
258
Four uranium particles were detected by SEM from the 14 analysed SCTs used to collect sub-259
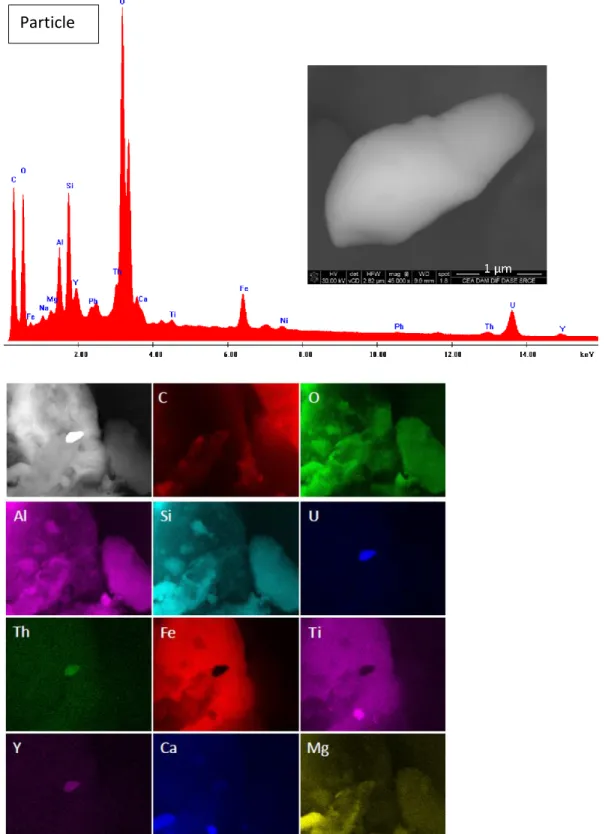
samples of the road dust sample. Pictures of the particle 1 (photography, EDX spectra and 260
elemental mappings) are presented in Fig. 2; pictures of the 3 other particles are provided in 261
Supplementary Information (Fig. S1 – S3). The size of these particles ranged from 2 to 3 µm. In 262
addition to uranium, these particles mainly contained C, O, Al, Si, U and Fe. Traces of Na, Mg, Y, 263
Pb, Th, Ca, Ti, Co and Ni were also detected by EDX. However, no trace of Cs, Zn or Pu was 264
detected, with detection limits of 1%. 265
266
267
Fig. 2 Electronic image, EDX spectrum and elemental mapping of the particle #1 identified as an U-bearing particle.
268
The mapping shows qualitatively that some elements (C, O, Al, Si, Fe, Ti) detected in the EDX spectrum may come 269
Particle
from surrounding particles, whereas Y, Th, Ca and Mg are obviously present in the particle. This is an indication that 270
this U-bearing particule may be of natural origin 271
272
This preliminary study confirms the presence of uranium particles in the samples collected in 273
the vicinity of the FDNPP. Caesium and plutonium, if present are in very low amounts that 274
arebelow the EDX detection limits (approximately 1%). However, EDX analyses do not allow the 275
determination of the source of these uranium particles (FDNPP or naturally-occurring). Further 276
analyses, including isotopic measurements, were required to confirm the sources of these 277
particles. Unfortunately, the direct isotope analysis by SIMS on SCTs is not possible (because of 278
the melting of the conductive glue under the primary ion beam). Moreover, the micro-sampling 279
of particles, which would be required to deposit them on a support material suitable for SIMS 280
analysis (i.e. perfectly plane and conductive), is not possible on SCTs. Also, the automatic search 281
of particles by means of GSR software is very time-consuming and ineffective for analysis of 282
relatively large amounts of sample (at least a few mg). Accordingly, nuclear track 283
autoradiography experiments were performed to increase the quantity of analysed material and 284
to conduct both morphological and elemental analyses by SEM/EDX, and isotope analysis by 285
SIMS on the detected α-emitting particles. 286
287
Lastly, 9 FeZn particles were also analysed. Their sizes ranged from 3.5 µm to 20 µm. Their 288
shape was also heterogeneous: some particles were sharp and rough, while others were 289
completely spherical (see examples provided on Fig. S4). They were mainly composed of C, O, 290
Al, Si, Fe and Zn. Trace amounts of Na, Mg, P, S, K, Ca, Ti, Mn and Cu were also detected. 291
However, no trace of Cs, Pu and U could be detected in these particles. 292
293
It should be noted that many spherical Si particles were observed. Twenty of these were 294
analysed (one example is provided on Fig. S5). The size of these particles ranged from 4 to 295
10 µm, and they were mainly composed of C, O, Al and Si. Traces of C, O, Na, Mg, Al, Si, S, K, Ca, 296
Ti and Mn were also detected. Again, no trace of U, Pu and Cs could be detected in these 297
spherical Si particles. 298
299
α-track autoradiography experiments or Solid-State Nuclear track Detector experiments 300
301
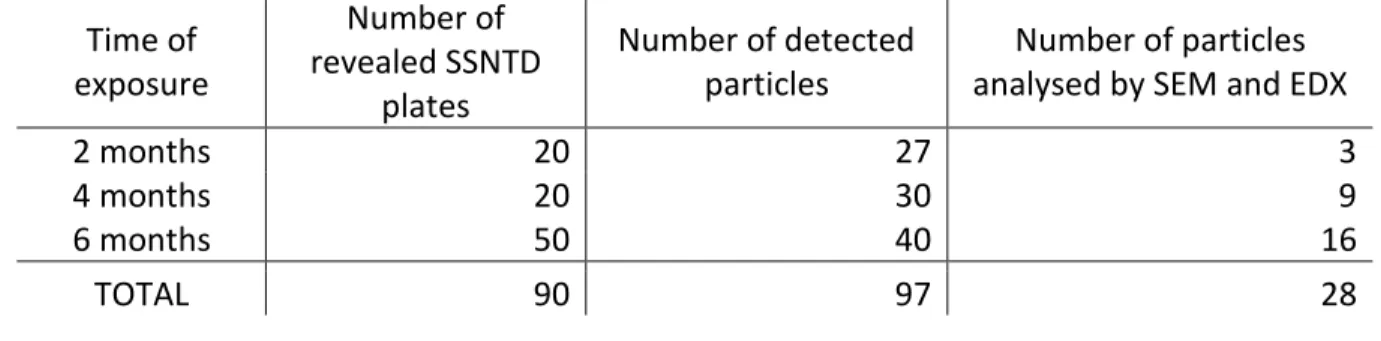
Of the 90 prepared SSNTD plates, 20 were revealed after 2 months of exposure, 20 were 302
revealed after a 4-month exposure and the last 50 after a 6-month exposure. The total numbers 303
of detected particles for each exposure are given in Table 1. 304
305
Table 1 Summary of particle detection and analysis after α-track radiography.
306 Time of exposure Number of revealed SSNTD plates Number of detected particles Number of particles analysed by SEM and EDX
2 months 20 27 3
4 months 20 30 9
6 months 50 40 16
TOTAL 90 97 28
307
However, most of these clusters have less than 20 α-tracks (Fig. 3, left). For example, the 308
number of detected particles after the 2-month exposure revealed that only 3 clusters were 309
composed of more than 100 α-tracks (Fig. 3, right), with 104 (particle A), 118 (particle B) and 310
162 (particle C) α-tracks recorded on the SSNTD, respectively. 311
312
313
Fig. 3 Optical images of α-tracks clusters after 2 months of exposure. Left: example of a small cluster, with less than
314
20 α-tracks. Right: example of large cluster, with more than 100 α-tracks 315
316
The size of these particles can be roughly estimated (Table 2), through the comparison of 317
potential scenarios on the composition of the particles (see the Methodology section). These 318
theoretical calculations demonstrated that, for a given activity, particles are smaller by almost 319
one order of magnitude when they contain FDNPP-derived plutonium. 320 321 322 323 324 325
Table 2 Theoretical particle sizes, based on the following hypotheses made on the composition of the particles: 1:
326
natural uranium; 2: FDNPP uranium fuel; 3: FDNPP MOX fuel ; 4 : natural uranium and global fallout plutonium (see 327
Methodology section). Particles A, B and C correspond to the three large clusters detected on the SSNTD after a 328
two-month exposure and analysed by SEM and EDX (see Table 1). 329
Composition 1 Composition 2 Composition 3 Composition 4
Particle A B C A B C A B C A B C Number of α-tracks recorded 104 118 162 104 118 162 104 118 162 104 118 162 Theoretical equivalent diameter (µm) 3.9 4.1 4.5 0.82 0.85 0.95 0.53 0.55 0.61 3.9 4.1 4.6 330 331
After 4 months of exposure, 20 other SSNTD plates were revealed and observed. 30 α-tracks 332
clusters were observed, among which 9 were particularly dense in terms of number of α-tracks 333
recorded on the SSNTD. Finally, after 6 months of exposure, the last 50 SSNTD were revealed 334
and observed: 40 α-track clusters were detected, among which 16 were particularly dense. 28 335
particles corresponding to the more α-emitting clusters identified after the 2, 4 and 6-month 336
exposure times were then observed and analysed by SEM. 337
338
SEM observation of particles 339
340
Four types of particles were observed by SEM: 1) 10 zircon particles (ZrSiO4) with sizes (apparent
341
mean diameter) ranging from 30 to 100 µm. It should be noted that α-tracks are produced by U 342
and Th isotopes that are substituted to Zr in zircon. 2) 7 particles of thorite, composed by 343
ThSiO4, (mainly 232Th, T1/2 = 1.4×10¹⁰ y) of approximately 20 µm. 3) 7 Monazite particles
344
composed by (Ce, La, Nd, Pr)PO4 with size ranging from 30 to 100 µm. Th is also present as a
345
minor constituent and detected by EDX in these particles. 4) 4 uranium particles were detected. 346
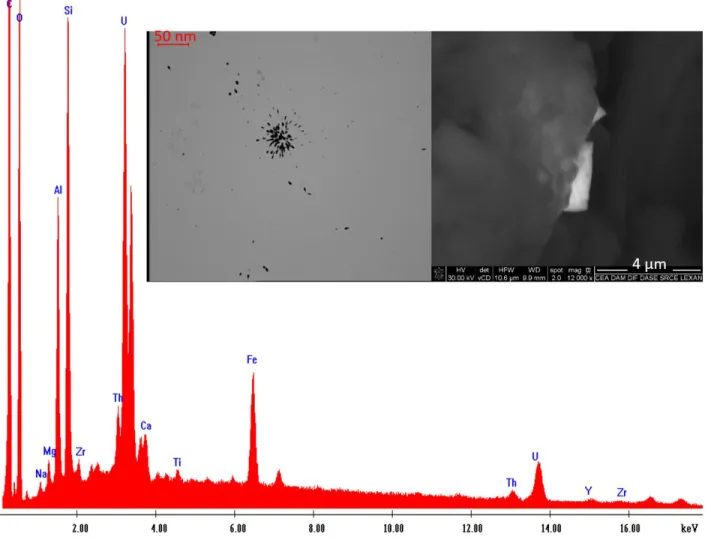
The size of these particles was estimated to approximately 4 µm for particle 1 (Fig. 4), 4 µm for 347
particle 2 (Fig. 5), 6 µm for particle 3 (Fig. 6) and 8 µm for particle 4 (Fig. 7). Th, Si, O, Fe, Al and 348
Y were also detected as minor constituents in the uranium particles. It should be noted that 349
presence of other chemical elements than uranium (Si, Fe, Al, etc.) may be due to intrinsic 350
impurities, and/or to the influence of neighbouring mineral particles which are partly included 351
in the analysed volume. In the first case, particles could be made of naturally-occurring uranium 352
or uranium from FDNPP mixed with concrete orother metals. However the presence of Th as a 353
minor constituent was detected in all four particles which provides a strong indicator for a 354
natural origin since Th is absent in the nuclear fuel but abundant in many uranium ores [35]. 355
357
Fig. 4 Optical image of α-tracks recorded on the SSNTD after a 4 month-exposure time, SEM image and associated
358
EDX spectrum for particle #1 359
Fig. 5 Optical image of α-tracks recorded on the SSNTD after a 4 month-exposure time, SEM image and associated
360
EDX spectrum for particle #2 361
Fig. 6 Optical image of α-tracks recorded on the SSNTD after a 6 month-exposure time, SEM image and associated
362
EDX spectrum for particle #3 363
364
Fig. 7 Optical image of α-tracks recorded on the SSNTD after a 6 month-exposure time, SEM image and associated
365
EDX spectrum for particle #4 366
367
Composition and origin of uranium particles 368
369
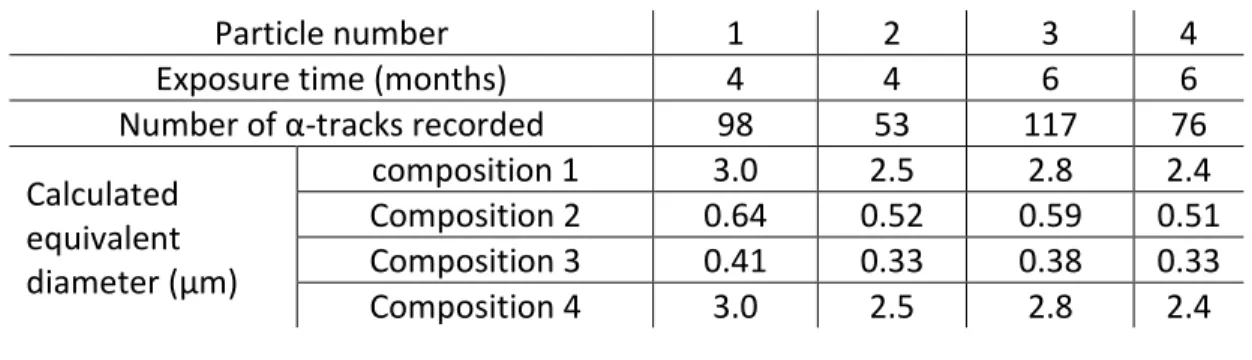
With the activities calculated according to the α-tracks recorded on the SSNTD and based on the 370
yield previously determined (about 30 %), the size (equivalent diameter) of the uranium 371
particles can be estimated. The number of α-tracks recorded on the SSNTD and the calculated 372
equivalent diameters deduced according to the four hypothetical compositions considered in 373
this study are compiled in Table 3. 374
375
Table 3 Theoretical particle sizes (equivalent diameters assuming UO2 density) of the uranium particles localized by
376
means of α-track autoradiography and characterised by SEM/EDX according to the four hypothetical compositions 377
considered in this study. 378
Particle number 1 2 3 4
Exposure time (months) 4 4 6 6
Number of α-tracks recorded 98 53 117 76 Calculated equivalent diameter (µm) composition 1 3.0 2.5 2.8 2.4 Composition 2 0.64 0.52 0.59 0.51 Composition 3 0.41 0.33 0.38 0.33 Composition 4 3.0 2.5 2.8 2.4 379
Compared with the sizes estimated based on the SEM observations (4, 4, 6 and 8 µm, 380
respectively), the results suggest that these particles did not contain FDNPP-derived plutonium, 381
as their activities would be higher or the particles would be smaller. Accordingly, this first 382
estimation suggests that the U is of natural origin. 383
384
To investigate further this issue, SIMS measurements were performed on particle 1. Other 385
particles could not be recovered after collodion dissolution and sample deposition onto graphite 386
disks. After detection by APM, an ion image was acquired (Fig. 8). The isotopic composition was 387
determined to 235U/238U = 0.00736 ± 0.00017 and 234U/238U = (5.37 ± 0.83) × 10-5, after mass bias
388
correction. These results demonstrated unambiguously that this particle contained only natural 389
uranium. Nevertheless, plutonium isotopes were investigated through the scanning of the 390
particle from 239 to 242 atomic mass units. As expected, no plutonium isotope was detected in 391
the particle (Fig. 9). Unfortunately, the very high uranium hydride formation rate (238UH+/238U+ =
392
3.10 × 10⁻³) did not allow the determination of 236U/238U for values lower than 2×10⁻⁵, and the
393
236U concentration was below the limit of detection which is compatible with
naturally-394
occurring uranium with 236U/238U isotope ratios ranged from 10-15 to 10-10 [36, 37]. To measure
395
the 236U at such low levels, other analytical techniques should be performed, such as
laser-396
ablation ICP-MS [12, 38] or Thermal Ionisation Mass Spectrometry (TIMS) [39]. 397
398
399
Fig. 8 ion images at 238U mass obtained with an O
2+ primary ion current of 250 pA and a raster size of
400
25 µm × 25 µm 401
402
403
Fig. 9 Mass spectrum on the uranium particle at the plutonium isotope masses, obtained with an O2+ primary ion
404
current of 250 pA and a raster size of 25 µm × 25 µm. Intensities at 239 atomic mass units is likely due to 238UH+
405 species 406 407
Conclusions
408 409We have developed an analytical methodology to localize and characterize the morphological, 410
elemental and isotopic compositions of α-emitting actinide bearing micro-particles. These 411
analyses were performed on road dust sample collected at 25 km form the FDNPP. Particles 412
containing α-emitting elements were deposited along with numerous mineral matrix particles 413
on polycarbonate plates, embedded in a collodion layer and covered with an SSNTD. Alpha track 414
autoradiography allowed localisation of the active particles. The presence of uranium was 415
confirmedby SEM. Thereafter they were transferred finally to a graphite disk for measurement 416
of isotope composition by SIMS analysis.. 417
418
The correlation between the numbers of α-tracks and the mean observed diameters of the 419
corresponding particles measured by SEM led to the rejection of the hypothesis of actinide-420
bearing particles released during the FDNPP accident. Twenty-eight particles chosen as the 421
strongest α-emitting ones were examined by SEM/EDX, but only four of them were pure 422
uranium particles. Only one of these particles was analysed by SIMS and showed the typical 423
isotopic composition of natural uranium. 424
425
To increase the probability for detection of FDNPP-derived actinide particles, experiments 426
should be performed using larger quantities of samples. In addition, the method for transferring 427
particles from polycarbonate plates to graphite disks for SIMS measurements should be 428
improved. This study however showed that uranium particles can be isolated efficiently from 429
environmental samples and individually analysed by SEM, EDX detector and SIMS. For future 430
analyses, direct isotope analyses could be tested on the polycarbonate plates using laser 431
ablation coupled to ICP-MS. This would avoid the need to dissolve the collodion. as well as the 432
transfer of particles onto another support material. Further measurements will be required on 433
other α-emitting particles detected in soil or road dust samples in order to detect uranium, and 434
possibly the plutonium released by the FDNPP. 435
436
Acknowledgements
437
The sample collection was supported by the AMORAD (ANR-11-RSNR-0002) project, funded by 438
the French National Research Agency (ANR, Agence Nationale de la Recherche). Hugo Jaegler 439
received a PhD fellowship from the French Atomic Energy Commission (CEA, Commissariat à 440
l’Energie Atomique et aux Energies Alternatives). The authors declare no competing financial 441
interest. 442
References
4431. Sakaguchi A, Steier P, Takahashi Y, Yamamoto M (2014) Isotopic compositions of 236U 444
and Pu isotopes in “black substances” collected from roadsides in Fukushima prefecture: 445
Fallout from the Fukushima Dai-Ichi nuclear power plant accident. Environmental Science 446
and Technology 48 (7): 3691–3697. doi: 10.1021/es405294s. 447
2. Zheng J, Tagami K, Uchida S (2013) Release of plutonium isotopes into the environment 448
from the fukushima daiichi nuclear power plant accident: What is known and what needs 449
to be known. Environmental Science and Technology 47 (17): 9584–9595. doi: 450
10.1021/es402212v. 451
3. Evrard O, Pointurier F, Onda Y et al. (2014) Novel insights into fukushima nuclear accident 452
from isotopic evidence of plutonium spread along coastal rivers. Environmental Science 453
and Technology 48 (16): 9334–9340. doi: 10.1021/es501890n. 454
4. Jaegler H, Pointurier F, Onda Y et al. (2018) Plutonium isotopic signatures in soils and 455
their variation (2011-2014) in sediment transiting a coastal river in the Fukushima 456
Prefecture , Japan. Environmental Pollution 240 167–176. doi: 457
10.1016/j.envpol.2018.04.094. 458
5. Schneider S, Bister S, Christl M et al. (2017) Radionuclide pollution inside the Fukushima 459
Daiichi exclusion zone, part 2: Forensic search for the “Forgotten” contaminants 460
Uranium-236 and plutonium. Applied Geochemistry 85 194–200. doi: 461
10.1016/j.apgeochem.2017.05.022. 462
6. Shinonaga T, Steier P, Lagos M, Ohkura T (2014) Airborne plutonium and non-natural 463
uranium from the Fukushima DNPP found at 120 km distance a few days after reactor 464
hydrogen explosions. Environmental Science and Technology 48 (7): 3808–3814. doi: 465
10.1021/es404961w. 466
7. Yang G, Tazoe H, Yamada M (2016) Determination of 236U in environmental samples by
467
single extraction chromatography coupled to triple-quadrupole inductively coupled 468
plasma-mass spectrometry. Analytica Chimica Acta 944 44–50. doi: 469
10.1016/j.aca.2016.09.033. 470
8. Yang G, Tazoe H, Hayano K et al. (2017) Isotopic compositions of 236U, 239Pu, and 240Pu in
471
soil contaminated by the Fukushima Daiichi Nuclear Power Plant accident. Scientific 472
Reports 7 (1): 13619. doi: 10.1038/s41598-017-13998-6. 473
9. Salbu B (2011) Radionuclides released to the environment following nuclear events. 474
Integrated Environmental Assessment and Management 7 (3): 362–364. doi: 475
10.1002/ieam.232. 476
10. López JG, Jiménez-Ramos MC, García-León M, García-Tenorio R (2007) Characterisation of 477
hot particles remaining in soils from Palomares (Spain) using a nuclear microprobe. 478
Nuclear Instruments and Methods in Physics Research Section B: Beam Interactions with 479
Materials and Atoms 260 (1): 343–348. doi: https://doi.org/10.1016/j.nimb.2007.02.044. 480
11. Lind OC, Salbu B, Janssens K et al. (2007) Characterization of U/Pu particles originating 481
from the nuclear weapon accidents at Palomares, Spain, 1966 and Thule, Greenland, 482
1968. Science of The Total Environment 376 (1–3): 294–305. doi: 483
10.1016/J.SCITOTENV.2006.11.050. 484
12. Boulyga SF, Prohaska T (2008) Determining the isotopic compositions of uranium and 485
fission products in radioactive environmental microsamples using laser ablation ICP-MS 486
with multiple ion counters. Analytical and Bioanalytical Chemistry 390 (2): 531–539. doi: 487
10.1007/s00216-007-1575-6. 488
13. Ikehara R, Suetake M, Komiya T et al. (2018) Novel Method of Quantifying Radioactive 489
Cesium-Rich Microparticles (CsMPs) in the Environment from the Fukushima Daiichi 490
Nuclear Power Plant. Environmental Science and Technology 52 (11): 6390–6398. doi: 491
10.1021/acs.est.7b06693. 492
14. Furuki G, Imoto J, Ochiai A et al. (2017) Caesium-rich micro-particles: A window into the 493
meltdown events at the Fukushima Daiichi Nuclear Power Plant. Scientific Reports 7 494
(42731): 1–10. doi: 10.1038/srep42731. 495
15. Imoto J, Ochiai A, Furuki G et al. (2017) Isotopic signature and nano-texture of cesium-496
rich micro-particles: Release of uranium and fission products from the Fukushima Daiichi 497
Nuclear Power Plant. Scientific Reports 7 (1): 5409. doi: 10.1038/s41598-017-05910-z. 498
16. Abe Y, Iizawa Y, Terada Y et al. (2014) Detection of uranium and chemical state analysis of 499
individual radioactive microparticles emitted from the Fukushima nuclear accident using 500
multiple synchrotron radiation X-ray analyses. Analytical Chemistry 86 (17): 8521–8525. 501
doi: 10.1021/ac501998d. 502
17. Adachi K, Kajino M, Zaizen Y, Igarashi Y (2013) Emission of spherical cesium-bearing 503
particles from an early stage of the Fukushima nuclear accident. Sci Rep. doi: 504
10.1038/srep02554 505
18. Kaltofen M, Gundersen A (2017) Radioactively-hot particles detected in dusts and soils 506
from Northern Japan by combination of gamma spectrometry, autoradiography, and 507
SEM/EDS analysis and implications in radiation risk assessment. Science of The Total 508
Environment 607–608 1065–1072. doi: https://doi.org/10.1016/j.scitotenv.2017.07.091. 509
19. Kirchner G, Bossew P, De Cort M (2012) Radioactivity from Fukushima Dai-ichi in air over 510
Europe; part 2: What can it tell us about the accident? Journal of Environmental 511
Radioactivity 114 35–40. doi: 10.1016/j.jenvrad.2011.12.016. 512
20. Schneider S, Walther C, Bister S et al. (2013) Plutonium release from Fukushima Daiichi 513
fosters the need for more detailed investigations. Sci Rep. doi: 10.1038/srep02988 514
21. Ochiai A, Imoto J, Suetake M et al. (2018) Uranium dioxides and debris fragments 515
released to the environment with cesium-rich microparticles from the Fukushima Daiichi 516
Nuclear Power Plant. Environ Sci Technol. doi: 10.1021/acs.est.7b06309 517
22. Yamamoto M, Sakaguchi A, Ochiai S et al. (2014) Isotopic Pu, Am and Cm signatures in 518
environmental samples contaminated by the Fukushima Dai-ichi Nuclear Power Plant 519
accident. Journal of Environmental Radioactivity 132 31–46. doi: 520
10.1016/j.jenvrad.2014.01.013. 521
23. Yoshida S, Muramatsu Y, Tagami K et al. (2000) Concentrations of uranium and 235U/238U
522
ratios in soil and plant samples collected around the uranium conversion building in the 523
JCO campus. Journal of Environmental Radioactivity 50 (1–2): 161–172. doi: 524
10.1016/S0265-931X(00)00075-8. 525
24. Yoshida S, Muramatsu Y, Tagami K, Uchida S (1998) Concentrations of lanthanide 526
elements, Th, and U in 77 Japanese surface soils. Environment International 24 (3): 275– 527
286. doi: 10.1016/S0160-4120(98)00006-3. 528
25. Bu W, Zheng J, Ketterer ME et al. (2017) Development and application of mass 529
spectrometric techniques for ultra-trace determination of 236U in environmental
samples-530
A review. Analytica Chimica Acta 995 1–20. doi: 10.1016/j.aca.2017.09.029. 531
26. Esaka F, Magara M (2014) Secondary ion mass spectrometry combined with alpha track 532
detection for isotope abundance ratio analysis of individual uranium-bearing particles. 533
Talanta 120 349–354. doi: 10.1016/j.talanta.2013.12.029. 534
27. Vlasova IE, Kalmykov SN, Konevnik Y V et al. (2008) Alpha track analysis and fission track 535
analysis for localizing actinide-bearing micro-particles in the Yenisey River bottom 536
sediments. Radiation Measurements 43 S303–S308. doi: 10.1016/j.radmeas.2008.04.029. 537
28. Zhuk, Lomonosova, Yaroshevich et al. (1995) Investigation of vertical migration of alpha-538
emitting nuclides in soils for southern regions of the Republic of Belarus. Radiation 539
Measurements 25 (1–4): 385–387. 540
29. Boulyga SF, Becker JS (2001) Determination of uranium isotopic composition and 236U
541
content of soil samples and hot particles using inductively coupled plasma mass 542
spectrometry. Analytical Chemistry 370 612–617. 543
30. Boulyga SF, Desideri D, Meli MA et al. (2003) Plutonium and americium determination in 544
mosses by laser ablation ICP-MS combined with isotope dilution technique. International 545
Journal of Mass Spectrometry 226 (3): 329–339. doi: http://dx.doi.org/10.1016/S1387-546
3806(03)00024-1. 547
31. Nishihara K, Iwamoto H, Suyama K (2012) Estimation of fuel compositions in Fukushima-548
Daiichi nuclear power plant (Date of access: 30/08/2018). 549
32. Kelley JM, Bond LA, Beasley TM (1999) Global distribution of Pu isotopes and 237Np. In: 550
Sci. Total Environ. pp 483–500. 551
33. Ellis WR, Wall T (1982) Use of particle track analysis to measure fissile particle size 552
distributions in contaminated soils. Nuclear Instruments and Methods in Physics Research 553
200 (2–3): 411–415. doi: 10.1016/0167-5087(82)90463-X. 554
34. Fauré AL, Rodriguez C, Marie O et al. (2014) Detection of traces of fluorine in micrometer 555
sized uranium bearing particles using SIMS. Journal of Analytical Atomic Spectrometry 29 556
(1): 145–151. doi: 10.1039/c3ja50245g. 557
35. Adams JAS, Osmond JK, Rogers JJW (1959) The geochemistry of thorium and uranium. In: 558
Phys. Chem. Earth. pp 298–348. 559
36. Steier P, Bichler M, Keith Fifield L et al. (2008) Natural and anthropogenic 236U in
560
environmental samples. Nuclear Instruments and Methods in Physics Research, Section B: 561
Beam Interactions with Materials and Atoms 266 (10): 2246–2250. doi: 562
10.1016/j.nimb.2008.03.002. 563
37. Sakaguchi A, Kawai K, Steier P et al. (2009) First results on 236U levels in global fallout.
564
Science of the Total Environment 407 (14): 4238–4242. doi: 565
10.1016/j.scitotenv.2009.01.058. 566
38. Konegger-Kappel S, Prohaska T (2016) Spatially resolved analysis of plutonium isotopic 567
signatures in environmental particle samples by laser ablation-MC-ICP-MS. Analytical and 568
Bioanalytical Chemistry 408 (2): 431–440. doi: 10.1007/s00216-015-8876-y. 569
39. Shinonaga T, Donohue D, Aigner H et al. (2012) Production and Characterization of 570
Plutonium Dioxide Particles as a Quality Control Material for Safeguards Purposes. 571
Analytical Chemistry 84 (6): 2638–2646. doi: 10.1021/ac202502z. 572
Supplementary information
574575
576
Fig. S1 Electronic image, EDX spectrum and elemental mapping of the particle #2 identified as an U-bearing
577
particle. The mapping shows qualitatively that some elements (C, O, Al, Si, Fe, Ti, Ca, Mg) detected in the EDX 578
spectrum may come from surrounding particles, whereas Y and Th are obviously present in the particle. This is an 579
indication that this U-bearing particule may be of natural origin 580
Particle
581
582
Fig. S2 Electronic image, EDX spectrum and elemental mapping of the particle #3 identified as an U-bearing
583
particle. The mapping shows qualitatively that some elements (C, O, Al, Si, Fe, Ti, Ca, Mg) detected in the EDX 584
spectrum may come from surrounding particles, whereas Y and Th are obviously present in the particle. This is an 585
indication that this U-bearing particule may be of natural origin 586
Particle
587
588
Fig. S3 Electronic image, EDX spectrum and elemental mapping of the particle #3 identified as an U-bearing
589
particle. The mapping shows qualitatively that all the detected elements detected in the EDX spectrum are 590
obviously present in the particle. This is a strong indication that this U-bearing particule may be of natural origin 591
Particle
592
593
Fig. S4 Examples of electronic images of FeZn particles and associated EDX spectra
595
Fig. S5 Example of an electronic image of a spherical Si particle and associated EDX spectrum.