HAL Id: halshs-01651070
https://halshs.archives-ouvertes.fr/halshs-01651070
Submitted on 28 Nov 2017
HAL is a multi-disciplinary open access
archive for the deposit and dissemination of
sci-entific research documents, whether they are
pub-lished or not. The documents may come from
L’archive ouverte pluridisciplinaire HAL, est
destinée au dépôt et à la diffusion de documents
scientifiques de niveau recherche, publiés ou non,
émanant des établissements d’enseignement et de
A History of Statistical Methods in Experimental
Economics
Nicolas Vallois, Dorian Jullien
To cite this version:
Nicolas Vallois, Dorian Jullien. A History of Statistical Methods in Experimental Economics.
Eu-ropean Journal of the History of Economic Thought, Taylor & Francis (Routledge), 2018, 25 (6).
�halshs-01651070�
Estimating Rationality in Economics: A History
of Statistical Methods in Experimental Economics
Nicolas Vallois
∗& Dorian Jullien
†GREDEG Working Paper No. 2017–20
02/08/17, third version; comments are more than welcome
Abstract.
Experimental economists increasingly apply econometric techniques to in-terpret their data, as suggests the emergence of “experimetrics” in the 2000s. Yet statistics remains a minor topic in historical and methodological writings on experimental economics (EE). This article aims to address this lacuna . To do so, we analyze the use of statistical tools in EE from early economics ex-periments of the 1940s-1950s to the present days. Our narrative is based on qualitative analysis of papers published in early periods and quantitative anal-ysis of papers published in more recent periods. Our results reveal a significant change in EE’ statistical methods, namely an evolution from purely descriptive methods to more sophisticated and standardized techniques. We also highlight that, despite the decisive role played by statistics in the way EE estimate the rationality of individuals or markets, statistics are still considered as involving non-methodological issues, i.e., as involving only purely technical issues. Our historical analysis shows that this technical conception was the result of a long-run evolution of the process of scientific legitimization of EE, which allowed experimental economists to escape from psychologist’s more reflexive culture toward statistics.
Keywords: Experimental Economics, Statistics, Econometrics, His-tory of Economic Thought, Methodology.
JEL Codes: B20, C83, A14, C90
∗CRIISEA, Universit´e Picardie Jules Verne
Corresponding author. Email address: [email protected]
Introduction
Empirical measurements in experimental economics (EE) are derived from observations of human behavior in the laboratory. Most of these measurements are estimating economic rationality in the sense that they indicate general ten-dencies over a sample of observed choices to investigate hypothesized effects about different forms of behavioral consistency (e.g., under uncertainty, over time, regarding other people) or market efficiency. Various statistical tools are used to allow for comparisons between and/or within subjects, typically oppos-ing treatment and non-treatment conditions. The validity of these estimations thus crucially depends on statistical methods. Furthermore, the socio-history of quantification (Desrosi`eres, 1993) points that statistical methods also shape the content of concepts under estimation. Hence, beyond validity, statistical meth-ods are also likely to shape the meaning of economic rationality in experimental economics.
Yet histories of EE do not give much importance to statistics (Roth, 1995; Lee and Mirowski, 2007; Moscati, 2007; Serra, 2012; Heukelom, 2014; Svorenˇc´ık, 2015; Cot and Ferey, 2016). It seems that in the early years of EE, lab ex-periments raised different methodological issues. In particular, experimental economists had to convince their fellow economists that data produced in the laboratory allow to make assumptions of relevance for economic theory. How-ever, the validity of these assumptions regarding the ”real world” (i.e., external validity) has always been a problem in experimental economics (Levitt and List, 2007). Furthermore, statistics are, by and large, absent from most methodologi-cal reflexions on EE (Guala, 2005; Fr´echette and Schotter, 2015)1. A significant example is that the Guidelines for Submission of Manuscripts on Experimental Economics by Palfrey and Porter only mention that “the data appendix should be sufficiently detailed to permit computation of the statistics” but contain no specific rule for statistical treatments (Palfrey and Porter, 1991). Another one is the following passage from a footnote in Guala’s (2005) book that justifies the exclusion of statistics from his methodological analysis of EE:
“Data are then analyzed statistically. The techniques used for this job (significance tests, correlation, regression analysis, etc.) are not the subject of this book, so I shall not get into the technical
1An exception would be Bardsley et al.’s book that dedicates a chapter on “noise and
details of data analysis -which can differ considerably depending on the type of experiment”(Guala, 2005, pp.35-36)
According to Guala, statistics do not really matter in EE’s methodology for two reasons:
1. statistical methods depend on the “type of experiment” 2. statistics is merely a technical (non-methodological) issue
We will refer in this paper to 1. and 2. as respectively the experiment-dependency hypothesis and the technical hypothesis. If both hypotheses are valid, statistics do not play an important role in shaping the experiment itself or the content of the measured concepts of economic rationality. The technical hypothesis seems intuitively appealing. It is all the more convincing that most statistical treatments are nowadays automatized through computer software. But statistical methods in EE have changed lot since the early experiments of the 1950s. As we shall see later in greater details, regression is unavoidable in the recent literature, while it was not used by most of the first generation of experimental economists (though it was used in other areas of economics). Con-trary to the experiment-dependency hypothesis, similar “type of experiments” do not have always required the exact same statistical techniques in the history of EE. Although it is true that statistics are increasingly standardized in EE, standard methods are recent and the process of standardization itself can be in-terrogated from the viewpoint of a socio-history of quantification (Desrosi`eres, 1993).
The goal of this paper is to investigate the historical roots of current statisti-cal methods in EE to show that statistics plays an important role in the way EE estimates the economic rationality of individuals and markets, even if this role remains largely unconscious for economists. We analyze the use of statistical tools in EE from the early 1940s to the present days in terms of the ways by which experimental economists made their practice legitimate economic science in the eyes of their fellow non-experimental economists. The co-evolution of statistics and scientific legitimization explains the successive approaches that experimental economists used to estimate economic rationality. Our narrative
is based on both a traditional qualitative approach (reading and interpretation of relevant literature, personal communication with some protagonists, archival work) and a less traditional quantitative approach. We use bibliometric methods to study the post-1970 period because the 1970s saw a very large development of EE’s literature, and the great number of EE’s publications prevents from analyzing the literature in a quasi-exhaustive and qualitative manner – which we do for earlier time periods.
The paper is structured as follows. Section 1 covers early experiments from 1931-1959. We analyze the importance of descriptive statistics and discuss the few attempts to sophisticate statistical methods in economic experiments. Sec-tion 2 introduces the 1960s pioneers in statistics within EE and the statistical controversies that took place in psychology during the same period. Section 3 analyzes the strong rise of EE from 1969 to 1995 and the associated greater variety in the choice of statistical techniques. Section 4 describes the process of standardization in statistical methods that happened from 1995 to the present day.
1
Early experiments (1931-1959):
Taking the
“metrics” out of experimental econometrics
What is striking in early experiments from 1931 to 1959 is the quasi-absence of statistical analysis2. A first explication is that some of these experiments were actually specifically dedicated to model individual choice and in particular to measure utility (on which see Moscati, 2016 for more details). They did not required between-subjects comparisons and computation over aggregated data. For instance, Louis Thurstone’s 1931 experiment to construct utility curves un-der certainty was based on a single subject!3 Another example is Mosteller and Nogee in their well-known 1951 experiment, which aimed to construct in-dividual utility curves from observed choices under risk. Similarly, Davidson
2Historians of EE usually consider Louis Thurstone’s 1931 study as the first experiment
in economics (Roth, 1995; Moscati, 2007; Heukelom, 2014), even if Thurstone was not an economist. We follow this convention and start our narrative in 1931, even if most of the early economic experiments were actually published in the late 1940s and in the 1950s. Also, we acknowledge that speaking of “experimental economics” for this period is an abuse of language since there was no such self-identified community in economics.
3Though this is surprising from an economist’s perspective, this was quite traditional in
and Marschak (1959) or Royden et al. (1959) proposed psychometric methods for the experimental measurement of utility. In these experiments, data were presented and discussed quasi-exclusively at the individual level and no par-ticular statistical treatment was needed4. An associated publishing practice that almost disappeared nowadays consisted in presenting graphics about single subjects (see figure 1 below).
Figure 1: Graphic for a single individual subject in Mosteller and Nogee, 1951, p.385
Even experiments exploiting collective data did not make use of statisti-cal treatments. This the case of Chamberlin’s famous experimental market. Chamberlin studied experimentally the tendency for observed prices to converge toward competitive equilibrium. Data were discussed mostly in a qualitative manner:
4They are a few inter-group comparisons in Mosteller and Nogee’s paper, such as the
following claim: “it seems clear that student Groups A and B differed in their reactions to the high-valued, low-probability hands. Every B subject wants more money to play the 20 to 1 and 200 to 1 hands than any A subject” (Mosteller and Nogee, 1951, p.386). But such claims never involve accurate statistical considerations. Mosteller and Nogee are primarily interested in this experiment in individual choice, and inter-individual comparisons are by-products of the study. The only exception we found concerning the absence of statistical treatment is Royden et al. (1959). In this study, the authors performed a chi-square test to compare the prediction of two models.
“average price was higher than the equilibrium price seven times and lower thirty-nine times. The [. . . ] equilibrium values were dif-ferent in each example, and no statistical computations for the entire sample of forty-six experiments have been made. The simple figures, however, clearly indicate divergences not to be attributed to chance” (Chamberlin, 1948, p.97).
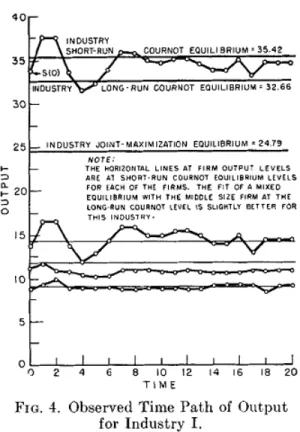
Data spoke for themselves: the fact that prices were lower thirty-nine times out of forty-six experiments “clearly indicate[s]” a solution to the theoretical problem. No computation was therefore needed, except a few basic statistics (average and median prices, standard-deviation eventually). The privileged sta-tus of raw data over more sophisticated statistical analysis was also associated with an important role played by graphics. As data were seen as direct sources of evidence, their visual display in graphics and charts occupied a central role in published articles. Discussion of results usually took the form of a detailed description of graphics. This was particularly the case for studies in which the initial theoretical problem consisted in appreciating convergence toward a theoretical prediction, such as Chamberlin’s article for instance. Another good example is Hogatt’s 1959 paper on business game, in which the results are mainly interpreted through the following detailed graphic:
Figure 2: Visual display of output production in business games, Hogatt, 1959, p.200
The article contains three similar graphics for each industry (i.e., game with three players). Hoggatt is interested in knowing if output levels are converging toward short-run or long-run Cournot equilibria (horizontal lines). An addi-tional table provides mean outputs levels for each player and industry, and these simple figures indicate that mean outputs are closer on overage to the short run equilibrium. But graphics tell a slightly different story: “industry outputs seem to be in damped, irregular oscillation about short-run Cournot levels [...] it cannot be determined whether the system would have come into [long-term] equilibrium there if play had continued”. This graphic in particular about Industry I shows that it is “very close to an equilibrium of a mixed kind with the middle firm long-run and other firms short-run” (Hoggatt, 1959, p.200). When it comes to appreciate some kind of convergence over time toward a level corresponding to a predicted equilibrium, graphics are seen as a better source of evidence than simple figures, which might discard important information about
noise, erratic moves, and long-term tendency.
We call “descriptive statistic” this very basic approach requiring only quali-tative insights, computation of simple statistics (e.g., mean, median, standard-deviation) and graphical analysis (for another example see also Lieberman, 1960; Rousseas and Hart, 1951. The problem with descriptive statistics is that it in-volves some imprecision in the discussion of results. For instance, in a bargain-ing game, Flood observed that “there was a decided tendency to start with [the equilibrium point] and then to shift to [a better equilibrium] rather consistently after about thirty trial” (Flood, 1958, pp.14-15). The claim is based merely on a qualitative inspection of raw data (individual choices). In a similar manner, Hogatt noticed “substantial differences” (1959, p.201) in individual profits in his business game. Descriptive statistics allows to explore the data and to make hypotheses about possible effects: convergence or divergence (e.g., Chamberlin 1948; Flood 1958), similarity or difference (e.g., Hoggatt, 1959). But the prob-lem is that it does not provide any statistical criteria to assess the significance of these effects: do individuals really differ in individual profits? How consistent is the tendency to shift to a better equilibrium?
These problems in the interpretation of data did not raise difficulties for early EE because the focus was mostly theoretical, not empirical. A good illus-tration is May’s article on intransitive patterns of choices (May, 1954). The paper begins with five pages of pure theory; experimental evidence is then shortly presented in four pages and the last five pages discuss how observed intransitive choices may result, theoretically, from an aggregation function of transitive preferences. Overall, the article is for the main parts concerned with introducing theoretical problems and explaining how empirical evidence could be accommodated into the theory. Similarly, in Hoggatt’s paper (1959), seven pages out of twelve are dedicated to the theoretical description and analysis of the game. Most early experimental publications did not distinguish separate sections for methods, results and discussion of empirical findings, as it is now conventionally the case. May both present and discuss data in a single section entitled “evidence for intransitivity” (1954, pp.5-8). There is no need to detail how data are produced and interpreted because they directly provide “evidence for”, or against, theoretical propositions. In particular, May observed that some patterns of choice are intransitive without discussing their frequency. May rec-ognizes that “of course it does not prove that individual patterns are always intransitive. It does, however, suggest that where choice depends on conflicting criteria, preference patterns may be intransitive unless one criterion dominates”
(1954, p.7). Even if the fraction of intransitive patterns was very small and neg-ligible, the fact that choices “may” be intransitive was worth noticing for the theorist, who supposes that they are never intransitive. In other words, there was no need to assess the significance of an observed effect, because the mere observation itself was sufficient to point out a theoretical problem.
Statistical methods and the choice of descriptive statistics in early experi-ments seem to have been dictated by this strong theoretical focus. This state of affairs cannot be explained by the fact that inferential statistics were unknown among economists and behavioral scientists conducting experiments. Indeed, we found one exception in the 1950s experimental literature, Davidson and Marschak (1959), who used sophisticated statistical tools involving hypothesis testing and computation of likelihood ratios. They also propose a reflection on Type II errors (1959, p.37) – incorrectly accepting an hypothesis that is in fact false – which is rare in EE even today. Interestingly, this paper was on stochas-tic choice. It can thus be suggested that it is because the theorestochas-tical problem at stake was stochastic, i.e., involving the consideration of random process, that the discussion of empirical findings was more statistically grounded.
Early EE was thus characterized by both a strong theoretical focus and a neglect of basic statistical issues. The last observation might be understood as confirming Guala’s technical hypothesis: statistics are a minor issue, because there was no need to use statistics in early experiments. But as we shall see in the next sections, this was not the case for subsequent (similar) experiments, thus rejecting the experiment-dependency hypothesis. In our opinion, (lack of) statistics in the 1950s already played a role in conceptually shaping the economic rationality of individuals and markets in EE. How?
It can be hypothesized that the strong theoretical focus and the neglect of basic statistical issues helped the scientific legitimization of EE. Early experi-mentalists were primarily concerned with convincing their fellow economists of the potential of experiments in economics. This is the reason why the main parts of EE’s publications in the 1950s were dedicated to theoretical issues. Contrary to other experimental discipline’s conventions, early EE was not pri-marily concerned to the establishment of empirical regularities. Experimental economists were not estimating but still theorizing economic rationality. In the articles mentioned above, empirical data were either i) pieces of evidence show-ing somethshow-ing wrong the theory and an alternative explanation was needed (e.g., May 1954) or ii) direct implementations or measurements of the theory itself (e.g., Thurstone, 1931; Mosteller and Nogee, 1951; Davidson and Suppes, 1957).
In the end, statistics played no direct role in this theoretical agenda. Rather, their absence points to the fact that there was no clearly constituted commu-nity of experimental economics at the time and that the statistical practices of those conducting experiments in economics are indistinguishable from the general statistical practices of economists at the time. Indeed, Recent historical work by Jeff Biddle shows indeed that inductive statistics based on probabil-ity theory were not really influential in economics in the postwar period until the 1970’s, despite the birth of “Cowles Commission” econometrics in the same period (Biddle, 2017)5.
2
Econometric pioneers and statistical
contro-versies in the 1960s
2.1
Experimental Econometric pioneers in the 1960s
The year 1960 marks a clear rupture in the use of statistical tools within EE. That year saw the publication of two books that abandoned purely descrip-tive methods. Statistical tests of significance are widely performed in Siegel and Fouraker’s (1960) book6. It reports a series of experiments on bargaining and group decision making, a topic which was central in early EE. In 1960 was also published Suppes and Atkinson’s Markov Learning Models for Multiper-son Interactions. The book contains a whole chapter on statistical estimation methods, mostly maximum likelihood estimates (see Suppes and Atkinson, 1960, chap. 2)7.
Vernon Smith played an important role in changing EE’s statistical methods
5We emphasize that our object of study is the evolution of statistical tools in EE. Although
a fuller picture of the parallel evolution of EE and econometrics (which we do discuss at some points) would be enlightening, this is outside the scope of our paper (we do not believe that our story will add much to the considerable literature on the history of econometrics).
6Sidney Siegel also wrote in 1956 a book entitled Nonparametric Statistics for the
Behav-ioral Sciences. The book seems to have been quite influential in EE, according to the recollec-tions of experimental economists in Svorencik and Maas’s witness seminar (2015, pp.76-78). Yet it was meant for the behavioral sciences and have been mainly cited in non-economic dis-ciplines. We thus consider that Siegel’s 1956 book was still a psychologist’s contribution for psychologists. On the methodological influence of Siegel in experimental economics (seemingly unrelated to the statistical influence), see Svorenˇc´ık (2016).
7Experimental tests of learning theory were the main topic of the book. It was not at
the time a central topic in EE; the book was not only nor mainly designed for an economic audience and became also influential in mathematical psychology. Yet it clearly revealed a renewed interest in statistics among researcher performing economic experiments.
in the 1960s. His famous 1962 article was the first to introduce regression anal-ysis in EE, along with another one in 1964. There was a technical innovations in his 1962 and 1964 publications, in the sense that they used a large variety of statistical techniques (non-parametric and parametric tests, OLS regression, analysis of variance (ANOVA)). But the novelty of Smith’s contribution was not only technical. His 1962 paper contained a whole and separate section on “em-pirical analysis of experimental data” (p.126). For the first time, statistics were considered as a problem worth discussing and alternative statistical techniques were considered to discriminate between the two hypotheses at stake (“excess rent” and “Walrasian” hypotheses). Last but not least, his 1964 article ends with a Bayesian subjective probability analysis. As we shall see in the next subsection, Bayesian statistics are mostly ignored in EE and radically change the classical approach toward hypothesis testing: it is not anymore a matter of saying if the null is rejected at (usually) the 5% level; the objective is to compute the posterior probability that the “true” hypothesis is true based upon certain a priori specified probabilities. Smith has always preferred the Bayesian ap-proach and gave Bayesian reports in another article published in 1964 (Rice and Smith, 1964) – and in two later publications(McCabe et al., 1996; Durham et al., 1998)8. Smith’s openness to Bayesian methods also reflects a more reflex-ive conception of statistics, as witnessed by an exchanges of letters with Deirdre McCloskey in the 1990s about the issue of statistical significance9. It is worth noticing that Smith took econometric courses at Harvard from Guy Orcutt, who was an early advocate of the inductive theory of statistical inference and played an important role in its diffusion in economic research (Biddle, 2017, p.163). It can thus be hypothesized that Smith’s sensitivity toward statistical issues was rather unusual (exceptional?) among his fellow economists of the 1950’s
Indeed, Smith’s statistical methods did not gain immediate recognition in EE. In the early 1960s, descriptive statistics were the still the most common way to interpret experimental results in influential experimental papers (Fell-ner, 1961; Shubik, 1962; Maschler, 1965; Lave, 1962; Bower, 1965;
MacCrim-8“I long had preferred Reverend Bayes” (Smith, personal communication to the authors,
27/05/2017).
9The exchange started with McCloskey arguing that “none of the statistical tests of
signif-icance that you, Betsy, et al. have done in “Preferences, Property Rights and Anonymity in Bargaining Games” [article subsequently published as Hoffman et al. 1996] is sensible rhetoric” (McCloskey to Smith, November 8, 1993, Box 18, Folder Sept-Dec 1993 of Smith’s papers at the Rubenstein library, Duke University). Despite their initial disagreement, both Smith and McCloskey consider that their scientific views have converged in the past ten years or so (Smith and McCloskey, personal communication to the authors, 27/05/2017).
mon, 1968). For instance, Shubik rejects theoretical hypotheses “as frequencies [of choosing some solution] appear when none are predicted [by these hypothe-ses]” (1962, p.227). Rejecting hypotheses merely requires observing choices (i.e., data) that violates them; frequencies of such choices do not need therefore to be statistically tested.
Nevertheless, the 1960s witnessed a progressive yet clear rupture in statisti-cal methods. Descriptive statistics were gradually replaced by hypothesis testing and regression analysis in EE. This first papers showing this started to be pub-lished in psychological journals such as Behavioral science(Becker et al., 1963; Hoggatt, 1967; Rapoport and Cole, 1968) or Systems Research and Behavioral Science (Becker et al., 1963). Then it followed in top-rank economic journals such as the American Economic Review (Contini, 1968), the Quaterly Jour-nal of Economics (Dolbear et al., 1968), or the JourJour-nal of Political Economy (Becker and Brownson, 1964).
2.2
The birth of a long-standing statistical controversy in
psychology
In the 1960s, EE was still burgeoning. A few experimental economists suc-ceeded in publishing their studies in top-rank economics journals such as the AER or QJE but many early economic experiments were published in non-economic – especially psychological – ones as illustrated above. Therefore, it can be hypothesized that EE’s statistical evolution in the 1960s was also the result of psychologist’s influence. Experimental economists might have only im-itated practices that were common in other experimental disciplines. Indeed, in the 1960s, the use of statistics was much more advanced in psychology than in EE. For instance, Rucci and Tweeney document the rise of ANOVA methods in experimental psychology and they identify the first use of such methods in a 1934 article. In American psychology journals, statistics commonly involved ANOVA analysis already in the 1940s-1950s (Rucci and Tweney, 1980).
More importantly, null hypothesis statistical testing (NHST) was clearly a common practice in experimental psychology in the 1950s and became unavoid-able in the 1960s. In 1962, the editor of the Journal of Experimental Psychology claimed in a famous editorial that results should be significant at the .01 level to be published10! This is not to say that NHST was universally recognized as the
10“In editing the Journal there has been a strong reluctance to accept and publish results
related to the principal concern of the research when those results were significant at the .0 5 level, whether by one-or two-tailed test. This has not implied a slavish worship of the.01 level, as some critics may have implied. Rather,it reflects a belief that it is the responsibility
best practice in psychology. NHST raised an important and long-lasting debate in the 1960s, starting with fierce critics by Rozeboom (1960), Cohen (1962) and Bakan (1966), with later responses after the 1960s (Chow, 1988, 1989, 1991). Nowadays, NHST is still very controversial in psychology. We are interested in this debate only in order to show that it had almost no echo in EE. Hence we provide here only a very brief account of the main objections against NHST and then explain how these objections were largely not discussed in EE11.
Critics of NHST do not criticize NHST per se, but rather the way it is commonly applied in the academic literature. Following Gigerenzer, standard academic NHST can be summarized in the following three steps: “(1) set up a statistical null hypothesis, but do not specify your own hypothesis nor any alternative hypothesis, (2) use the 5% significance level for rejecting the null and accepting your hypothesis, and (3) always perform this procedure” (Gigerenzer, 2004, p.587). A first problem with this method is that it leads to overemphasize the importance of statistical significance over size effect. Significant effects might not be important (practically or theoretically); insignificant but large effect might be on the contrary worth reporting.
Another problem is that type II errors are not considered and NHST are often underpowered (i.e., conducted with not enough observations to discrim-inate whether a significant effect is merely due to chance or really due to the phenomena under study). In 1962, Cohen showed in a famous article that most research in abnormal social psychology was severely underpowered and actually led to the failure to reject null hypotheses which were actually false (Cohen, 1962). Following Cohen, many studies on statistical power have been conducted in psychological research (Brewer, 1972; Katzer and Sodt, 1973; Haase, 1974; Chase and Tucker, 1975; Kroll and Chase, 1975; Chase and Baran, 1976; Chase and Chase, 1976; Sawyer and Ball, 1981; Sedlmeier and Gigerenzer, 1989). The result of these surveys is alarming, because they point out that a large part of experimental research reveal effects that are actually false, due to statisti-cal underpower. But at least these problems are known and analyzed as such in psychology; some researchers are very proactive in this matter, like Cohen who dedicated an entire book on the subject (Cohen, 1969). The problem is also discussed in empirical economics (see the recent survey of Ioannidis et al.,
of the investigator in a science to reveal his effect in such a way that no reasonable man would be in a position to discredit the results by saying that they were the product of the way the ball bounces” (Melton, 1962, pp.553-554).
11For a detailed survey, see Nickerson, 2000; for a more critical account, see the works of
forthcoming).We found no similar study in EE. The only exception was a 2013 article by Zhang and Ortmann, which also conclude on severe underpower in EE. It is worth noticing that this working paper was never published, proba-bly suggesting a lack of interest in this matter among experimental economists (Zhang and Ortmann, 2013)12.
NHST also raises Bayesian objections. NHST implies a binary interpreta-tion of statistics: hypotheses are either accepted or rejected at a given signif-icance level. The Bayesian approach favors instead the computation of likeli-hood ratios. It is the reason why Bayesian critics often recommend to report exact p-values instead of claiming significant results at some significance level13. Bayesian psychologists might be under-represented but at least they get some diffusion (see in particular the very high Google Scholar [GS] citation count of Edwards et al.’s article on “ Bayesian statistical inference for psychological research”, Edwards et al., 1963), whereas Bayesian experimental economists are nowhere to be found.
A last problem associated with NHST is the misinterpretation of p-values. A p-value is the probability to get the observed result under a true null. It should not be confused with the probability to wrongly accept the null. Psy-chologists conducted many studies showing that both students and researchers do misunderstand NHST and significance tests this way, using questionnaires (Rosenthal and Gaito, 1963; Tversky and Kahneman, 1971; Oakes, 1986; Falk and Greenbaum, 1995; Haller and Krauss, 2002). Once again, we found no sim-ilar studies in EE. Also, a quick look into GS citations indicates that none of
12Recently, Bellemare and his coauthors published an article about statistical power in the
Journal of the Economic Science Association (Bellemare et al., 2016). The authors propose a STATA package to estimate statistical power in economic experiments. Yet once again, this contribution is meant to provide a purely technical solution. This technique is illustrated with a short comparison of two studies in gift field experiments, but the authors do not conduct a systematic survey of the literature similar to the one realized in other experimental disciplines (e.g., Cohen, 1962, cf. Supra).
13‘Bayesian’ psychologists often consider themselves as unfairly ignored. They frequently
invoked historical arguments to their case. For instance, Gigerenzer argues that the problem came from Fisher’s influence in the history of statistics, and favors instead the Neyman-Pearson approach (the case is very frequent in most of Gigerenzer’s works; similar arguments are to be found in non-experimental economics, see Zilliak and McCloskey papers referenced below). The purpose of our article is not to assess the historical accuracy of these claims, but it is worth noticing such attempts to rehabilitate Bayesian statistics in psychology. We found no such references to Bayesian statistics in EE in all periods, except, as discussed above, in Smith (1964). Bayesian approaches are sometimes applied in EE to optimize experimental designs , (e.g., El-Gamal et al. 1993; El-Gamal and Palfrey 1996; Kessels et al. 2011 or in structural modeling to find the model best fitting the data (e.g. Cipriani et al., 2012), but Bayesian statistics in both cases are not used to discuss experimental results nor to assess the validity of hypotheses in the way above mentioned
the studies mentioned above is quoted in a significant manner in the EE lit-erature14. It is all the more surprising that the scientific community has been increasingly concerned with p-values and their interpretations in recent years (Nuzzo, 2014; Wasserstein and Lazar, 2016). This concern has led the Ameri-can Statistical Association (ASA) to release a policy statement on p-values and statistical significance (ASA, 2016).
Significance and NHST is a central methodological question in experimental psychology. The alarming studies discussed above led many proactive initia-tives, in particular by journal editors. For instance, Geoffrey Loftus, editor of Memory and Cognition from 1994 to 1997, tried to reform statistical methods. He advocated against the blind use of NHST and strongly encouraged presenta-tion of figures with confidence intervals (on Loftus’s initiative, see Finch et al., 2004). More radically, the editors of Basic and Applied Social Psychology de-cided in 2015 to ban p-values and NHST! (Trafimow and Marks, 2015). The publication manual of the American Psychological Association also shows an increasing concern for improving statistical practices. It includes for instance recommendations to report confidence intervals and effects sizes. The man-ual clearly recognizes the controversy over NHST even if its recommendations remain controversial (Fidler, 2002).
The controversy over NHST echoed in economics and econometrics, in partic-ular with the debate about statistical significance initiated by McCloskey and Zilliak (McCloskey and Ziliak, 1996; Ziliak and McCloskey, 2008a,b; Spanos, 2008; Hoover and Siegler, 2008b,a). NHST and statistical power is also a very controversial subject in neuroscience (e.g., Ioannidis 2005; Button et al. 2013) and in behavioral and biological sciences in general (Fanelli and Ioannidis, 2013). Yet we saw that this debate has been almost absent in the EE literature.
In the end, the 1960s saw an ambivalent evolution: EE’s statistical tools were more and more sophisticated, but that did not raise an associated interest in more reflexive discussion about statistics. EE incorporated statistical tools used by Smith (Smith, 1962, 1964) such as NHST and regression but not the reflexive perspective on these tools that Smith had. Words might have played an important role in this matter. Psychologists talk uniformly about ‘statistics’,
14The only exception would be Tversky and Kahneman’s study on “the law of small
num-bers” Tversky and Kahneman (1971). Belief in this law led in this experiment to statistical bias (overestimation of power and significance, underestimation of confidence intervals and sampling variation). Tversky and Kahneman’s importance and celebrity probably explains why this study in particular came to be cited in EE. It can be hypothesized that most of the citing articles in EE retain from Tversky and Kahneman’s study the general notion of a “cognitive bias” rather than the exact statistical content of this bias.
while in economics the word ‘econometrics’ is often preferred as soon as any sta-tistical analysis is performed on economic problems (which is always the case in economic publications). If statistics equals econometrics, EE and statistics do belong to different subfields, methods and academic specialties. It might explain why most experimental economists consider statistical techniques not as meth-ods to discuss (and do not therefore see the need for statistical methodology) but rather as tools made for tailored used by non-EE’s specialists.
Guala’s technical hypothesis cannot be rejected for the 1960s. But the evolu-tion of statistical methods rejects the experiment-dependency hypothesis, since similar studies were not using similar statistics in the 1950s and the 1960s. We therefore argue that this sophistication of statistics without reflection is part of the scientific legitimization of EE. Experimental economists were now (in the 1960s) estimating – rather than theorizing – economic rationality. Empirical data were not anymore mere hints of theoretical interests. They had to be an-alyzed at a specific level with specific tools before the theoretical discussion. But these experiments maintained their focus on economic theory. The purpose was generally to test theoretical predictions, such as for instance Cournot equi-librium (Siegel and Fouraker, 1960), the random utility model (Becker et al., 1963) or competitive market equilibrium (Smith, 1962). Hence the importance of statistical hypothesis testing. The 1960s were a period transition, in which the introduction of statistical methods allowed the first estimation of economic rationality in the lab, but still in a mostly theoretical perspective.
3
Statistical diversity in the experimental
eco-nomics boom (1970-1995).
The 1970s saw a strong increase in publications of EE papers and the 1980s have been “explosive” in this regard as Roth (1995, p.21) puts it. This great number of EE’s publications prevents from analyzing the literature qualitatively in a quasi-exhaustive manner as we did in the last two sections. Therefore, we had to perform a quantitative analysis. We were interested in testing Guala’s technical and experiment-dependency hypotheses. If these hypotheses were to be rejected, statistics might play an important role in shaping economic ratio-nality in EE. Testing these two hypotheses requires the construction of two sets of variables: one set to discriminate different levels of statistical technicality and one set to discriminate different types of experiments.
we chose to sample representative articles from different domains of EE. We ended up with six types of experiments: industrial organization, auctions, pub-lic goods, individual decision-making in economics, individual decision mak-ing in pschology, and asset marks. Our samplmak-ing method is based on Kagel and Roth’s classification of EE’s subfield (Kagel and Roth, 1995). Kagel and Roth’s influential handbook contains eight chapter dedicated to the following seven domains: public goods, coordination problems, bargaining experiments, industrial organization, experimental asset markets, auctions, and individual decision-making (DM)15. We retrieved all references from each chapter of Kagel and Roth’s handbook. We dropped non-experimental articles and working pa-pers. References were then ranked according to their Google Scholar citations count. We analyzed in each domain the 20 most heavily cited publications. We supposed in doing so that citations are an indicator of how each article was recognized as central and thus representative of each subfield. One problem was that there was substantial overlap between these subfields and some articles (particularly influential) appeared as references in two or more chapters of Kagel and Roth’s handbook. We thus proceed to some re-allocations. For instance, Tversky et al.’s (1990) famous paper on the causes of preference reversal was cited in Kagel’s chapter on auction and also in Camerer’s chapter on individual-decision making. It belongs much more to the latter for obvious reasons and the article was thus allocated to the individual decision-making domain. We also distinguish in individual DM between psychological publications and economic publications, as we suspected (from what we argued in the previous section) important differences in statistical methods between the two disciplines. Fi-nally, we dropped coordination problems and bargaining experiments because we realized that most references in these subfields were already cited in other chapters.
To discriminate different levels of statistical technicality, we constructed the following four categories:
1. Descriptive statistics, as defined in section 1.
2. Statistical test, corresponding to NHST, with three subcategories: para-metric, non-parapara-metric, or both parametric and non-parametric testing. ANOVA was assimilated to multiple two-sample t -tests and thus classified
as parametric testing16.
3. Regression, with three subcategories: simple regression (OLS), probit-logit-tobit and control. The last subcategory (control) refers to more sophisticated types of regression including at least one of the following characteristics: detection and treatment of heteroskedasticity, autocor-relation, non-stationarity in time series, fixed effect and random effect models.
4. Structural modeling, corresponding to the estimation of a theoretical model with controlled data. It relies mostly on maximum likelihood estimates, and eventually simulation methods. Many contribution in this category are based on pre-existing data and were thus excluded from our analysis. It should also be noted that distinguishing between structural modeling and mere regression is not obvious, in particular for studies discussing specification problems at length17.
16Yet technically speaking, ANOVA is very similar to linear regression. Statisticians
fre-quently consider the usual ANOVA set-up as a special case of OLS regression (Gelman, 2005). But we chose to classify ANOVA as statistical testing from a methodological perspective, because it is most commonly used to test the difference between the means of several groups, and is thus analogous to a multiple t -tests. Also, our classification is based on the idea of a general evolution in EE’s statistical methodology, that goes from descriptive statistics to structural modeling. Regression is regarded as a step toward structural modeling; it relies indeed on an equation to estimate, which suggests a plausible theoretical model. The crucial difference between ANOVA and regression in this regard is that basic applications of ANOVA mention F-stats and p-values only (ANOVA tables are rare) and do not provide a general model to estimate. This probably explains why ANOVA is relatively rare in economics, while it has been so important in experimental psychology (Rucci and Tweney, 1980). Similarly, we found that ANOVA was frequent in individual DM in psychology and almost absent in the other economic subfields.
17In our initial classification, maximum-likelihood estimates were required for articles to be
classified as structural modeling. But we found that the structural approach could also include some articles using linear OLS regression. For instance, Fischb¨acher and G¨achter (2010) sim-ulate data from several theoretical models. Then they regress simsim-ulated data to observed data to see which model fits the best the observations. Here, linear OLS regression and simulation methods are applied to estimate theoretical models; hence this article seems to correspond to our definition of structural modeling. We changed therefore our criteria for inclusion in the structural modeling category. The main criterion is the purpose of the regression. If regres-sion techniques are applied to test a previous hypothesis, or merely provide support for an observation, the article was classified in the regression category. For these articles, the main matter is not the functional form of the regression, but rather to provide a direct answer about the importance of some experimental parameters (typically, treatments variables are used as regressors). Alternatively, when the equation to estimate in the regression is considered as a general model (for instance, utility functions, bid functions in auction experiments, learning models), the article was classified in the structural modeling category. Usually, this involves lengthy discussions of the various models to estimate in the first (non-experimental) part of the article. Another criterion is the consideration of specification problems: typically, several regression models are discussed. Our classification might be criticized because we included in the structural modeling category some articles using very basic statistical tools, for instance
Each paper is classified in one category only. Of course, higher categories include lower categories so that an article in structural modeling also implicitly use descriptive statistics, statistical testing and regression; another one in regression also implicitly use statistical testing and descriptive statistics; and so on.
Domain Descriptive stat
Statistical Testing Regression Structural Modeling only para-metric only non-parametric
both total linear tobit or probit or logit control total Industrial organization - oligopoly 20% 15% 30% 5% 50% 15% 5% 10% 30% 0% Auctions 10% 15% 5% 15% 35% 30% 0% 5% 35% 20% Public goods 30% 25% 20% 15% 60% 10% 0% 0% 10% 0% Individual DM - econ 20% 45% 5% 10% 60% 10% 0% 5% 15% 5% Individual DM - psych 20% 35% 10% 25% 70% 5% 0% 0% 5% 5% Asset markets 5% 20% 15% 20% 55% 10% 0% 15% 25% 15% All 17.50% 25.83% 14.17% 15% 55% 13.33% 0% 5.83% 20% 7.50%
Table 1: Statistical methods in EE across domains, 1971-1995
This section is concerned with the 1970-1995 period, because important changes occurred in EE after 1995, as we shall see in the next section. Table 1 provides the main result of our analysis. A first observation is that structural modeling is very rare in the pre-1995 literature (7,5% of all experiments). Struc-tural modeling is less uncommon in auction experiments where it amounts to 20% of this subfield and typically involves basic (linear) estimation of bid func-tions. Nevertheless, 20% cannot said to represent a quantitatively important use of this technique. Secondly, statistical methods vary substantially across subfields. On one side, public goods and individual DM (both economic and psychological) experiments are still characterized by the importance of purely descriptive methods, eventually associated with statistical testing. 90% of pub-lications are based on that approach (80% in economic DM) and the use of re-gression is exceptional. On the other side, the majority of auction experiments (55%) apply regression techniques and structural modeling. Asset market exper-iments are relatively similar to auction experexper-iments in this regard, even if both
linear OLS regression of bid functions in auction experiments. We insist that all of our data and justifications are available on request.
regressions and structural modeling remain in minority (40%) in this subfield. Statistical sophistication in market experiments (including both auction and asset markets) might be explained by Smith’s influence (cf. previous section). Also, market experiments yield a large number of observations and it might be hypothesized that the subfield is better suited for complex statistical analysis. Industrial organization is somewhere between the two sides and relatively close to the average.
To know if each subfield was significantly different from another, we per-formed Cramer von Mises tests between proportions for each subfield and the average proportions for all other subfields excluding the one tested18. We found that four subfields (auctions, public goods, individual decision-making in psy-chology, asset markets) are significantly different (at the 1% level) from the rest of the field. Methodological heterogeneity between subfields suggests that statistics vary according to the theoretical matter at stake. It thus corrobo-rates Guala’s experiment-dependency hypothesis, i.e., the choice of statistical techniques merely depends on the type of experiment. Qualitative insights on our data also confirm Guala’s technical hypothesis. Experimental economists do indeed consider statistics as a minor problem. Details on statistical methods are frequently given in footnotes (e.g. Prasnikar and Roth 1992) or in the ap-pendix (e.g., Loewenstein, 1987). Such publishing practices implicitly assume that statistics are not central in the exposition of experimental results.
But once again, what is important is that experimental economists have not always considered statistics in this technical way. The technical conception of the 1970s was the result of a historical process shaped by the wish to achieve scientific legitimacy in economics . The 1971-1995 period still shows a strong theoretical focus in EE. Descriptive statistics plays an important role particu-larly in public goods, industrial organization and individual decision-making. In these subfields, it can be hypothesized that the main matter was not experimen-tal, in the sense that the central purpose of experiments was to provide quick empirical answers to theoretical problems. Yet the majority of experiments used statistical hypothesis testing. This reveals that the correspondence between the-ory and data was not direct, and specific tools had to be applied to allow for such a correspondence. As in the last section, experimental economists were
18We had not enough observations for each subfield and each methods (some n
i,j < 5) to
perform the parametric Chi-square test. Another reason for choosing non-parametric tests was that such tests are distribution-free and we did not want to make specific assumptions about the sampling distribution of methods in each subfields (in particular, there might be subgroups of experiments using very similar methods, yielding skewed and non-normal distributions).
estimating instead of theorizing rationality, in the sense of choosing between alternative theoretical explanations on the ground of relevant approximations. Data sets were assumed to be samples from larger populations, and relevant properties of the population had to be statistically estimated.
The technical conception of statistics implied that estimation methods did not play an important role in the methodology of estimating economic ratio-nality. The main objections could be either empirical or theoretical, but never statistical: reflections on statistical power or on the choice of statistical tests were very rare. Statistical methods in the 1971-1995 period were essential in estimating economic rationality, but nowhere to be found in EE’s methodology.
4
Experimetrics and the rise of structural
mod-eling (1995-2010)
The 1990s saw the definite institutionalization of EE (see chapter 4 in Svorenˇc´ık, 2015). In particular, the journal Experimental Economics was founded in 1996 with a first issue published in 1998.It can therefore be hypothesized that the period 1995-2010 displays an homogenization of statistical methods that ac-companies the end of EE’s institutionalization process.
To test this hypothesis, we repeated the analysis of the previous section for the post-1995 period. To sample articles after 1995, we had to rely on recent surveys (Noussair and Tucker, 2013; Potters and Suetens, 2013; Chaudhuri, 2011; G¨uth and Kocher, 2014; Kagel and Levin, 2014). Each survey corresponds to one of the six subfields of EE (cf. Table 1). There was however no survey on individual DM, probably because the domain became too big. We considered that the subfield roughly evolved to what is today referred to as behavioral economics, of which we excluded experiments with interactions (e.g. trust game experiments) because they were absent from individual DM in economics and psychology for earlier periods (cf. preceding sections), with the exception of public good game experiments which we classified as a separate domain. Hence we retrieved references from two behavioral economics’ textbooks (Cartwright, 2014; Angner, 2016) and we did not distinguish anymore between economic and psychological individual DM19
19The reason was that there are actually very few behavioral economics’ articles published
Domain Descriptive statistics
Statistical Testing Regression Structural Modeling only para-metric only non-parametric
both total linear tobit or probit or logit control total Industrial organization - Oligopoly 0% 0% 55% 0% 55% 0% 0% 5% 5% 40% Auctions 0% 5% 20% 10% 35% 10% 5% 10% 25% 40% Public goods 5% 0% 20% 10% 30% 20% 5% 20% 45% 20% Individual DM - econ 0% 20% 5% 20% 45% 20% 5% 0% 25% 30% Asset markets 0% 10% 25% 5% 40% 20% 0% 25% 45% 15% All 1% 7% 25% 9% 41% 14% 3% 12% 29% 29%
Table 2: Statistical methods in EE across domains, 1995-2010
Domain Descriptivestatistics Statistical Testing Regression StructuralModeling only para-metric only non-parametric
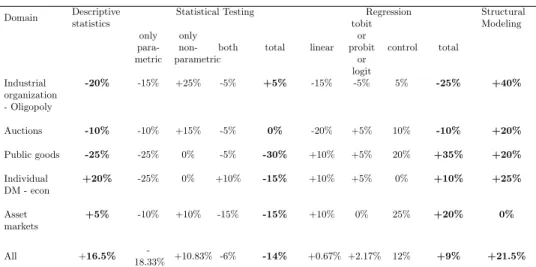
both total linear tobit or probit or logit control total Industrial organization - Oligopoly -20% -15% +25% -5% +5% -15% -5% 5% -25% +40% Auctions -10% -10% +15% -5% 0% -20% +5% 10% -10% +20% Public goods -25% -25% 0% -5% -30% +10% +5% 20% +35% +20% Individual DM - econ +20% -25% 0% +10% -15% +10% +5% 0% +10% +25% Asset markets +5% -10% +10% -15% -15% +10% 0% 25% +20% 0% All +16.5% -18.33% +10.83% -6% -14% +0.67% +2.17% 12% +9% +21.5%
Table 3: Evolution of statistical methods in EE between 1971-1995 and 1995-2010
Table 2 provides the results of our post-1995 analysis. The main result is that purely descriptive statistics almost disappeared from the literature. It seems that publication standards after 1995 require at least statistical testing in the interpretation of data. Comparison between the two periods in table 4 shows a strong decrease in descriptive statistics and statistical testing, along with a rise in regression and structural modeling. Less studies are using simple statistical testing (14% decrease) in all domains, except in industrial organiza-tion experiments (slight 5% increase). Overall, descriptive statistics and
sta-tistical testing have been replaced by regression (particularly in public goods, +35%) and structural modeling. The latter approach is thriving (+21,50% in all subfields) and is particularly widely used in auction experiments, industrial organization (40%) and individual DM (30%). It should also be noted that regressions get also more sophisticated (+6,17% in the control subcategory) in the sense that they involve more complex considerations pertaining for instance to heteroskedasticity or autocorrelation problems.
Comparisons between pre-1995 and post-1995 results have limited meanings because we changed our sampling methods. Table 3 shows however a clear tendency toward homogenization of statistical methods across subdomains. We performed the same Cramer von Mises test as in the previous section between each subfield and the rest of the field. We found that all subfields do not significantly differ anymore at the 1% level.20
Statistical methods are clearly more homogenous in the recent time period. In sum, we observe a strong tendency toward both convergence and sophis-tication of statistical methods. Convergence can be explained by the institu-tionalization of EE mentioned above, that might have facilitate standardization of EE’s methods. Sophistication can probably be associated to the diffusion of statistical software, that made regression and structural modeling easier to perform.
It is worth noticing that we found no reference to Bayesian methods in all of our sampled articles. Reluctance toward Bayesian statistics is further confirmed through informal exchanges with experimental economists. For instance, Vernon Smith provided us the following anecdote:
“Jack and I provided a Bayesian report [in Durham, Hirshleifer and Smith 1998], the editor accepted conditional on us doing Fisher’s song and dance. We did so in the text using a likelihood ratio test making it easy to add running footnotes to convert the ratio into a posterior. Our revenge came in one test where the classical outcome depended on which H was chosen as the null.” (Personal communi-cation to the authors, 27/05/2017).
20The same significance level was used in the previous section. We found significant
dif-ferences for auctions, asset markets and IO at the 5 % significance level only. T-stats from Cramer von Mises test are clearly decreasing between the two periods, thus confirming this process of homogenization in statistical methods across domains.
Here, the journal editor could not accept to publish a paper in which results were primarily interpreted in a Bayesian way. An absolute condition for publica-tion was to play “Fisher’s song and dance”, i.e. to adopt the binary framework of NHST (rejection/failure to reject hypotheses at a given significance level). Typically, Bayesian interpretations in terms of posterior likelihoods might be included as additional remarks in footnotes. This lack of openness toward alter-native methods is probably the price to pay for ‘high-tech’ ‘Fisherian’ statistics and for standardization in editorial and publication practices.
Convergence and sophistication in EE’s statistical methods should also be associated with the birth of experimetrics. The word “experimetrics” seem to appear for the first time in a 2003 book by Camerer (2003, p. 42) and was used by Moffatt to entitle his 2016 textbook on statistical methods in EE (Moffatt, 2015). Experimetrics suggests that statistics raise methodological issues in EE at last, and is not anymore a purely technical matter. Yet a closer inspection of Moffatt’s book shows that this is not the case. Moffatt clearly maintains the technical conception of statistics that we mentioned above: experimetrics “comprises the body of econometric techniques that are customized to experi-mental applications”21. The purpose is to give ready-to-use econometric tools to experimental economists whose main contribution and specialty remains in experimental testing of economic theory. Thus Moffatt’s book is very concrete and is filled with pages of STATA codes.
Experimetrics therefore confirms Guala’s technical hypothesis. But the decline in statistical diversity across subfields advocates for rejection of the experiment-dependency hypothesis, since different experiments tend to use more and more similar statistical methods. Is Guala’s glass half full-half empty? We argue that it incompletely empty. As said before, the technical conception was the result of a historical process shaped by the wish to achieve scientific le-gitimacy in economics, in which statistical methods do play an important – yet often unnoticed – role in shaping economic rationality. This involved the rise of more complex regressions and structural modeling in particular. Moffatt is indeed a strong supporter of structural modeling, defined as a method for the “estimation of the parameters of the utility function” (Moffatt, 2015, p.6). Structural modeling is mostly used to develop maximum likelihood estimates of models of choice under uncertainty, as advocated by Andersen et al. (2010), but
21In this regard, Houser’s definition of experimetrics is more neutral and less
technically-oriented : experimetrics are the “formal procedures used in designed investigations of economic hypotheses”(Houser, 2008).
might also concern other EE’s subfields such as auction experiments (Paarsch et al., 2006).
Statistical considerations are decisive in structural modeling. The choice of maximum-likelihood estimates and simulation methods shapes directly eco-nomic rationality. It is not anymore a matter of testing empirical predictions, but calibrating and fitting theoretical models that provide these predictions. Thus statistical methods play a truly theoretical role, even if they are still con-sidered as a very technical and specialized matter. The importance of statistics is also visible in the large number of citations received by articles using pre-existing data only and specifically dedicated to the econometric aspects pertain-ing to structural modelpertain-ing (e.g., Roth and Erev, 1995; Camerer and Hua Ho, 1999).
Experimetrics thus refers to a genuine statistical estimation of economic rationality, this does not involve convergence with econometrics. Paradoxically, the defense of structural modeling in EE goes precisely the opposite way of recent evolutions in econometrics. Econometrics’ leading figure Joshua Angrist supports the use of “quasi-experimental” methods in applied economics that involve to “taking the “econ” out of econometrics”, i.e. less structural modeling of data with previous theoretical models (Angrist and Pischke, 2010). This claim is of course controversial in econometrics, but a recent bibliometric study shows a marked decrease in strutural approach and a relative increase of quasi-experimental methods in econometrics (Panhans and Singleton, 2016)22.
Also, Moffatt rests on the idea that EE and econometrics are two rival ap-proaches in applied economics. According to Moffatt, the main advantage of EE’s randomized and controlled data is that it allows for the correct identifi-cation of treatment effects, “which has always been a central problem in main-stream econometrics [...]The other side of this coin is that, since the data have not been collected in a natural environment, experimental results do not neces-sarily carry over to the world outside the lab” (Moffatt, 2015, pp.2-3). In other words, external validity is the main methodological difficulty in EE; statistical (econometric) problems do not really concern EE.
Experimetrics thus refers to a particular understanding of econometrics.
22Most experimental economists do consider like Moffatt that randomization is the hallmark
of their discipline (see for instance Levitt and List, 2009). Yet it should be noted that this is questionable. As argued by Stephen Ziliak, randomization is not necessarily the most adequate method to conduct experiments, and is is very likely to have less statistical power than “balanced” designs (Ziliak et al., 2014; Ziliak and Teather-Posadas, 2016). Once again, these questions are usually not discussed in EE’s literature.
This technical conception does not follow the actual direction of contempo-rary econometrics: while applied economics is going quasi-experimental and less structural, “experimetrics”, i.e. EE’s statistical methods, is going more structural. EE and econometrics are not finally converging in the single-unified branch of applied economics, with lab experiments and statistics at the same methodological status. Experimental economists still do not consider them-selves as econometricians – even if more and more econometricians do consider themselves as experimentalists. They have to rely on econometrics but statistics are a technical problem, not a methodological question.
It should be noted that this technical conception does not prevent statistical sophistication in EE. As said before, estimation of economic rationality depends crucially on statistics in structural modeling. It can be hypothesized that it is precisely because experimental economist are looking for technical and ready-to-use tools, possibly in the tailored form of computer code, that EE’s statistics are more sophisticated than the ones used in psychology. Yet this technical conception prevents methodological reflexion. Our historical analysis shows that the dominant technical perspective on statistics was the result of a long-run evolution of EE’s process of scientific legitimization, that allowed experimental economists to escape from psychologist’s more reflexive culture toward statistics.
Conclusion
Statistical methods in EE have changed a lot from 1931 to the present day. Early experiments were mostly using descriptive statistics. Empirical data were taken as direct source of evidence for theoretical matter. The rise of statisti-cal hypothesis testing reveals that experimental economists started ‘estimating’ economic rationality in the sense that the relevant properties of a larger popula-tion were inferred from the sampled data. But the purpose was still theoretical: statistical testing was mainly about testing predictions provided by theoretical models . In the more recent period, statistical methods in EE have been increas-ingly homogenized and sophisticated, with more and more complex regressions and structural modeling. The emergence of experimetrics means that statistics play now a decisive role in the theoretical estimation of economic rationality. Yet it is still considered as a very specialized and technical matter. Our histor-ical analysis shows that this technhistor-ical conception was the result of a long-run
evolution EE’s process of scientific legitimization, which allowed experimental economists to escape from psychologist’s more reflexive culture toward statistics.
References
Andersen, S., G. W. Harrison, M. I. Lau, and E. E. Rutstr¨om (2010). Behavioral econometrics for psychologists. Journal of Economic Psychology 31 (4), 553– 576.
Angner, E. (2016). A Course in Behavioral Economics 2e. Palgrave Macmillan. Angrist, J. D. and J.-S. Pischke (2010). The credibility revolution in empirical economics: How better research design is taking the con out of econometrics. The Journal of economic perspectives 24 (2), 3–30.
ASA (2016). The asa’s statement on p-values: context, process, and purpose. American Statistician 70 (2), 129–133.
Bakan, D. (1966). The test of significance in psychological research. Psycholog-ical bulletin 66 (6), 423.
Bardsley, N. (2010). Experimental economics: Rethinking the rules. Princeton University Press.
Becker, G. M., M. H. DeGroot, and J. Marschak (1963). An experimental study of some stochastic models for wagers. Behavioral Science 8 (3), 199–202. Becker, G. M., M. H. Degroot, and J. Marschak (1963). Probabilities of choices
among very similar objects: An experiment to decide between two models. Systems Research and Behavioral Science 8 (4), 306–311.
Becker, S. W. and F. O. Brownson (1964). What price ambiguity? or the role of ambiguity in decision-making. Journal of Political Economy 72 (1), 62–73. Bellemare, C., L. Bissonnette, and S. Kr¨oger (2016). Simulating power of eco-nomic experiments: the powerbbk package. Journal of the Ecoeco-nomic Science Association 2 (2), 157–168.
Biddle, J. (2017). 2016 hes presidential address: Statistical inference in eco-nomics, 1920–1965: Changes in meaning and practice. Journal of the History of Economic Thought 39 (2), 149–173.
Bower, J. L. (1965). The role of conflict in economic decision-making groups: Some empirical results. The Quarterly Journal of Economics 79 (2), 263–277. Brewer, J. K. (1972). On the power of statistical tests in the american edu-cational research journal 1. American Eduedu-cational Research Journal 9 (3), 391–401.
Button, K. S., J. P. Ioannidis, C. Mokrysz, B. A. Nosek, J. Flint, E. S. Robinson, and M. R. Munaf`o (2013). Power failure: why small sample size undermines the reliability of neuroscience. Nature Reviews Neuroscience 14 (5), 365–376. Camerer, C. (2003). Behavioral game theory: Experiments in strategic
interac-tion. Princeton University Press.
Camerer, C. and T. Hua Ho (1999). Experience-weighted attraction learning in normal form games. Econometrica 67 (4), 827–874.
Cartwright, E. (2014). Behavioral economics, Volume 22. Routledge.
Chamberlin, E. H. (1948). An experimental imperfect market. Journal of Po-litical Economy 56 (2), 95–108.
Chase, L. J. and S. J. Baran (1976). An assessment of quantitative research in mass communication. Journalism Quarterly 53 (2), 308–311.
Chase, L. J. and R. B. Chase (1976). A statistical power analysis of applied psychological research. Journal of Applied Psychology 61 (2), 234.
Chase, L. J. and R. K. Tucker (1975). A power-analytic examination of contem-porary communication research. Communications Monographs 42 (1), 29–41. Chaudhuri, A. (2011). Sustaining cooperation in laboratory public goods exper-iments: a selective survey of the literature. Experimental Economics 14 (1), 47–83.
Chow, S. L. (1988). Significance test or effect size? Psychological Bul-letin 103 (1), 105.
Chow, S. L. (1989). Significance tests and deduction: Reply to folger (1989). Chow, S. L. (1991). Conceptual rigor versus practical impact. Theory &
Cipriani, M., R. Costantini, and A. Guarino (2012). A bayesian approach to experimental analysis: trading in a laboratory financial market. Review of Economic Design 16 (2-3), 175–191.
Cohen, J. (1962). The statistical power of abnormal-social psychological re-search: a review. The Journal of Abnormal and Social Psychology 65 (3), 145.
Cohen, J. (1969). Statistical power analysis for the behavioral sciences. Contini, B. (1968). The value of time in bargaining negotiations: Some
experi-mental evidence. The American Economic Review 58 (3), 374–393.
Cot, A. and S. Ferey (2016). La construction de ”faits” ˜A c conomiques d’un nouveau type: ˜A c l ˜A c ments pour une histoire de l’ ˜A c conomie comporte-mentale. L’Actualit ˜A c ˜A c conomique 92 (1-2), 11–47.
Davidson, D. and J. Marschak (1959). Experimental tests of a stochastic decision theory. Measurement: Definitions and theories, 233–69.
Davidson, D. and P. Suppes (1957). Decision making: An experimental ap-proach. Stanford University Press.
Desrosi`eres, A. (1993). La politique des grands nombres. histoire de la raison statistique. Paris, La D´ecouverte.
Dolbear, F. T., L. B. Lave, G. Bowman, A. Lieberman, E. Prescott, F. Rueter, and R. Sherman (1968). Collusion in oligopoly: an experiment on the effect of numbers and information. The Quarterly Journal of Economics 82 (2), 240–259.
Durham, Y., J. Hirshleifer, and V. L. Smith (1998). Do the rich get richer and the poor poorer? experimental tests of a model of power. The American Economic Review 88 (4), 970–983.
Edwards, W., H. Lindman, and L. J. Savage (1963). Bayesian statistical infer-ence for psychological research. Psychological review 70 (3), 193.
El-Gamal, M. A., R. D. McKelvey, and T. R. Palfrey (1993). A bayesian se-quential experimental study of learning in games. Journal of the American Statistical Association 88 (422), 428–435.