HAL Id: hal-00382077
https://hal.archives-ouvertes.fr/hal-00382077
Submitted on 7 May 2009
HAL is a multi-disciplinary open access
archive for the deposit and dissemination of sci-entific research documents, whether they are pub-lished or not. The documents may come from teaching and research institutions in France or abroad, or from public or private research centers.
L’archive ouverte pluridisciplinaire HAL, est destinée au dépôt et à la diffusion de documents scientifiques de niveau recherche, publiés ou non, émanant des établissements d’enseignement et de recherche français ou étrangers, des laboratoires publics ou privés.
On the joint use of a Structural Signature and a Galois
Lattice Classifier for Symbol Recognition
Mickaël Coustaty, Stéphanie Guillas, Muriel Visani, Karell Bertet, Jean-Marc
Ogier
To cite this version:
Mickaël Coustaty, Stéphanie Guillas, Muriel Visani, Karell Bertet, Jean-Marc Ogier. On the joint use of a Structural Signature and a Galois Lattice Classifier for Symbol Recognition. Liu Wenyin, Josep Llados, Jean-Marc Ogier. Graphics Recognition. Recent Advances and New Opportunities: 7th International Workshop, GREC 2007, Curitiba, Brazil, September 20-21, 2007, Selected Papers, Springer-Verlag, pp.61-70, 2008, LNCS - Volume 5046, �10.1007/978-3-540-88188-9_7�. �hal-00382077�
On the joint use of a Structural Signature and a Galois
Lattice Classifier for Symbol Recognition
Micka¨el Coustaty, St´ephanie Guillas, Muriel Visani, Karell Bertet and Jean-Marc Ogier
L3I, University of La Rochelle, av M. Cr´epeau, 17042 La Rochelle Cedex 1, France, E-mail:
{mcoustat, sguillas, mvisani, kbertet, jmogier}@univ-lr.fr
Abstract. In this paper, we propose a new approach for symbol recognition
us-ing structural signatures and a Galois Lattice as classifier. The structural signa-tures are based on topological graphs computed from segments which are ex-tracted from the symbol images by using an adapted Hough transform. These structural signatures, which can be seen as dynamic paths which carry high level information, are robust towards various transformations. They are classified by using a Galois Lattice as a classifier. The performances of the proposed approach are evaluated on the GREC03 symbol database and the experimental results we obtain are encouraging.
Keywords: Symbol recognition, Concept lattice, Structural signature, Hough trans-form, Topological relation
1 Introduction
This paper deals with the symbol recognition problem. The literature is very abundant in this domain [1, 5, 12, 13]. Symbol recognition can be basically de-fined as a two-step process: signature extraction and classification. Signature ex-traction can be achieved by using statistical-based methods or syntactic/structural approaches while most of the statistical-based methods use the pixels distribu-tion. Syntactic and structural approaches are generally based on a characteri-zation of elementary primitives. These primitives (basic description, relations, spatial organization, . . . ) are extracted from the symbols. They are generally coupled with probabilistic or connexionist classifiers. In this paper, a new ap-proach for symbol recognition is introduced. It is based on the use of a Ga-lois lattice (also called concept lattice) [3] as a classifier. The combined use of statistical-based signatures and a Galois lattice has already been introduced by Guillas et al. in [7]. Our proposed approach is based on the joint use of struc-tural signatures inspired by the work of Geibel et al. [4] and a Galois lattice classifier. The paper is organized as follows. Section 2 describes the proposed technique. Section 3 gives experimental results. Section 4 provides a conclusion and presents our future work.
2 Description of the Approach
The technique that is introduced in this paper is based on the combined use of structural signatures and of a Galois lattice classifier. The elementary primitives on which are based the structural signature are segments which are extracted by using the Hough transform. For each symbol, we compute a topological graph by describing the spatial organisation of the segments. Then, signatures are con-structed from the topological graphs. Finally, these signatures are classified us-ing a Galois Lattice classifier. Our method is inspired of the work of Geibel et al. [4] but differs from that work on many points. Firstly, we use a Galois lattice instead of a decision tree. Secondly, we do not use the same set of topological relations. Finally, our method is based on a Hough-based segments extraction method from images of symbols while [4] works on chemical compounds and do not use any primitive extractor.
2.1 Segments Extraction
The structural primitives we use for symbol description are segments. The seg-ments extraction method we have implemented is an adaptation of the Hough transform (HT), initially defined in the sixties [9] for line extraction by Hough. Indeed, among the existing methods, the HT is known for its robustness prop-erty [14], especially in the context of noisy symbols images. The HT has been widely used for different purposes in image processing and analysis ([11]). The HT key idea is to project pixels of a given image onto a parametric space where the shapes can be represented in a compact way. This space is used to find curves that can be parameterized like straight lines, polynomials, circles, . . . . Each line in the image corresponds to a peak in the associated Hough space. Therefore, the line extraction problem is solved by processing peak detection.
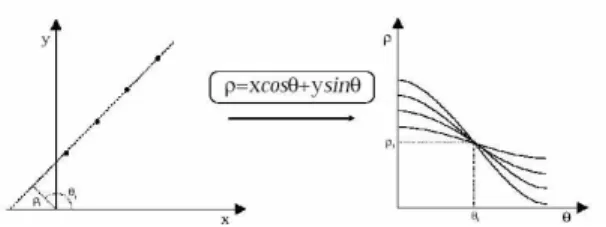
For our purpose we are especially interested in the detection of straight lines. The Figure 1 shows how pixels of an image, represented with their(x, y)
coor-dinates, can be mapped in the Hough space where any straight line of the image is represented by the couple(ρi, θi) of its polar coordinates.
The practical use of the Straight Line Hough Transform (SLHT) raises dif-ferent problems [11]. First of all the HT is of quadratic complexity, it is therefore necessary to use a pre-processing step in order to decrease the number of pix-els to map during the transform. Next, on real-life images, the mapped points produce heterogeneous sine curves in the Hough space and multiple crossing points can appear. So, a peak detection algorithm is needed in order to group these crossing points and to detect their corresponding mean line.
In this paper, we introduce an adapted version of the HT that does not suffer the preceding drawbacks and that is designed to extract segments instead of
Fig. 1. Straight Line Hough Transform (SLHT)
lines. The end points of detected lines cannot be known from the analysis of the Hough space. So, it is necessary to map the lines detected in the Hough space on their corresponding document image in order to achieve the detection process. Based on these considerations an HT-based segments detection system can be divided into four main steps:
1. Reduction of the search space: Characteristic points are to be selected be-fore performing the HT, in order to reduce the number of pixels to map and as a consequence the processing time. In our method, we just use a mean filtering in combination with a skeletonization processing [9].
2. Projection onto the Hough Space: Each of the previously selected point is mapped onto the Hough space. This step corresponds to the process shown in Figure 1. An accumulator array is commonly used during this step in order to record the number of sine curve for a given point in the Hough space. We use the initial HT implementation of [9].
3. Peak detection: It consists in identifying the points in the accumulator as-sociated to a large number of sine curves. Our peak detection algorithm is based on the analysis of the gravity centres of the line sets.
4. Segments extraction: The lines detected in the Hough space are mapped on their corresponding document image in order to extract segments (begin and end points). It consists in detecting sequence of strictly adjacent pixels along the detected line. This is realized by using the Euclidean distances
d(pi, L) between the line L and the crossing points P of the image.
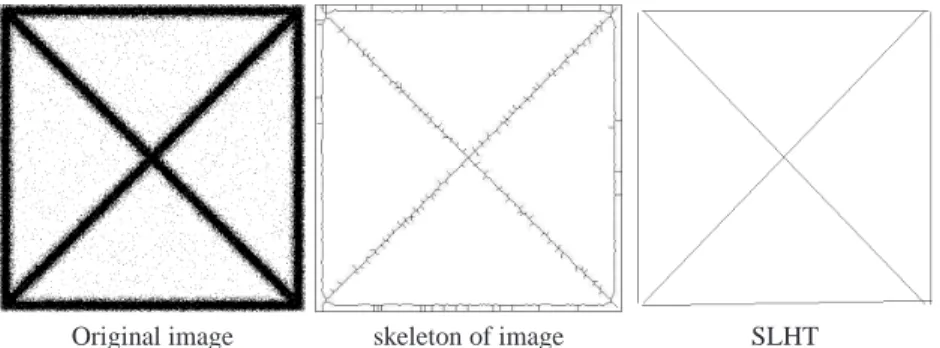
Evaluation of the robustness Our algorithm performs robust extraction of maximal segments. An example of the obtained results is shown in Figure 2. The maximal length of the segments implies a reduction of the possible junc-tions between adjacent segments. Indeed, an ”X” will be described by 2 seg-ments instead of 4.
Original image skeleton of image SLHT
Fig. 2. Examples of diff´erents segments extraction
The Fig.3 shows the robustness of the SLHT. This table shows the recognition rate obtained with different symbols of GREC’03 corpus ([6]). What we call
RecognitionRate here corresponds to percentage of good associations between
symbols tested and models they refer. Those associations were realized from matching distances between segments. The model we attribute to the treated symbol corresponds to the minimal distance. In all the degradation levels we can see that the proposed approach perform a robust segments-based symbols extraction.
2.2 Topological Graph Computation
Description Once the segments are extracted, each topological relation be-tween two segments s and s0is described by the following triplet of information:
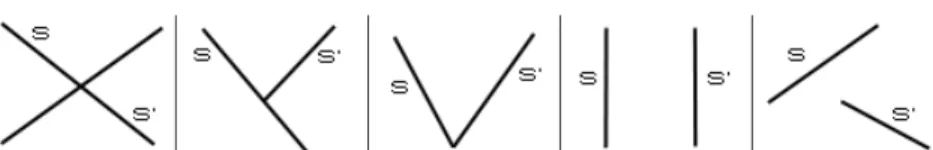
< relation type, relation value, length ratio > (1) – relation type: We use the finite set of relations types X, Y, V, P, O as in [2, 12, 1, 10] to fully describe the possible relations between pairs of segments (see Table 1).
Table 1. The different types of relations we consider (from left to right: X, Y, V, P, O).
– relation value: To be more exhaustive and to discriminate more precisely the relations, we add a value to the relation. This value aims at precising topological relations between segments, such as angle between intersecting segments (available for X, Y, V and O), or distance for parallel segments (relation P).
– length ratio: The last value of each triplet is a ratio between the lengths of the longest and shortest segments of each pair.
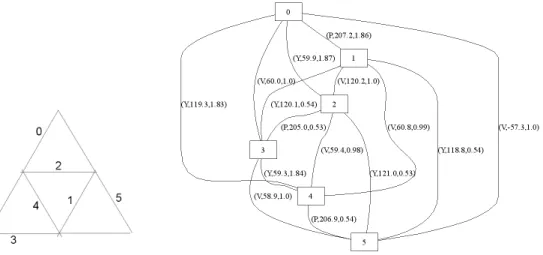
We build a topological graph per symbol where nodes are segments and edges are relations (see Figure 5). The topological graph we obtain is a complete graph where each pair of segments is uniquely described.
In order to reduce the cardinality of the possible triplets ensemble (see Eq. 1), we discretize them. After performing a statistical analysis of the symbol shapes, we choose to limit the set of possible values for the angles of junctions X, Y and V to the following set:{30◦, 45◦, 60◦, 90◦} (possibly, a relation value may be assigned to the closest value in that set). It is also possible to specialize the distances between parallel segments in groups (collinear, near and far for example). The length ratios can be separated into three groups (equal, globally near or very different). We could also consider only the type of relation (or any of the pairs <relation type, relation value> or <relation type, length ratio>), or reduce the set of types of relations we consider.
Fig. 4. Example of extracted
seg-ments Fig. 5. Associated topological graph
Discussion For each symbol, we obtain a set of triplets which fully describes the structural organization of the segments (eg., the relation type differentiates a cross from a rhombus, the relation value a rhombus from a rectangle and the length ratio a rectangle from a square). Moreover, the use of this triplet-based representation has three main advantages:
– each pair of segments is described by one unique triplet;
– each symbol is characterized by one unique and complete graph;
– this description is invariant towards rotation, scale and vectorial distortion. But, this representation also has some drawbacks:
– It does not consider circle arcs
– n2triplets are needed to characterize one symbol (at most n2, where n is the number of segments). This number of triplets can be reduced when using a restriction of the types of relations we consider.
2.3 Computation of the Structural Signatures
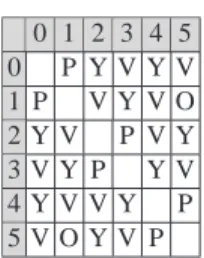
Description The triplets which are extracted from each pair of segments char-acterize the paths of length 1. These paths are equivalently described by the topological graph (see Figure 5) or its associated adjacency matrix (see Table 2), as in [1, 10]. However, paths of length 1 are insufficient for discriminating different types of structures, such as regular shapes (square, rectangle, triangle, . . . ).
0 1 2 3 4 5 0 P Y V Y V 1 P V Y V O 2 Y V P V Y 3 V Y P Y V 4 Y V V Y P 5 V O Y V P
Table 2. Adjacency matrix (M ) associated to the graph of Figure 4 where triplets are only given
by the relation type.
That is why, as in [4], we compute the paths of different lengths by using the adjacency matrix and its powers (see Tables 2 and 3). Let us denote M the adjacency matrix. As M conveys information about paths of length 1, M3 cor-responds to 3-length paths (useful to describe triangles), M4 to 4-length paths (squares and rectangles),. . .
The adjacency matrices we work with are not boolean or integer, so we generalize the usual product of boolean or integer matrices (see Eq. 2) :
∀(i, j) ∈ [0, L]2 , (A × B)ij = L X k=1 (aik× bkj) (2) to the union of string concatenation (see Eq. 3) :
∀(i, j) ∈ [0, L]2 ; (A × B)ij = ( L [ k=1 (aik+ bkj)) (3) where L is the size of the matrix and+ is the string concatenation operator.
Once this product has been computed, we keep only the elementary paths and group the equivalent or symmetric paths. For instance, two equivalent paths XV are grouped as 2×XV and the symmetric paths POV and VOP are grouped as
2×POV. The matrix M2
corresponding to the square of the matrix M (given in Table 2) is provided in Table 3.
Once all the power matrices have been computed, a set of paths (features) of different lengths and their number of occurrences are available. We organize these features in a hierarchical way, as in [12], in order to compute the signature. Indeed, the presence of a 4-length path is more discriminative than the presence of a 1-length path, but the longest paths are the most affected by distortions. For each symbol image, we compute its structural signature by concatenating the
0 1 2 3 4 5 0 4YV 2PV 2YV 2PY 1YY 1VV 2PV 2YV 2PY 1YY 1VV 1 4YV 2PY 1VV 1YY 2PV 2VY 2PY 1VV 1YY 2PV 2VY 2 2PV 2VY 2PY 1VV 1YY 4VY 1YY 1VV 2PY 2VY 2PV 3 2PY 1YY 1VV 2PV 2VY 4VY 2VY 2PV 1VV 1YY 2PY 4 1VY 1YV 2PV 1VV 1YY 2PY 1YY 1VV 2PY 2VY 2PV 4VY 5 1YY 1VV 2PY 2VY 2PV 2VY 2PV 1VV 1YY 2PY 4VY
Table 3. Matrix M2(where M is given in Table 2).
Signature P PV PX PY V VV X XV XX Y YV YX YY Value 2 8 2 10 6 5 3 8 2 8 28 12 11
Table 4. Structural signature of Fig. 4 with paths of length 1 & 2 (only relation type)
type of path and its number of occurrences in the topological graph associated to that symbol.
A lot of paths might be needed to describe a symbol and therefore the sig-natures may be huge and contain much redundant information. That is why we only consider paths of length inferior or equal to 4.
Discussion The structural signatures we obtain are not based on the search for predefined shape templates. Instead, we dynamically compute the shapes observed from our sample images, which confers genericity to our approach. 2.4 Classification
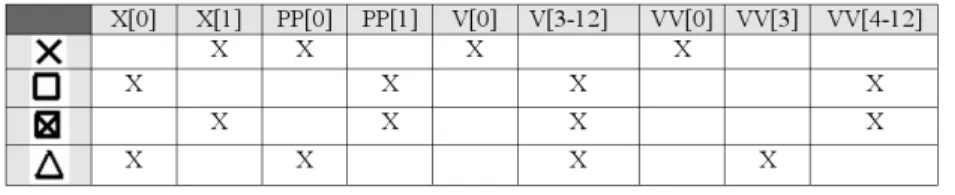
Fig. 6. Example of binary table used for lattice construction
We developed a recognition system named NAVIGALA (NAVIgation into GAlois LAttice), dedicated to noisy symbol recognition [8]. As denoted by its name, this system is based on the use of a Galois lattice as classifier. A Galois
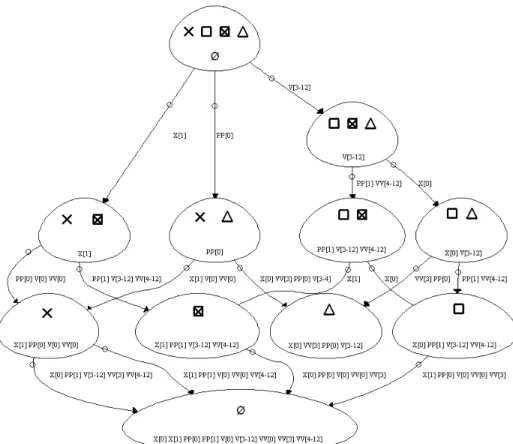
Fig. 7. Example of a concept lattice used for classification.
lattice is a graph which represents, in a structural way, the correspondences be-tween a set of symbols and a set of attributes. These correspondences are given by a binary table (see Figure 6 where each attribute corresponds to an inter-val of occurrences for a given path) where crosses are membership relations. In the Galois lattice, nodes are denoted as concepts and contain a subset of sym-bols and a corresponding subset of attributes and edges represent an inclusion relation between the nodes (see Figure 7). The principle of classification is to navigate through the lattice from the top of the graph to its bottom by validating attributes and thus to reduce the candidates symbols to match. This navigation is similar to the one used for classification with a decision tree. However, in the Galois lattice, several ways are proposed to reach the same node of the graph. We noticed that this property is interesting for noisy symbols because,
experi-mentally, concept lattice is more efficient than decision tree in the presence of noise.
3 Experimental Results
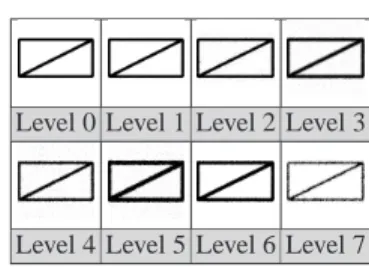
We perform our experiments on the GREC03 database of symbol images [6]. We evaluate the effectiveness of the proposed approach on symbols extracted from 8 classes (see Figure 8) and 9 levels of deterioration (see Figure 9). We use the original symbol, more one symbol per level of deterioration (ie. 10 symbols per class) for training. The recognition results are computed from 72 deteriorated query symbol images per class. Tables 5 and 6 provide the recognition rates we obtain by using a) only the relation types and not the full triplet given in (1) (Table 5) and b) the full triplet (Table 6).
Class 0 Class 1 Class 2 Class 3
Class 4 Class 5 Class 6 Class 7
Fig. 8. 8 classes of symbol used for tests.
Level 0 Level 1 Level 2 Level 3
Level 4 Level 5 Level 6 Level 7
Fig. 9. Different levels of noise for class 0.
Lengths of paths 1 and 2 2 and 3 3 and 4 1, 2 and 3 Recognition rate 85,3% 87,3% 86,1% 87,7% Number of paths 4 50 161 54 Number of attributs 20 25 27 24 Number of concepts 410 533 658 511
Table 5. Experimental results using partial triplets.
For comparison, we perform tests on the same sets of symbols (for learn-ing and recognition) with a method based on the use of statistical signatures (Radon Transform) and a Galois lattice as classifier [7]. The recognition rate we obtain is 98.9%. 14 attributes and 96 concepts were created in the lattice for recognition. We can see that the use of statistical signatures gives a better global recognition rate. But the two approaches can be complementary in some way.
Lengths of paths 1 2 3 4 1 and 2 2 and 3 1, 2 and 3 1, 2, 3 and 4 Recognition rate 96% 86,1% 86,7% 82,6% 95,1% 80,4% 94,4% 95,7% Number of paths 38 175 959 3270 202 1134 1161 4427 Number of attributs 20 22 22 28 20 20 18 16 Number of concepts 452 577 1475 9077 410 689 214 140
Table 6. Experimental results using full triplets.
For example, for the symbols from class 6, statistical signature leads to confu-sions with classes 0 or 3. Using the structural signatures, we recognize symbols from class 6 without any ambiguity with classes 0 and 3 (with a structural sig-nature, for class 6 two symbols among 81 are misclassified). We can infer from these results that these two signatures may be combined in order to improve the performances. We are actually working on an iterative combination of statistical and structural signatures to enhance the performances of the proposed approach.
4 Conclusion and Future Work
In this paper, we propose a new structural signature dedicated to symbol recog-nition using a Galois lattice as classifier. This structural signature relies on seg-ments extracted by using an adapted Hough transform. The structural signature extraction is in 2 main steps. First, for each symbol, we compute a topologi-cal graph to describe the spatial organization of the segments. Then, from these topological graphs, we can extract the structural signature by counting the num-ber of occurrences of each path of the graphs. The signatures are further clas-sified by using a Galois Lattice classifier. The experiments we perform on the GREC03 database show the robustness of the proposed approach towards var-ious sources of noise. The structural signatures we obtain are not based on the search for predefined shape templates. Instead, we dynamically compute the shapes observed from our sample images, which confers genericity to our ap-proach.
In order to ameliorate this structural signature, we are further working on the extraction of circle/ellipse arcs and on their integration into our structural signa-ture. Next, we aim at evaluating the performances of the proposed approach not only on single symbols, but in real-life applications. Finally, a procedure based on an iterative combination of statistical and structural signatures may enhance the performances of the proposed approach.
References
1. P. Dosch and J. Llad´os. Vectorial Signatures for Symbol Discrimination, volume 3088 of LNCS, pages 154–165. Springer Berlin / Heidelberg, 2004.
2. A. Etemadi, J.-P. Schmidt, G. Matas, J. Illingworth, and J. Kittler. Low-Level Grouping of Straight Line Segments. British Machine Vision Conference, 1991.
3. B. Ganter and R. Wille. Formal Concept Analysis. Springer Berlin / Heidelberg, 1999. 4. P. Geibel and F. Wysotzki. Learning Relational Concepts with Decision Trees. In L. Saitta,
editor, Machine Learning: Proceedings of the Thirteenth International Conference, pages 166–174, San Fransisco, 1996. Morgan Kaufmann Publishers.
5. P. Geibel and F. Wysotzki. Learning relationnal concepts with decision trees. ECAI 96. 12th European Conference on Artificial Intelligence, 1996.
6. GREC03 Database (Graphics RECognition). www.cvc.uab.es/grec2003/symreccontest/index.htm. 7. S. Guillas, K. Bertet, and J.-M. Ogier. A Generic Description of the Concept Lattices’
Classifier: Application to Symbol Recognition. In Graphics Recognition: Ten Years Review and Future Perspectives - Selected papers from GREC’05, 2006.
8. S. Guillas, K. Bertet, and J.-M. Ogier. Reconnaissance de Symboles Bruit´es `a l’Aide d’un Treillis de Galois. Colloque International Francophone sur l’Ecrit et le Document, pages 85–90, 18-21 septembre 2006.
9. P. Hough. Machine Analysis of Bubble Chamber Pictures. In International Conference on High Energy Accelerators and Instrumentation, pages 554–556, 1959.
10. Q. Iqbal and J. Aggarwal. Retrieval by Classification of Images Containing Large Manmade Objects Using Perceptual Grouping. In Pattern recognition, volume 35, pages 1463–1479, 2002.
11. V. F. Leavers. Survey: which hough transform. Computer Vision and Image Understanding (CVIU), 58(2):250–264, 1993.
12. M. Rusi˜nol and J. Llad´os. Symbol Spotting in Technical Drawings Using Vectorial Signa-tures. In L. Wenyin and J. Llad´os, editors, Graphics Recognition: Ten years Review and Future Perspectives - Selected papers from GREC’05, volume 3926, pages 35–45. LNCS, 2006.
13. K. Tombre and B. Lamiroy. Graphics Recognition - from Re-engineering to Retrieval. Pro-ceedings of ICDAR, 2003.
14. L. Wenyin and D. Dori. From Raster to Vectors : Extracting Visual Information from Line Drawings. Pattern Analysis and Applications (PAA), 2(2):10–21, 1999.