Publisher’s version / Version de l'éditeur:
Proceedings 18th International Conference on Port and Ocean Engineering under Arctic Conditions, POAC'05, 2, pp. 693-703, 2005
READ THESE TERMS AND CONDITIONS CAREFULLY BEFORE USING THIS WEBSITE.
https://nrc-publications.canada.ca/eng/copyright
Vous avez des questions? Nous pouvons vous aider. Pour communiquer directement avec un auteur, consultez la première page de la revue dans laquelle son article a été publié afin de trouver ses coordonnées. Si vous n’arrivez pas à les repérer, communiquez avec nous à [email protected].
Questions? Contact the NRC Publications Archive team at
[email protected]. If you wish to email the authors directly, please see the first page of the publication for their contact information.
NRC Publications Archive
Archives des publications du CNRC
This publication could be one of several versions: author’s original, accepted manuscript or the publisher’s version. / La version de cette publication peut être l’une des suivantes : la version prépublication de l’auteur, la version acceptée du manuscrit ou la version de l’éditeur.
Access and use of this website and the material on it are subject to the Terms and Conditions set forth at A Methodology to Evaluate Canada's Arctic Shipping Regulations.
Kubat, Ivana; Collins, Anne; Gorman, B.; Timco, Garry
https://publications-cnrc.canada.ca/fra/droits
L’accès à ce site Web et l’utilisation de son contenu sont assujettis aux conditions présentées dans le site LISEZ CES CONDITIONS ATTENTIVEMENT AVANT D’UTILISER CE SITE WEB.
NRC Publications Record / Notice d'Archives des publications de CNRC:
https://nrc-publications.canada.ca/eng/view/object/?id=c0bfc51e-0fee-4e2d-9b57-39a7ac8ff0bf https://publications-cnrc.canada.ca/fra/voir/objet/?id=c0bfc51e-0fee-4e2d-9b57-39a7ac8ff0bf
Proceedings 18th International Conference on Port and Ocean Engineering under Arctic Conditions, POAC’05 Vol. 2, pp 693-703, Potsdam, NY, USA, 2005.
A METHODOLOGY TO EVALUATE CANADA’S ARCTIC SHIPPING REGULATIONS
I. Kubat1, A.Collins1, B.Gorman2, and G.W. Timco1 1
Canadian Hydraulics Centre, NRC, Ottawa, ON, K1A 0R6, Canada 2
Enfotec, Ottawa, ON, K1T 2J7, Canada
ABSTRACT
Transport Canada has the responsibility for regulating Arctic shipping in Canada as part of the Arctic Shipping Pollution Prevention Regulations. A Zone-Date System (ZDS) is used North of the 60° latitude. The ZDS is based on historical data of ice conditions up to the early 1970’s and on the premise that the ice conditions are consistent from year-to-year. The ZDS consists of sixteen of geographic regions (Zones) and an associated Table that indicates the dates that each class of vessel is allowed in each geographical region. The Arctic Ice Regime Shipping System (AIRSS) is used by vessels wishing to access the Arctic Control Zones outside permissible dates for the vessels. The AIRSS, in contrast, allows shipping based on the actual, not historical, ice conditions.
The objective of this study was to find how climate change would influence the veracity of the Zones and Dates used in the ZDS. This paper presents a methodology to evaluate Canada’s Arctic shipping Regulations. The methodology comprises of analyzing the ice conditions in the North West Passage (NWP) shipping lanes and the access routes to the Port of Churchill in Hudson Strait. The existing and potential changes to ice regimes in the NWP and Hudson Strait shipping lanes due to the seasonal temperature variations and due to impact of climate change are examined. The length of the shipping season in the NWP and Hudson Strait is analyzed for each Zone by both the ZDS and the AIRSS, and both systems are then compared.
CLIMATE CHANGE STUDIES IN THE ARCTIC
Many studies investigating the climate trend have been done. The majority of them indicate that the perennial sea ice cover in the Arctic is declining. Comiso (2002)
points out that the satellite data from 1978 to 2000 indicate a decline in sea ice cover in the Arctic as 9% per decade. Cavalieri et al. (1997) analyzed passive microwave satellite observations from 1978 to 1996 and found that the sea ice cover in the Arctic decreased by 3% per decade. The 3% per decade reduction in ice extents has also been reported for the Arctic Ocean with the greatest reduction occurring during the spring and summer period (Parkinson et al. 1999). Zhang et al (2000) show a warming trend for the fall season across the Queen Elizabeth Islands in daily maximum and daily minimum temperatures for the period from 1950-1998. Flato and Brown (1996) investigated the sensitivity of landfast ice to potential climate change and found that warming causes a decrease in maximum ice thickness and an increase in the length of the open water season. Rothrock et al. (1999) analyzed and compared ice draft measurements obtained from submarine cruises between 1958-1976 and 1990. They found that ice draft in 1990 is over one metre thinner than that measured between 1958 and 1976. They also found a declining trend at a rate of 0.1 m per year between years 1990 and 1993-1997. Dumas et al (2004) used meteorological data from Tuktoyaktuk station and a one-dimensional thermodynamic sea ice model (Flato and Brown, 1996) for simulating the ice thickness and land-fast ice duration under possible climate change scenarios. He found that the annual temperature increase of 4°C would decrease the ice duration by 3 weeks. The most complete work in context of the Canadian north is the analysis of ice conditions by the Canadian Ice Service over the period 1969-2001 (Falkingham et al. 2002). They also found there is a trend in ice cover decrease and increase in the length of the shipping season.
A number of studies exist, which indicate that there is apparent trend in first-year (FY) ice melt in the Canadian Arctic Archipelago. FY ice melt will allow more multi-year (MY) ice reaching the NWP and the Beaufort Sea pack ice shifting south. This scenario will make shipping in the NWP equivalently challenging and hazardous to nowadays even if the climate warms (Wilson et al 2004, Howel and Yackel 2004, Melling 2002, Falkingham et al. 2001).
The existing work suggests that the climate change will influence the ice conditions in the Canadian Arctic shipping lanes. The volume of vessel traffic and vessel speed will increase with the predicted ice cover extent decrease, which will result in higher potential for vessel damage and pollution.
REGULATORY SHIPPING SYSTEMS
Transport Canada has the responsibility for regulating Arctic shipping in Canada as part of the Arctic Shipping Pollution Prevention Regulations. This is done using a Zone-Date System (ZDS), which is based on the premise that nature is consistent from year-to-year. It consists of sixteen geographic regions (Zones) and an associated Table that indicates the dates that each class of vessel is allowed in each geographical region. The severity of ice conditions in the Zones is determined by a number assigned to each Zone, having the most severe Zone numbered 1 and the least severe
Zone numbered 16 (Figure 1). The Zones and Dates are based on historical data on ice conditions up to early 1970’s. The ZDS is described in detail in ASPPR 1989. Climate change could have a significant influence on the veracity of the Zones and Dates.
Transport Canada, in consultation with Stakeholders, has made extensive revisions to the Regulations through the introduction of the Ice Regime System (ASPPR 1989; Canadian Gazette 1996; Equivalent Standards 1995; AIRSS 1996). The changes are designed to reduce the risk of structural damage to ships which could lead to the release of pollution into the environment, yet provide the necessary flexibility to Shipowners by making use of actual ice conditions, as seen by the Master to determine transit. Arctic Ice Regime Shipping System (AIRSS) is a Regulatory Standard of the ASPPR. It allows shipping based on the actual, not historical, ice conditions. At the present time, it is used exclusively outside the ZDS (i.e. for the access of the Arctic Control Zones outside permissible dates for vessel), with special requirements for its use.
In AIRSS, each vessel is assessed and assigned to a Vessel Class, which reflects the vessel’s strength and displacement. Risk of damage to a vessel is taken into account using Ice Multipliers given by a Table of Ice Multipliers. Ice Multipliers are different for different class of vessels and different ice types. The values of the Ice Multipliers are adjusted to take into account the decay or ridging. The AIRSS is based on a simple arithmetic calculation that produces an “Ice Numeral” that combines the ice regime and the vessel’s ability to navigate safely in that region. The Ice Numeral (IN) is based on the quantity of hazardous ice with respect to the ASPPR classification of the vessel. If the Ice Numeral is negative, the ship is not allowed to proceed into the ice regime and it must find an alternate route. However, if the Ice Numeral is zero or positive, the ship is allowed to proceed. Table of Ice Multipliers and description of IN calculation can be found in AIRSS (1996).
Canadian Hydraulics Centre was asked by Transport Canada to put the AIRSS on a scientific basis. As a part of that project a number of factors that could affect the Ice Numeral were examined. Four different methods that could improve the AIRSS are described in details in Timco and Kubat (2002). The methods were discussed with the Regulators, Ship Operators and Captains (Timco et. al., 2004). Based on discussions, the modified approach to AIRSS was found the most suitable. In this approach, the existing Table of Multipliers would be used and a bonus of +1 would be given to the Ice Multipliers of first-year ice for vessels of Type B class and higher if three conditions are fulfilled: Master with a certain number of years of experience, very good ice detection equipment, and summer (low strength) ice conditions. An analysis of data obtained from Fednav vessels (Timco et al. 2004, 2005) supports this approach, i.e. the fact that the operators with well-equipped ice-strengthened vessels, experienced Masters and reliable navigation equipment should be rewarded.
This paper presents new methodology developed to analyze the impact of climate change and/or seasonal temperature variation on the veracity of the Zones and Dates used in the ZDS. The study focuses on the portion of the Canadian Arctic that covers the Northwest Passage as well as the access to the port of Churchill through Hudson Strait. The analysis examines the existing and potential changes to ice regimes in the NWP and Hudson Strait shipping lanes due to the climate change. The length of the shipping season for colder than normal and warmer than normal summers is analyzed for each Zone by both the ZDS and the AIRSS. Both systems are then compared.
ANALYSIS
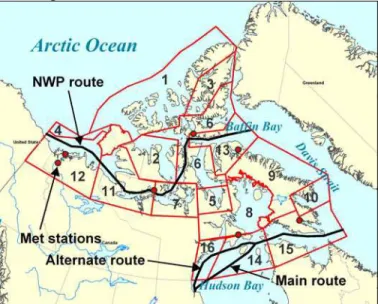
Seven meteorological stations (Tuktoyaktuk, Inuvik, Cambridge Bay, Resolute, Pond Inlet, Iqaluit, and Coral Harbour) representing the communities that lie along the Northwest Passage and in the approaches to Churchill were selected as locations where historical weather data have been collected. These were used to identify the changes that have occurred in the regions over the past 30 years (1968-2004). The stations are shown in Figure 1.
Figure 1: Shipping Safety Control Zones in Canada, Meteorological Stations used for Air Temperature Analysis (from left on NWP route: Inuvik, Tuktoyaktuk,
Campbridge Bay, Resolute, Pond Inlet; from left in Hudson Strait: Coral Harbour, Iqaluit), and Shipping Routes in Northwest Passage and in Hudson Strait
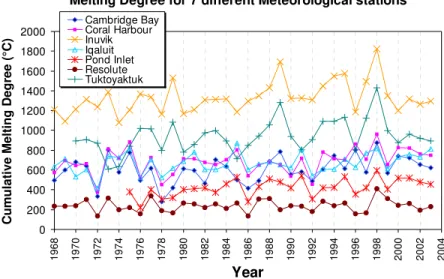
Daily air temperatures measured at the met stations were supplied from the Canadian Ice Service. The files contain information on daily minimum, maximum and mean (average) temperature. Since the files don’t include sufficiently detailed data that could have been analyzed on hourly basis, a “melting degree” approach was used as the indicator for ice melt. The melting degree (MD) was calculated as the reported average temperature greater than or equal to 0°C for each day throughout the year. The cumulative melting degree (CMD) was calculated as a sum of melting degrees for each individual year and was plotted over the 30-year range for each station
(Figure 2). The average annual CMD was calculated for the whole Arctic (represented by an average CMD of the seven met stations) and plotted in Figure 3. As can be seen, there is high inter annual variability in CMD for both the individual stations and the whole Arctic. The high degree of variability from one summer to the next has important implications to marine operations in the Canadian Arctic as ice conditions encountered from one year to the next can also be highly variable. To investigate the effect this inter annual variability has on the Zone-Date system for the Northwest Passage, representative “colder than normal” and “warmer than normal” summers across the control zones that compose the Northwest Passage as well as the access routes to the Port of Churchill in Hudson Strait were selected. The warmer than normal summer would also be representative of a warmer Arctic in the future in the climate conditions with warming trend. Years 1986 (cold year) and 1998 (warm year) were selected for the NWP, and years 1992 (cold year) and 1998 (warm year) for Hudson Strait.
The shipping routes in the NWP and Hudson Strait were defined as ‘arcs’ or lines based on actual navigation route coordinates (Figure 1). These lines (trajectories) were buffered into 1 km wide polygons using ArcView GIS software. The trajectories have associated data attribute tables in ArcView consisting of fields describing the location of the trajectory (NWP East, NWP West, Hudson Strait, Hudson Bay Main route, Hudson Bay Alternate Route) and the Zone number. It should be noted that the route remained fixed over all years of the analysis and no attempt was made to adjust the route to avoid ice. Such adjustment would have increased the complexity and difficulty of the analysis. In any case, the use of ice information and appropriate route planning is not a requirement of the Zone-Date component of ASPPR.
Melting Degree for 7 different Meteorological stations
0 200 400 600 800 1000 1200 1400 1600 1800 2000 1968 1970 1972 1974 1976 1978 1980 1982 1984 1986 1988 1990 1992 1994 1996 1998 2000 2002 2004 Year Cumul a ti ve Mel ti ng Degree (° C) Cambridge Bay Coral Harbour Inuvik Iqaluit Pond Inlet Resolute Tuktoyaktuk
Figure 2: Cumulative Melting Degree (CMD, calculated as Cumulative Air Temperature above 0°C) from selected Met Stations (year 1968 – 2004)
Average CMD over the whole Canadian Arctic y = 3.0176x - 5398.9 R2 = 0.1714 0.0 100.0 200.0 300.0 400.0 500.0 600.0 700.0 800.0 900.0 1965 1970 1975 1980 1985 1990 1995 2000 2005 Year
Cumulative Melting Degree (°C)
W ithout Tuk and Pond Inlet
Without Pond Inlet
Figure 3: Cumulative Melting Degree (CMD, calculated as Cumulative Air Temperature above 0°C) averaged over the Canadian Arctic
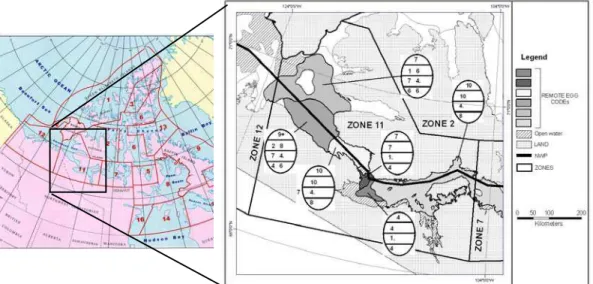
Digital Regional weekly ice charts from the Canadian Ice Service (CIS) were also imported into ArcView and intersected with the trajectory maps (layers). The resulting layers’ data attribute table contains attributes from both maps. Figure 4 shows an example of the route crossing six different ice regimes in one Zone (Zone11). The Ice Numerals (IN) for Type B ice class vessel were calculated for each ice regime the shipping route crossed based on the ice information obtained from the egg code.
Figure 4: Northwest Passage route crossing six different ice regimes within Zone 11 The IN calculated throughout the whole year were compared to the Entry and Exit dates of the appropriate Zone. The ASPPR Type B ice class vessel was selected since this is the lowest ice class vessel allowed passage through all Control Zones that
compose the Northwest Passage (Zones 12, 11, 7, 6, and 13). Table 1 shows Entry and Exit dates for Type B vessel as per the Zone-Date System. Zones 1, 2 and 5 do not allow access to Type B vessels, but since these Zones may also fall into the route plan of a vessel crossing the Northwest Passage they were analyzed as well. The IN calculations are based on the ice charts, which do not indicate ridging or decay, so neither ridging nor decay is reflected in the IN values. Satellite images were used to analyze and explain the ice movement and any peculiarities in results, for example a sudden drop in the IN value.
Table 1: Zone-Date Table for Type B vessel (Entry and Exit dates) Zone No. 1 2 3 4 5 6 7 8 9 10 11 12 13 14 15 16 Entry Date - - Aug 20 Aug 20 - Aug 25 Aug 10 Aug 10 Aug 10 Aug 1 July 15 July 1 July 15 July 1 July 1 June 20 Exit Date Sept 5 Sept 15 Sept 30 Oct 15 Oct 31 Oct 31 Oct 31 Oct 20 Oct 25 Oct 15 Nov 30 Nov 30 Nov 10
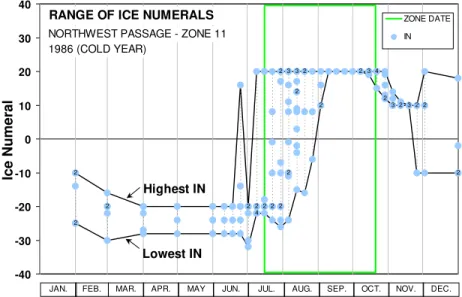
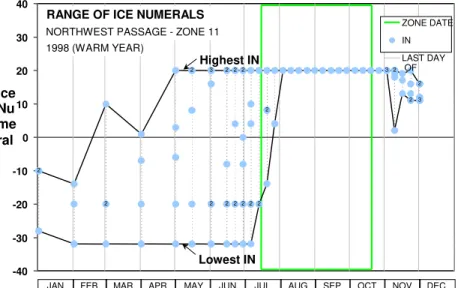
The example of analysis in comparing the two systems is shown in Figures 5 to 8. Figures 5 and 6 show the range of Ice Numerals in Zone 11 for cold and warm years, respectively. The circles represent the Ice Numerals calculated from the CIS ice charts. The Regional ice charts for the Canadian Arctic are issued monthly in winter/spring season and weekly in summer/fall season. The lowest values of Ice Numerals and the highest values of Ice Numerals are connected by a line to highlight the range of Ice Numerals throughout the whole year. In some instances the values of Ice Numerals are superimposed; therefore a number indicating a count of Ice Numerals at that particular value was printed on the circle. Circles without numbers represent a single Ice Numeral for that particular value.
2 2 2 3 2 3 2 4 3 2 2 2 3 2 3 2 2 2 2 2 2 4 2 2 2 2 -40 -30 -20 -10 0 10 20 30 40 Ice Numeral ZONE DATE IN
JAN. FEB. MAR. APR. MAY JUN. JUL. AUG. SEP. OCT. NOV. DEC.
RANGE OF ICE NUMERALS
NORTHWEST PASSAGE - ZONE 11 1986 (COLD YEAR)
Highest IN
Lowest IN
Figure 5: Range of Ice Numerals calculated from CIS ice charts for NWP shipping route in Zone 11, throughout year 1986 (colder than normal in period 1968-2004)
2 3 2 2 3 2 2 2 2 2 2 2 2 2 3 2 2 2 2 -40 -30 -20 -10 0 10 20 30 40 Ice Nu me ral ZONE DATE IN LAST DAY OF
JAN. FEB. MAR. APR. MAY JUN. JUL. AUG. SEP. OCT. NOV. DEC.
RANGE OF ICE NUMERALS
NORTHWEST PASSAGE - ZONE 11 1998 (WARM YEAR)
Highest IN
Lowest IN
Figure 6: Range of Ice Numerals Calculated from CIS ice charts for NWP shipping route in Zone 11, throughout year 1998 (warmer than normal in period 1968-2004) Data shown in Figures 5 and 6 are further analyzed in Figures 7 and 8, respectively. These Figures (7 and 8) show a count of negative and positive Ice Numerals for cold and warm years, respectively. The purpose of this plot is to illustrate the number of positive (passage allowed) or negative (passage restricted) Ice Numerals. Triangle symbol represents the number of ice regimes for which the Ice Numeral was negative. Square symbol represents the number of ice regimes for which the Ice Numeral was positive. The negative and positive counts are connected by lines for better visual observation and easier comparison with the Zone-Date window (bold rectangle indicating the shipping season for Type B vessel in the Zone 11).
0 2 4 6 8 10 12 14 16 18 20 CO UNT NEGATIVE POSITIVE ZONE DATE
JAN. FEB. MAR. APR. MAY JUN. JUL. AUG. SEP. OCT. NOV. DEC. COUNT OF ICE NUMERALS
NORTHWEST PASSAGE - ZONE 11 1986 (COLD YEAR)
Figure 7: Count of negative and positive Ice Numerals calculated from data plotted in Figure 5 - NWP shipping route in Zone 11, throughout year 1986 (colder than normal in period 1968-2004)
0 2 4 6 8 10 12 14 16 18 20 COUNT NEGATIVE POSITIVE ZONE DATE
JAN. FEB. MAR. APR. MAY JUN. JUL. AUG. SEP. OCT. NOV. DEC. COUNT OF ICE NUMERALS
NORTHWEST PASSAGE - ZONE 11 1998 (WARM YEAR)
Figure 8: Count of negative and positive Ice Numerals calculated from data plotted in Figure 6 - NWP shipping route in Zone 11, throughout year 1998 (warmer than normal in period 1968-2004)
Zone 11 covers the portion of the Northwest Passage that includes Amundsen and Coronation Gulfs. The analysis of data plotted in Figures 5 to 8 showed that negative Ice Numerals are encountered early in the Type B season for both colder as well as warmer than normal summers in Zone 11. This stems from the fact that the season for a Type B vessel in Zone 11 starts prior to the completion of melt of the thick first year ice and old ice in Amundsen Gulf in July and early August. However, positive numerals are maintained in both the cool and warm summers well into November, more than a month beyond the Type B closing. This is because the limiting ice type of medium first year ice does not form in Amundsen Gulf until late November. The analysis suggests shifting the opening and closing dates to early August to Mid-November for a Type B vessel in Zone11.
Similar analysis was done for each Zone of the NWP route and the access routes to the Port of Churchill in Hudson Strait. The results will be published in the Final Report prepared for the Climate Change Action Fund in October 2005.
CONCLUSIONS AND RECOMMENDATIONS
A methodology have been developed to compare and analyze two regulatory shipping systems, Zone-Date System and AIRSS, across the control zones that compose the Northwest Passage and the access routes to the Port of Churchill in Hudson Strait. In this analysis, two years were investigated representing colder than normal and warmer than normal summers in the period between 1968 and 2004. This analysis has, for the first time, allowed a direct comparison of the two systems.
The present analysis uses the existing AIRSS definition of the Ice Numeral, but it could not include influence of ridging and decay. The research described by Timco et al (2004, 2005) provides an Ice Regime System that is more scientifically accurate. It would be possible to use this modified approach to verify Zone-Date System. The modified approach takes into account decay and rewards the ice-strengthened vessels with reliable navigation equipment and experienced Masters. All years for which the CIS ice charts are available could be included in the analysis. Such comprehensive analysis will provide a quantitative information on the impact of climate change on the Zones and Dates in the Zone/Date System and will be a good basis for providing advise to the Transport Canada on the likelihood of the need for regulatory changes due to climate change
ACKNOWLEDGEMENT
The authors would like to acknowledge the support of Climate Change Impacts and Adaptation Directorate, the PERD Northern POL, and Transport Canada for funding this study. The authors would also like to thank Katherine Wilson of the Canadian Ice Service for supplying the ice thickness and ice temperature data from meteorological stations.
REFERENCES
ASPPR, 1989. Proposals for the Revision of the Arctic Shipping Pollution Prevention Regulations. Transport Canada Report TP 9981, Ottawa. Ont., Canada.
Canadian Gazette, 1996. Regulations Amending the Arctic Shipping Pollution Prevention Regulations. p 1729, Ottawa, Ont., Canada.
Cavalieri, D.J., Gloersen, P., Parkinson, C.L., Comiso, J.C., and Zvally, H.J., 1997. Observed Hemispheric Asymetry in Global Sea Ice Changes. Science. Vol. 278, pp.1104-1106.
Comiso, J.C., 2002. A Rapidly Declining Perennial Sea Ice Cover in the Arctic. Geophysical Research Letters. Vol.29, No.20, pp.17-1 – 17-4.
Dumas, J., Carmack, E., and Melling, H., 2004. Climate Change Impacts on the Beaufort Shelf Land-fast Ice. Cold Regions Science and Technology. (In press) Equivalent Standards for the Construction of the Arctic Class Ships, 1995. Transport
Canada Report TP-12260, Ottawa, Ont., Canada.
Falkingham, J.C., Chagnon, R., and McCourt, S., 2001. Sea Ice in the Canadian Arctic in the 21st Century. Proceedings 16th International Conference on Port and Ocean Engineering under Arctic Conditions, pp 1191-1200, Ottawa, Ontario, Canada.
Falkingham, J.C., Chagnon, R., and McCourt, S., 2002. Trends in Sea Ice in the Canadian Arctic. Proceedings 16th IAHR International Symposium on Sea Ice. Vol.1, pp 352-359. Dunedin, New Zealand.
Flato, G.M., and Brown, R.D., 1996. Variability and Climate Sensitivity of Land-fast Arctic Sea Ice, Journal of Geophysical Res., Vol.101, No.C10, pp.25,767-25,777.
Howell, S.E.L., and Yackel, J.J. 2004. A Vessel Transit Assessment of Sea-ice Variability in the Western Arctic, 1969-2002: Implications for Ship Navigation. Canadian Journal of Remote Sensing. Vo.30, No.2, pp205-215.
Melling, H. 2002. Sea ice of the Northern Canadian Arctic Archipelago. Journal of Geophysical Research 107(C11), 3181, doi:10.1029/2001JC001102, 21 pp Parkinson, C.L., Cavalieri, D.J., Gloersen, P., Zwally, H.J., and Comiso, J.C. 1999.
Arctic Sea Ice Extents, Areas, and Trends, 1978-1996. Journal of Geophysical Research. Vol.104, NO.C9, pp.20,837-20,856.
Rothrock, D.A., and Maykut, G.A. 1999. Thinning of the Arctic Sea-Ice Cover. Geophysical Research Lettters. Vol.26, NO.23, pp.3469-3472.
Timco, G.W. and Kubat, I. 2002. Scientific Basis for Ice Regime System: Discussion Paper. NRC Report CHC-TR-002, TP 13916E, Ottawa, Ont., Canada.
Timco, G.W., Kubat, I. and M. Johnston. 2004. Scientific Basis for Ice Regime System: Final Report. NRC Report CHC-TR-020, Ottawa, Ont., Canada. Timco, G.W., Kubat, I. and M. Johnston, 2005. Scientific Basis for the Canadian Ice
Regime System. Proceedings 18th International Conference on Port and Ocean Engineering under Arctic Conditions, POAC’05, Potsdam, N.Y.,U.S.A. (in press)
Wilson , K.J., Falkingham, J., Melling, H., and De Abreau, R., 2004. Shipping in the Canadian Arctic, Other Possible Climate Change Scenarios. Proceedings IGARSS International Geoscience and Remote Sensing Symposium, Anchorage, Alaska,
Zhang, X., Vincent, L.A., Hogg, W.D., and Niitsoo A. 2000. Temperature and Precipitation Trends in Canada during the 20th Century. Atmosphere Ocean, 38(3), pp.395-429.