HAL Id: hal-00839520
https://hal.archives-ouvertes.fr/hal-00839520v2
Submitted on 29 Jun 2013
HAL is a multi-disciplinary open access
archive for the deposit and dissemination of
sci-entific research documents, whether they are
pub-lished or not. The documents may come from
teaching and research institutions in France or
abroad, or from public or private research centers.
L’archive ouverte pluridisciplinaire HAL, est
destinée au dépôt et à la diffusion de documents
scientifiques de niveau recherche, publiés ou non,
émanant des établissements d’enseignement et de
recherche français ou étrangers, des laboratoires
publics ou privés.
SOUK: Social Observation of hUman Kinetics
Marc-Olivier Killijian, Matthieu Roy, Gilles Trédan, Christophe Zanon
To cite this version:
Marc-Olivier Killijian, Matthieu Roy, Gilles Trédan, Christophe Zanon. SOUK: Social Observation of
hUman Kinetics. Ubicomp 2013 (2013 ACM International Joint Conference on Pervasive and
Ubiq-uitous Computing), Sep 2013, Zurich, Switzerland. 4p., �10.1145/2493432.2494526�. �hal-00839520v2�
SOUK: Social Observation of hUman Kinetics
∗Marc-Olivier Killijian
Matthieu Roy
Gilles Tr´edan
Christophe Zanon
CNRS, LAAS, 7 avenue du colonel Roche, F-31400 Toulouse, France
Univ de Toulouse, LAAS, F-31400 Toulouse, France
[email protected]
[email protected]
[email protected]
[email protected]
ABSTRACT
Simulating human-centered pervasive systems requires accu-rate assumptions on the behavior of human groups. Recent models consider this behavior as a combination of both so-cial and spatial factors. Yet, establishing accurate traces of human groups is difficult: current techniques capture either positions, or contacts, with a limited accuracy.
In this paper we introduce a new technique to capture such behaviors. The interest of this approach lies in the unprece-dented accuracy at which both positions and orientations of humans, even gathered in a crowd, are captured. From the mobility to the topological connectivity, the open-source framework we developed offers a layered approach that can be tailored, allowing to compare and reason about models and traces.
We introduce a new trace of 50 individuals on which the validity and accuracy of this approach is demonstrated. To showcase the interest of our software pipeline, we compare it against the random waypoint model. Our fine-grained ana-lyzes, that take into account social interactions between users, show that the random waypoint model is not a reasonable ap-proximation of any of the phenomena we observed.
Author Keywords
Human-centered computing, Human mobility modeling.
ACM Classification Keywords
H.1.m Models and principles: Miscellaneous
General Terms
Experimentation; Human Factors; Measurement
INTRODUCTION
During the past few years, the problem of understanding hu-man mobility has received a growing attention from the re-search community. Thanks to the widespread use of mobile
∗
This work has been partially supported by LAAS, CNRS and ANR French national programs AMORES (grant #ANR-11-INSE-010) and MURPHY (grant #ANR-10-BLAN-0306).
Permission to make digital or hard copies of all or part of this work for personal or classroom use is granted without fee provided that copies are not made or distributed for profit or commercial advantage and that copies bear this notice and the full cita-tion on the first page. Copyrights for components of this work owned by others than ACM must be honored. Abstracting with credit is permitted. To copy otherwise, or re-publish, to post on servers or to redistribute to lists, requires prior specific permission and/or a fee. Request permissions from [email protected].
UbiComp’13, September 8–12, 2013, Zurich, Switzerland. Copyright c 2013 ACM 978-1-4503-1770-2/13/09...$15.00. 10.1145/2493432.2494526
handheld devices, large scale datasets have been produced and successfully exploited to characterize human mobility patterns. Applications are multiple: from street planning to epidemics modeling, every hint about how humans move is a powerful ally for designing tomorrow’s information society. Indeed, the users contact model is one of the most crucial parameters of a ubiquitous system that relies on short range communication (SRC). However, available mobility traces are usually coarse grained and do not allow to precisely em-ulate SRC topologies. Contact traces exist, but these are usually established using SRC technologies themselves. The problem of such approaches is genericity: how to simulate a Bluetooth communication topology using an RFID contact trace, and vice-versa? Due to the wide variety of SRC tech-nologies and their rapid evolution, it is of prime importance to establish datasets that are technology independent. The idea that users mobility and social contacts are connected has recently given rise to the development of mobility mod-els taking these two dynamics in consideration. But in the absence of traces capturing both interactions and movements, such models remain only partially validated. One of the fun-damental question that is left unanswered is “what is a good analytical model for crowd connectivity?”, and, as a corol-lary, “how to validate models?”.
To that end, we present SOUK— Spatial Observation of hU-man Kinetics. This platform allows to precisely capture, in real time, both the position and the orientation of individuals in a dense region. To achieve this, each individual is equipped with two lightweight wireless tags that are localized with a 15cm accuracy using a network of sensors. More precisely, we present SOUKas a mean to test the realism of existing and future human mobility models.
Social events (meetings, cocktails, concerts) constitute per-fect use cases for SOUK because of it’s ability to cap-ture users’ localization, orientation and interactions in dense crowds. The dynamic network of social interactions arising during the social event can thus be computed, exposed in real-time and logged for off-line analysis. To the best of our knowledge, this is the first time that both social interactions and movements are assessed at such a granularity and scale. The main contributions of the paper are:
• We introduce SOUK, a platform to capture the behavior of a crowd at an unprecedented scale and resolution. Traces captured using this platform allow to assess both position
and social contacts of individuals, allowing precise simu-lation of any Short Range Communication topology.
• We provide a set of tools to compare models and reality using a wide variety of metrics, in a layered approach. We believe this tool chain could be of prime importance to de-velop realistic models and compare them to reality.
• We showcase our approach by comparing the random way-point model against an experimental deployment of the platform on 50 individuals during a social event.
Although the drawbacks of random waypoint models are already known [11], the comparison is only presented to demonstrate how the proposed approach allows to easily compare a given model against reality.
The paper is organized as follows: the following section dis-cusses related works. Then, we present the SOUK experimen-tal platform. The next section describes an experiment we conducted and associated results. The last section concludes the paper and exposes some trails of future work.
RELATED WORK: A MATTER OF SCALE
Recently, several mobility data collection campaigns have been conducted and published, for instance in the CRAW-DAD project1. These campaigns use off-the-shelf hardware,
such as smartphones, to capture information, thus their local-ization source is either a GPS system or based on wireless interfaces (WiFi or GSM). Compared to the datasets we cap-ture, the major difference lies in the scale: SOUK’s dataset has a smaller scale (i.e., building-wise vs. town-wise, and short term vs. long-term) but provides a higher accuracy (i.e., in the order of 10cm vs. 10 − 100m) and includes users orientation, thus enabling a precise capture of social interactions between users. These two types of datasets are complementary: i) un-derstanding micro-mobility and fine-grained interactions be-tween users requires a highly accurate localization platform, while ii) understanding long-term evolution of systems and recurrent behaviors requires a large scale deployment [1]. The study, and modeling, of the relationship between human mobility and social aspects of human behavior has recently gained a lot of attention. In particular, much effort is spent in developing socially inspired mobility or propagation mod-els [6, 10]. In these works, positioning is not necessarily of primary interest but, rather, access to data concerning con-tacts or proximity between the individuals is necessary. Many different technologies and methods have been used to collect or infer social contacts: Bluetooth and WiFi networks [2,4,7], dead reckoning [8] or RFIDs [3, 10]. The main limitation of these experiments lies in the fact that contacts are inferred when two devices are co-located or in communication range. Accuracy of this inference can be questioned and some inter-actions may be missed.
To the best of our knowledge, this is the first time that such an accurate and precise dataset about both positioning and contacts is produced for a dense population.
1CRAWDAD project:http://crawdad.cs.dartmouth.edu
EXPERIMENTAL PLATFORM
SOUK consists of three parts: i) an experimental platform2 to capture the position and orientation of mobile individuals using a fixed infrastructure of sensors and two wireless Ultra-Wide-Band tags per participant, ii) a framework to develop mobility models, and iii) a software system that exploits the output of either the capture process or model-generated traces. In a nutshell, both mobility models and the experi-mental platform can feed a database that is then accessed by a software pipeline. The use of a database between produc-tion and exploitaproduc-tion of posiproduc-tions ensures the repeatability of experiments, and a certain degree of genericity: any model or positioning system can be used, for real-time exploitation of data or for later off-line analysis.
EXPERIMENTATION AND PRELIMINARY RESULTS
We present here one measurement study that was conducted in 2012 during a reception following the inauguration of a new building. The attendance was a mix of scientists, jour-nalists, and representatives of local institutions. More than 0.6 million position reports were collected. In this experi-ment, we deployed 116 tags, thus equipping 58 out of around 100 participants.
Figure 1. One tag per shoulder
We collected approximately 1.5 hours of data. Any volunteer was provided with a pair of tags, as shown on Fig-ure 1. The room used for experiments is approximately a 10m × 10m square zone. To ensure an accuracy of around 15cm, the system was carefully cali-brated using laser range-finders.
Contacts
Users’ positions and orientations produced by SOUK are ab-stracted by the notion of snapshot, i.e., positioning informa-tion is sampled at regular intervals to provide a clean inter-face to upper software layers. By analyzing snapshots, we can use a device-based model to explore the topology of a system consisting of devices carried by users, or a user-based model to dig into interpersonal relations that took place dur-ing the experiments. Interestdur-ingly, as we show hereafter, the latter has a non negligible impact on the former.
Device-based
The simplest model considers that a and b are attendees’ de-vices and detects whether these are within wireless contact range r. In this case, the simplest approach is to decide upon the distance between them, using a unit disc wireless commu-nication model (i.e. a link is active iff d(a, b) < r).
User-based, cone
Alternatively, one can consider that a and b are attendees and that their awareness is limited by a cone in which social inter-actions can happen. Therefore, each attendee i has a “social cone” of 2×α in front of him, with a range to 2m. Everybody in i’s cone is potentially interacting with i. If j is in i’s cone, and i is in j’s cone, i.e., they face each other, we consider them as interacting with each other.
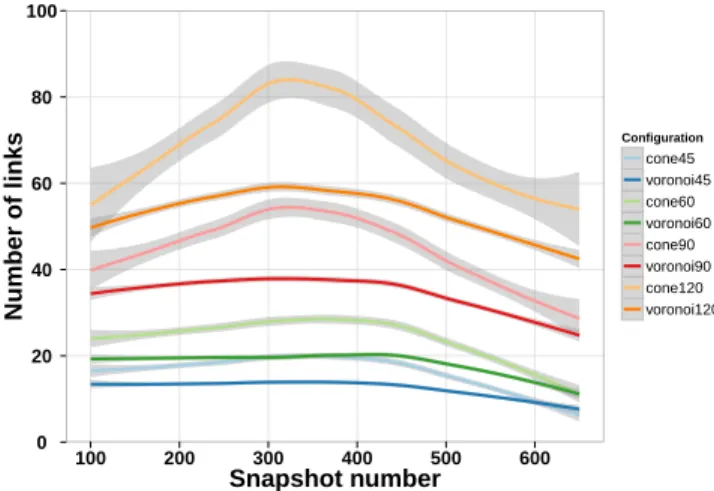
0 20 40 60 80 100 100 200 300 400 500 600 Snapshot number Number of links Configuration cone45 voronoi45 cone60 voronoi60 cone90 voronoi90 cone120 voronoi120
Figure 2. Number of user-based contacts
10 20 30 40 50 100 200 300 400 500 600 Snapshot number Siz e of the bigg est CC rwp 1m ub 1m rwp 1.5m ub 1.5m rwp 2m ub 2m rwp 3m ub 3m
Figure 3. Evolution of the largest connected component size over time -random way point (RWP) vs. user based (UB) - wireless
User-based, Vorono¨ı
The third model we exploit relies on Vorono¨ı diagrams. We first compute the Vorono¨ı cell of each user i (i.e., the poly-gon containing all the points that are closer to i than to any other attendee). Then we consider that i and j are interact-ing if (1) they have neighborinteract-ing cells and (2) they face each other, again with an angle of maximum 2 × α. This approach does not require a “social” distance parameter which is hard to calibrate, as it is affected by both cultural factors and envi-ronmental factors such as local people density, as studied by Hall [5].
Figure 2 illustrates the impact of the contact detection model by representing the number of detected social links over time for both user-based detection techniques. Two main parame-ters impact the number of detected links: the detection strat-egy (cone, or Vorono¨ı) and the maximal deviation angle α. Vorono¨ı and cone detection techniques roughly detect the same amount of links for a fixed α, although Vorono¨ı always detects less links than the cone method. This is probably an impact of the “line-of-sight” effect of Vorono¨ı: consider 3 at-tendees i, j, k on a line, i and k can be in contact using the cone method (provided d(i, k) < 2m) whereas the Vorono¨ı method will never detect an interaction between them. In-terestingly, the Vorono¨ı method leads to a more stable link count over time. The grayed zones around each curve rep-resent the standard deviation of the smoothing applied. This suggests increasing α decreases stability of the results, and that Vorono¨ı method always provides more stable results.
Interactions
Figures 3, 4 and 5 exploit the extracted interactions from a graph perspective by exploring the “knitting” of the structure. Figures 3 and 4 both compare traces obtained from the ex-periment (User-based/UB, dark colors) and from a random waypoint model (RWP, light colors) tailored to copy the ob-served behavior (identical attendee speed, pause duration and pause probability).
Figure 3 represents the evolution of the largest connected component size in the contact graph derived from traces
us-ing various radio ranges. Computus-ing the size of the largest connected component provides an upper bound of the num-ber of devices able to exchange messages using a multi-hop communication scheme at a given moment in time. One can notice a striking difference between results obtained using synthetic and real traces: the size of the largest connected component for synthetic traces is constant over time, and al-ways overestimates the number of connected attendees. This figure also illustrates the dramatic impact of range: above 3m all attendees are connected. A 1m-range never allows to con-nect more than 12 devices, while a 2m-range allows to reach nearly everyone.
Figure 4 presents another striking difference between UB and RWP traces. Recall that the RWP model is parametrized from UB derived statistics. From these traces, we counted the num-ber of wireless contacts made by each pair of devices assum-ing a range of 2m. In other words, we compute the weights of a wireless contact graph for both traces. Figure 4 presents the distribution of these weights. It reads the following: in the UB trace, around 28 devices pairs were in contact be-tween 150 and 160 times. The main difference is that RWP trace provides a (not surprisingly) normal distribution cen-tered around 50, whereas the real trace exhibits a heavy tailed distribution: some devices pair connect very often while some others nearly never connect.
Figure 5 partly explains this striking difference: it represents a layout of the final social interaction graph, when consid-ering only most frequent links, i.e., links that were active at least 50 snapshots —approximately 2.5 minutes. Each link is weighted proportionally to the amount of time its end-points spent together. Colors represent communities, com-puted using a classical community detection algorithm [9]. It is interesting to observe the variety of contact patterns: whereas some attendees only have few but very strong con-nections, e.g., node 39, others have many links of lesser im-portance, like node 7. Modularity, as defined in [9], captures to which extent a graph is organized as interconnected mod-ules. Graphs without structure, i.e., where any two vertices are connected with the same probability, have a 0
modular-0 50 100 150 200 250 0 50 100 150 200 250
Number of contacts within trace
Number of node pair
s
Configuration
ub rwp
Figure 4. Weight distributions of collected contact graphs, user-based (UB) against random waypoint model (RWP), using a 2m range
Figure 5. Layout of the final interaction graph - only most frequent links are represented.
ity, whereas graphs composed of disconnected cliques have a modularity close to 1. The modularity of our social graph is 0.51, which means that the detected communities are signifi-cant: many social links fall within communities and few fall between two different communities.
The conclusion we draw from these two observations is that random waypoint models have no chance of correctly emulat-ing human micro-mobility because they ignore the primordial social dimension of our behavior, even when using a RWP that mimics users observed behaviors. As we move to meet our friends (and avoid our foes) we drastically bias the con-nection pattern of the devices we carry. Even if the limits of random waypoint models are already known, these results showcase the possible use of the SOUKplatform by analyzing the social structure of the underlying interaction network.
CONCLUSION
This paper presents a framework to capture and analyze bility data of crowds, with the long-term goal of refining mo-bility models or deriving new ones. Instead of using raw mobility data or abstract mobility models to test the im-pact of mobility on human-carried devices, we seek to study and characterize crowd mobility using the presented frame-work. We argue this strategy will enable to assess the level of realism and generality of models and traces, allowing to better understand and simulate human-centered Short Range Communication-based systems.
As a first step towards this goal, we present the results ob-tained during the first experimental deployments of the plat-form. To the best of our knowledge the dynamics of such a dense crowd had never been assessed that precisely before. Analysis reveals that crowd behavior is all but random, insist-ing on the need of a better model toolbox to design and test mobility-resilient software systems.
On the practical side, the SOUKplatform, which is fully open source, has been designed as a scalable solution towards anal-ysis of large crowds: although the results presented here are illustrated on an experiment involving 50 persons, both the hardware cost and the complexity of software analysis (using Vorono¨ı-based approach) are linear with respect to the num-ber of tracked individuals.
REFERENCES
1. A. J. Aviv, M. Sherr, M. Blaze, and J. M. Smith. Evading cellular data monitoring with human movement
networks. In USENIX Workshop HotSec, 2010. 2. F. Benbadis, J. Leguay, V. Borrel, M. Amorim, and
T. Friedman. Millipede: a rollerblade positioning system. In Procs. of ACM WiNTECH’06, pages 117–118. ACM, 2006.
3. C. Cattuto, W. Van den Broeck, A. Barrat, V. Colizza, J.-F. Pinton, and A. Vespignani. Dynamics of
person-to-person interactions from distributed rfid sensor networks. PLoS ONE, 5(7), 07 2010. 4. N. Eagle and A. (Sandy) Pentland. Reality mining:
sensing complex social systems. Personal Ubiquitous Comput., 10(4):255–268, Mar. 2006.
5. E. Hall. The hidden dimension. Doubleday Anchor Books. Doubleday, 1966.
6. K. Herrmann. Modeling the sociological aspects of mobility in ad hoc networks. In Procs. of ACM MSWIM’03, pages 128–129. ACM, 2003.
7. P. Hui, A. Chaintreau, J. Scott, R. Gass, J. Crowcroft, and C. Diot. Pocket switched networks and human mobility in conference environments. In Procs. of WDTN’05, pages 244–251. ACM, 2005.
8. D. Kamisaka, T. Watanabe, S. Muramatsu,
A. Kobayashi, and H. Yokoyama. Estimating position relation between two pedestrians using mobile phones. In Procs. of Pervasive Computing’12, pages 307–324. Springer Berlin Heidelberg, 2012.
9. M. Newman and M. Girvan. Finding and evaluating community structure in networks. Phys. review E, 2004. 10. J. Stehl, N. Voirin, A. Barrat, C. Cattuto, L. Isella, J.-F.
Pinton, M. Quaggiotto, W. Van den Broeck, C. Rgis, B. Lina, and P. Vanhems. High-resolution measurements of face-to-face contact patterns in a primary school. PLoS ONE, 6(8), 08 2011.
11. J. Yoon, M. Liu, and B. Noble. Random waypoint considered harmful. In INFOCOM, 2003.