Publisher’s version / Version de l'éditeur:
Vous avez des questions? Nous pouvons vous aider. Pour communiquer directement avec un auteur, consultez la première page de la revue dans laquelle son article a été publié afin de trouver ses coordonnées. Si vous n’arrivez pas à les repérer, communiquez avec nous à [email protected].
Questions? Contact the NRC Publications Archive team at
[email protected]. If you wish to email the authors directly, please see the first page of the publication for their contact information.
https://publications-cnrc.canada.ca/fra/droits
L’accès à ce site Web et l’utilisation de son contenu sont assujettis aux conditions présentées dans le site LISEZ CES CONDITIONS ATTENTIVEMENT AVANT D’UTILISER CE SITE WEB.
Laboratory Memorandum; no. LM-2004-34, 2004
READ THESE TERMS AND CONDITIONS CAREFULLY BEFORE USING THIS WEBSITE.
https://nrc-publications.canada.ca/eng/copyright
NRC Publications Archive Record / Notice des Archives des publications du CNRC : https://nrc-publications.canada.ca/eng/view/object/?id=de61d2e8-121c-49f7-868e-2ec8ac7175ba https://publications-cnrc.canada.ca/fra/voir/objet/?id=de61d2e8-121c-49f7-868e-2ec8ac7175ba
NRC Publications Archive
Archives des publications du CNRC
For the publisher’s version, please access the DOI link below./ Pour consulter la version de l’éditeur, utilisez le lien DOI ci-dessous.
https://doi.org/10.4224/8896115
Access and use of this website and the material on it are subject to the Terms and Conditions set forth at
Qualisys Track Manager: User Manual
National Research Council Canada Institute for Ocean Technology Conseil national de recherches Canada Institut des technologies oc ´eaniques
Laboratory Memorandum
LM-2004-34
Qualisys Track Manager: User Manual
D. Senior
DOCUMENTATION PAGE
REPORT NUMBERLM-2004-34
NRC REPORT NUMBER DATE
17 Dec. 04
REPORT SECURITY CLASSIFICATION
Unclassified
DISTRIBUTION
Unlimited
TITLE
Qualisys Track Manager User Manual
AUTHOR(S)
Dena Senior
CORPORATE AUTHOR(S)/PERFORMING AGENCY(S)
PUBLICATION
SPONSORING AGENCY(S)
Institute for Ocean Technology, National Research Council
IMD PROJECT NUMBER
421018 NRC FILE NUMBER KEY WORDS Linearization, Calibration, QTM PAGES 15+ App FIGS. 6 TABLES App SUMMARY
QTM software is a Windows based application, which takes information provided by ProReflex cameras and generates 2D, 3D, and/or 6 degree of freedom (DOF) data. If 3D or 6DOF data is obtained it can be viewed through a 3D viewing window. At least two cameras must be used in order to obtain 3D or 6DOF data. ProReflex cameras emit IR flashes of light, which are reflected by retro-reflective markers back to the cameras. The cameras recognize markers and relay information to QTM where it is processed and output appropriately. This report is intended as a guide through linearization, calibration, and capturing measurement processes. Error analysis concerning linearization and calibration are discussed within the report, while the set-up procedures are included in appendices. Also, the report describes QTMDAC, which is a modified version of QualiDAC. QTMDAC communicates with QTM and generates an analog output.
ADDRESS National Research Council
Institute for Ocean Technology Arctic Avenue, P. O. Box 12093 St. John's, NL A1B 3T5
National Research Council Conseil national de recherches Canada Canada Institute for Ocean Institut des technologies Technology océaniques
QUALISYS TRACK MANAGER USER MANUAL
LM-2004-34
Dena Senior
TABLE OF CONTENTS
1.0 INTRODUCTION ... 1
2.0 LINEARIZATION ... 2
2.1 Sensitivity Analysis ... 2
3.0 CALIBRATION ... 5
3.1 Calibration Methods ... 5
3.2 Error Messages ... 6
3.3 Test Results... 7
4.0 CAPTURING MEASUREMENTS ... 9
4.1 2D and 3D Motion Capture ... 9
4.2 6DOF Motion Capture ... 11
4.2.1 Capturing 6DOF data ... 11
4.2.2 QTMDAC... 12
5.0 CONCLUSIONS ... 14
... 14
5.1 Recommendations
6.0 REFERENCES ... 15
Appendix A: QTracREADME
Appendix B: CalibrationREADME
Appendix C: Wand Calibration Test Results
Appendix D: QTMDAC Source Code
1.0 INTRODUCTION
An optical tracking system, known as Qualisys, is currently in use at IOT’s testing
facilities. It consists of MacReflex cameras, and two programs QualiDAC (Windows
based software) and Extended Volume Measurement (DOS based software). This
system has certain restrictions; therefore, a new software package known as
Qualisys Track Manager (QTM) will replace the current EVM software and ProReflex
cameras will replace the MacReflex cameras.
QTM software is a Windows based application, which takes information provided by
the camera(s) and generates 2D, 3D, and/or 6 degree of freedom (DOF) data. If 3D
or 6DOF data is obtained it can be viewed through a 3D viewing window. At least
two cameras must be used in order to obtain 3D or 6DOF data.
Both ProReflex and MacReflex cameras emit IR flashes of light, which are reflected
by retro-reflective markers back to the cameras. The cameras recognize markers
and relay information to QTM where it is processed and output appropriately.
QualiDAC software has been modified in order to accommodate the new QTM
software. The ability for QualiDAC to open, close, and communicate over a TCP/IP
connection was added. This required use of the QTMClient DLL. The new revised
QualiDAC software is referred to as QTMDAC.
2.0 LINEARIZATION
Linearization of each camera lens is a delicate and crucial procedure. This
procedure corrects distortion present in each camera lens. If not corrected,
distortion in the lens will cause an inaccurate calibration of the camera and
furthermore measurements taken by the camera will be incorrect. Therefore,
linearization of the lens must be conducted with high precision and accuracy.
In order to linearize camera(s) a program known as QTrac is used along with an
8x10 grid of markers. Once setup to view the grid properly, the camera performs
calculations, which reduce lens distortion. The complete linearization procedure is
available in Appendix A.
2.1 Sensitivity Analysis
One of the sensitivity tests conducted consisted of moving a camera in different
directions off center, then linearizing the camera. The camera was moved either
upwards by 10cm, to the right by 10cm, or away from the grid by 10cm.
Moving the camera either to the right or upwards by 10cm caused a marginal
amount of discrepancy from the essentially ideal linearization position. This was
noticeable around the edges of the lens. However, when the camera was moved
away from the grid by 10cm, the error increased drastically toward the edges of the
lens.
See figure 1.
Figure 1
error_n2: Linearization error produced from the ideal position for camera 1459.
error_back: Linearization error produced from moving camera 1459 away from the
grid by 10cm.
Points 0 to 15 and 80 to 100 contain errors calculated from edges of the lens.
Drastic peaks demonstrate the necessity for accurate camera positioning when
performing linearization.
The other group of sensitivity tests conducted involved varying aperture and focus
settings of the cameras. Changing aperture and focus settings proved to have no
effect on the linearization process. See figure 2.
Figure 2
error_n2: Linearization error produced from the ideal position for camera 1459.
error1, error2, error3, error4, error5, and error6: Linearization errors produced
from varying aperture and focus settings of camera 1459.
3.0 CALIBRATION
In order to track and produce 3D data, at least two cameras must be used and they
must be calibrated. Calibration when producing 2D data is not necessary.
Calibration of cameras takes place after they have been linearized and setup in the
appropriate area. If the cameras are moved to another location or they have been
adjusted in anyway a calibration should take place. Generally, before a
measurement is captured cameras are calibrated. Locations and positions of the
cameras are obtained through this process. Once the coordinate system and
positions of the cameras are established, an accurate and confident measurement
can be captured.
3.1 Calibration Methods
There are three methods of calibration:
1. Wand calibration
2. Frame calibration
3. Fixed camera calibration
Each method is reliable and accurate when performed properly. Calibration errors
can occur if measurements of the wand length, frames, or locations of markers and
cameras are not accurate. Accuracy of each measurement is tremendously
important. For a more detailed discussion of the calibration process see Appendix
B.
3.2 Error Messages
Error messages can occur during the calibration process. These messages include:
• General calibration failure
• Couldn’t find the fourth marker of the L-frame
• Couldn’t find the three markers in line on the L-frame
• One or more of the markers on the L-frame were unstable
Typically when doing a frame or fixed camera calibration, if a “General calibration
failure” occurs, check the calibration settings. If the settings seem to be correct,
make sure the marker measurements and camera locations (fixed camera) are
exact.
The wand calibration method is the most prone to errors. Generally, to avoid error
messages:
1. Use exact wand length and L-frame measurements.
2. Try to move the wand at an appropriate speed. Moving it too quickly will
generate “One or more of the markers on the L-frame were unstable”;
however, moving it too slowly may cause either one or more of the
markers on the L-frame to go undetected by the cameras, or the
calibration may be successful with a very low number of points captured.
A practice calibration may help in determining how quickly to move the
wand.
3. Make sure that complete measurement volume is visible to at least two
cameras and that the wand is moved throughout the entire volume.
4. Check to make sure proper calibrations settings are chosen. Particularly,
if using advanced reference object settings ensure it is checked. By
default, the wand calibration setting uses the standard wand and
calibration kit settings, supplied with the system.
3.3 Test Results
An extensive amount of testing was done with the wand calibration to build
confidence in this method. Tests mainly consisted of varying wand length and
L-frame size, then recording the results.
Through using an exact wand length and varying L-frame marker positions it was
shown that if one marker is incorrect by 15mm or more error increases by a factor of
10 or greater. As error increases so do standard deviation of wand length, average
residual, and the difference between maximum and minimum wand length.
Wand Length = 583.27mm
L-Frame (mm) Id X (mm) Y (mm) Z (mm) Points Avg res (mm) Error (mm) Std. Deviation Max-Min 751.76, 203.75, 1 2057.22 629.04 4535.79 787 0.26718 -13.47638642 1.65987 16.58508 550.75 2 -1938.71 565.35 4509.56 787 0.26718 752, 204, 551 1 2067.48 627.2 4531.04 789 0.26839 2.916356741 1.19737 14.20502 2 -1944.85 563.47 4505.66 789 0.26839 755, 205, 553 1 2071.75 626.42 4529.09 789 0.27017 9.733580786 1.0788 13.60541 2 -1947.4 562.66 4504.07 789 0.27017 760, 205, 555 1 2106.67 619.92 4513.07 793 0.30879 65.53955114 2.34736 11.51135 2 -1968.31 556.02 4491.22 793 0.3088 762, 208, 557 1 2095.36 622.12 4518.42 791 0.29008 47.47763135 1.68563 11.59735 2 -1961.55 558.24 4495.5 791 0.29007 765, 210, 560 1 2078.66 625.32 4526.11 791 0.27251 20.8607968 1.06619 13.46674 2 -1951.62 561.44 4501.59 791 0.27251 770, 215, 565 1 2050.2 630.41 4539.18 775 0.26654 -24.55981401 1.90322 8.30164 2 -1934.64 566.7 4512.26 775 0.26655 750, 200, 550 1 2057.22 629.04 4535.79 787 0.26718 -13.47638642 1.65987 16.58508 2 -1938.71 565.35 4509.56 787 0.26718 740, 190, 540 1 2115.83 618.33 4509.34 799 0.32999 80.17190789 2.94427 13.23688 2 -1973.79 554.47 4488.45 799 0.33001 735, 200, 545 1 1903.69 656.29 4591.44 744 0.56606 -258.3939747 11.84394 48.85986 2 -1847.21 593.54 4554.57 744 0.56608 750, 185, 545 1 2167.51 608.5 4484.11 813 0.47007 163.7248075 6.48472 28.2605 2 -2005.69 544.49 4467.28 813 0.47008 750, 200, 520 1 2519 525.56 4089.21 475 2.02371 730.9697278 13.62621 53.20776 2 -2221.51 461.02 4103.12 475 2.02383
Indicates the actual marker distances Figure 3
Error and L-frame values are the only two values not given from the calibration files.
Error is the difference between calculated distance and measured distance between
cameras.
Error = (SQRT ((X1 – X2)
2+ (Y1 – Y2)
2+ (Z1 – Z2)
2)) – Rd
X
1,Y
1,Z
1: The coordinates for camera 1 resulting from the calibration
X
2,Y
2,Z
2: The coordinates for camera 2 resulting from the calibration
R
d: The actual distance measured between the two cameras.
To acquire the actual marker positions, the cameras were calibrated using a peak
frame, which has exact coordinates for each marker. L-frame markers were
captured by the cameras; thus, giving their positions. A calibration file using exact
wand length and L-frame marker positions was created. To generate all other data,
L-frame marker distances were entered into the calibration files. Then, the files were
recalibrated and results were recorded.
It was shown that the accuracy of both wand length and L-frame structures marker
positions is the governing factor in error results. If both these measurements were
incorrect either error vastly increased, or there was a calibration failure since the
cameras could not locate markers properly.
4.0 CAPTURING MEASUREMENTS
4.1 2D and 3D Motion Capture
A single camera can be used to capture 2D data. It does not need calibration;
however, it does need to be linearized. When 2 or more cameras are connected
both 2D and 3D data is generated. To capture a 2D/3D measurement:
1. Open a new file
2. Select capture icon
or choose the Capture tab then capture. The
following screen appears:
Figure 4
3. Next, set the capture options such as capture time and capture delay as
required.
4. Start the capture. Once the capture has finished 2D data, 3D data, a 2D
viewing window and a 3D viewing window are available for display.
Figure 5
4.2 6DOF Motion Capture
4.2.1 Capturing 6DOF data
The 6DOF real time output gives x, y, z, roll, pitch, yaw, and residual error of the
rigid body being traced. Multiple bodies can be traced at the same time.
To complete a 6DOF capture:
1. Open a new file, place the rigid body in the viewing area of the cameras
2. The body must have at least 4 markers and they cannot be placed in a
symmetrical fashion.
Go to 3D view window, ensure cameras see body markers
Processing Select Track the Measurement
Processing 6DOF tracking 6DOF bodies
Choose to acquire the body
3. Under the processing tab deselect “Track the measurement” and select
”Tracking 6DOF”
4. Choose Capture tab, and select the 6DOF real time output option.
It is important to de-select the “Keep visualizing while RT tracking” option under
Processing
6DOF tracking
RT output. This allows the cameras to capture at the
desired frequency. When this option is selected the capture rate lowers significantly
because the display graphics are continuously updated, which consumes time.
4.2.2 QTMDAC
QTMDAC software converts 6DOF real time data provided by QTM. It provides an
analog output as well as displays the key components of the 6DOF data including:
o
Number of bodies
o
Number of identified and unidentified markers
o
Frame count
o
Frequency
o
Plot of the residual error
o
6DOF data (x, y, z, roll, pitch, yaw)
Figure 6
QTMDAC has the capabilities of QualiDAC software with the exception that it can
communicate with the QTM software via a TCP/IP (Transmission Control
Protocol/Internet Protocol)
connection.
A QTMClient header file written in Visual C is used to communicate to QTMClient
DLL (Dynamic Link Library) and consequently QTM. In order to allow QTMDAC
access to QTM, the header file was converted to VB and became QTMClientVB
module. This module is included in QTMDAC and incorporates the QTMClient DLL
interface. It contains functions and data types that allow QTMDAC to open, close, or
gather data across a connection to QTM.
Functions included in QTMClientVB:
• QTM_OpenTCPIPConnection: Opens TCP/IP connection between QTM and
QTMDAC
• QTM_AllocateFrameMemoryUnidentified3D,
QTM_AllocateFrameMemoryIdentified3D,
QTM_AllocateFrameMemory6DOF: Allocate memory necessary for body
and marker information
• QTM_ContinuousTransmission: Determines whether data is sent from
QTM to QTMDAC continuously or by frame
• QTM_HasNewData: Checks for new data
• QTM_GetFrame: Get data frame and types of frames
• QTM_FreeFrameMemory6DOF, QTM_FreeFrameMemoryIdentified3D,
QTM_FreeFrameMemoryUnidentified3D: Releases memory allocated to
avoid memory overflow
• QTM_CloseConnection: Closes TCP/IP connection between QTM and
QTMDAC
5.0 CONCLUSIONS
The QTM software and ProReflex cameras is an extremely useful motion capture
system. It encapsulates the use of multiple cameras (up to 16) and tracking of
multiple bodies (up to 6). The rate of capture can reach at least 90Hz with the
QTM/QTMDAC system. This is a vast improvement from the previous
Qualisys/QualiDAC system that had a maximum of 30Hz capture rate.
5.1 Recommendations
QTM has the ability to output analog data, but it requires the use of force plates and
only outputs the force data. Perhaps to reduce the need for 2 pieces of software,
the analog output of QTM could be developed to output 6DOF real time data.
Further testing with multiple bodies should be completed if more than 2 bodies are to
be traced at the same time. Also, extended calibration method should be tested
further. This method incorporates the wand calibration method, but allows cameras
that cannot see the L-frame reference structure to be calibrated by the overlap of
adjacent cameras field of view, which see the reference frame. It appears to be
beneficial in large measurement volumes, but was not tested.
6.0 REFERENCES
1.
Qualisys Medical AB, Qualisys Track Manager 1.7.187,
www.qualisys.se
, 2004-10-26
2.
Peter King, QualiDAC Software Manual (LM-2003-11), National Research
Council, April 2003
3.
Geoff Holden, QualiDAC Software Manual Addendum (LM-2003-34),
National Research Council, December 2003
4.
Visual Basic/VB.NET Message Board, CodeProject,
http://www.thecodeproject.com
, 1999-2004
Appendix A
QTracREADME
A working system for QTrac 2.57 with the MacReflex cameras (Firmware 5.0), is
as follows:
1. Use Windows 98/2000
2. Install ACB-530 card (4111) with settings as per the “SeaLevel ACB-530
and PC-ACB Installation Instructions” manual (pgs 5-7), with two
exceptions:
E3 has a jumper across 7 (IRQ 7)
E1 has jumpers on T and N.
3. Ensure no other device is using DMA channel 3
Go to Start Programs Accessories System Tools System
Information
HW Resources
DMA
If a device uses channel 3, change the setting in BIOS
4. Go to Setup
Hardware and change the settings to:
Camera/MC Check VP/Camera
Serial Choose ACB-530 (RS-422), DMA Channel 3, and Port
Address is 0x238
***NOTE*** WHEN USING WIN98 OR 2000 NO DRIVER INSTALLATION
(SUCH AS SEAMAC) IS NECESSARY SINCE QTRAC HAS ITS OWN DRIVER
FOR THE ACB CARD***
QTrac has never been formally supported on Windows NT4 or XP. However, it
has been able to run on NT4 by installing a SeaMac driver and ensuring that
“Devices” sees the driver. We could not get this to work with SeaMac version
2.4.5. QTrac would complain and give an error message that the driver could not
be found. We also tried the ACBII card instead of the ACB-530 but it did not
work. Outlined in the manual mentioned above are instructions for installing the
ACB-530 and PC-ACB cards with Windows 95 and NT. We followed these
instructions but could not get QTrac to recognize the driver.
Windows NT or 98 did not recognize the ACB-530 card as new hardware. It is
not shown in the Performance tab under System Properties (Win98). However,
QTrac recognizes the MacReflex cameras (when QTrac has the Hardware
settings as above).
CABLE CONNECTIONS (Videoprocessor to ACB-530/PC-ACB):
HSKi 1<---19 RTS+
HSKo 2 ---> 9 RXC+
RXD- 3 <--- 2 TX-
GND 4 --- 7 GND
TXD- 5 ---> 3 RX-
RXD+ 6 <---14 TX+
Gpo 7 --->13 CTS+
TXD+ 8 --->16 RX+
+---17 RXC-
|
+--- 7 GND
CABLE CONNECTIONS (Videoprocessor to ACB-II):
HSKi 1<---22 RTS+
HSKo 2---> 8 RXC+
RXD- 3<---25 TX-
GND 4--- 7 GND
TXD- 5 --->13 RX-
RXD+ 6<---24 TX+
Gpo 7--->10 CTS+
TXD+ 8--->12 RX+
+--- 9 RXC-
|
+--- 7 GND
A-2
Linearization of MacReflex cameras and ProReflex cameras using QTrac:
Place the 8x10 linearization grid on a flat surface; attach the centering rod.
**MAKE SURE THE ROD IS PERPENDICULAR WITH THE GRID TO
IMPROVE ACCURACY OF THE LINEARIZATION**
MacReflex -- Once a working system is in place as outlined above the cameras
must be linearized as follows:
1. Mount the Camera on a tripod, open QTrac
New
Motion Capture; push
the play symbol (
►). This displays the markers in the camera's FOV
(Field of View).
Adjust the camera such that all 80 markers on the grid are
contained in the FOV (yellow rectangle).
Adjust the camera such that the marker on the center rod is directly
in the center of the two vertical markers.
Be as accurate as
possible.
2. If some of the markers are not in the camera’s FOV close the Motion
Capture window, go to Setup
Hardware, choose Marker Discrimination
settings as appropriate, for example Maximum per Frame = 100, Largest =
100, Smallest = 1, and Capture Rate as appropriate (60Hz). Also, make
sure the focus and aperture are set properly.
Reopen Motion Capture window.
3. Once the camera is positioned properly, cover the two vertical markers
and the marker on the rod.
Measure and record the distance from the
grid to the focal point of the lens.
4. Close the Motion Capture window and open New
Linearization, go to
Setup
Linearization and enter the “Camera Distance to Grid”
Push the play (
►) button
Push the capture button
Once the linearization is complete save the linearization file and
exit.
5. Repeat steps 1 - 4 for remaining MacReflex cameras.
**NOTE: WHEN USING THE LINEARIZATION WINDOW, TIMEOUTS MAY
OCCUR, THIS IS WHY IT IS NECESSARY TO DO THE POSITIONING OF THE
CAMERAS IN THE MOTION CAPTURE WINDOW. IF A TIMEOUT OCCURS
WHILE LINEARIZING A CAMERA, SIMPLY REOPEN THE LINEARIZATION
WINDOW.**
ProReflex -- Both QTM and QTrac use the same SeaLevel board setup.
1. Go to S:\Qualisys\QTM Software\Firmware\Old Firmware
Open QFI; follow the first two instructions.
If the camera has firmware 7.0 or above it must be changed to
version 6.**.
2. Mount the camera, open QTrac, go to Setup
Hardware and change the
settings to:
Camera/MC Check MCU 240
Serial Choose COM Port (RS-232), COM3
3. Open the Linearization window (New
Linearization).
Push the play (
►) button.
Adjust the camera such that the rod marker is directly in the center
of the two vertical markers.
All 80 markers on the grid need to be in the camera’s FOV, and
they must fill as much of the viewing area (yellow rectangle) as
possible.
4. If problems arise with viewing the markers adjust the focus and aperture
as described in the “QTM User Manual”, and adjust the marker settings
under Setup
Hardware.
5. Measure the distance from the camera to the grid and enter it in the
“Camera Distance to Grid” setting (Setup
Linearization).
6. Cover the two vertical markers and the rod marker. Capture the
linearization and save the file.
7. Repeat steps 1 – 6 for the remaining ProReflex Cameras.
Appendix B
CalibrationREADME
Calibration
There are three methods of calibration using the QTM (Qualisys Track Manager)
Software:
- Wand Calibration
- Frame Calibration
- Fixed Camera Calibration
Before calibrating the camera system they must be linearized, see
“QtracREADME”.
For more information about calibration techniques refer to “Qualisys Track
Manager User Manual”
Wand Calibration:
1. Start QTM, locate the camera system, and load the linearization files for
each camera.
2. Place the reference frame in the measurement volume.
3. Go to Tools
Workplace options
Calibration.
Select Wand calibration under Calibration type.
Choose the appropriate Calibration Kit settings, and “Coordinate
system orientation and translation”.
Be sure to enter the “Exact wand length (mm)”.
4. If the default calibration and wand kit settings are not suitable:
Choose “use advanced definition of reference object instead”.
Choose the “Advanced…” tab and enter the appropriate settings.
Choose Apply, then Ok.
5. Open a new file; choose the calibration icon . A Calibration window will
appear. Choosing the Calibration Quality setting is dependant on the size
of the measurement volume. The time should be set to allow the wand to
be moved in as many positions as possible throughout the volume. This
allows the cameras to view more points and improves the accuracy of the
calibration.
6. Start the calibration, move the wand throughout the measurement volume.
7. When the calibration is completed a message window will appear.
This window gives:
• Locations of the cameras with respect to the calibration coordinate
system
• Number of points used in the calibration for each camera
• Average residual
• Standard deviation of wand length
• Difference in wand length.
If the calibration was unsuccessful, an error message will appear in the
Calibration results window.
8. Track calibration and view it provides a view of the entire calibration
process. It is important to choose this option before accepting the
calibration file to ensure there are no phantom markers present.
9. The calibration process is now complete. Choose Ok, and begin
capturing a measurement.
Frame Calibration:
1. Start QTM, locate the camera system, and load the linearization files for
each camera.
2. Place the Frame in the measurement volume.
3. Open a new file; this gives a preview of what the cameras can see. Align
the cameras properly.
4. Go to Tools
Workplace options
Calibration; choose the Frame
Calibration option.
5. Take one marker as a reference (0,0,0). Measure all other markers with
respect to the reference. Be as accurate as possible (within 1mm).
Enter the locations of the markers in the appropriate section. Also, enter
the number of markers that can be seen by each camera.
6. Choose Apply, then Ok. Choose the calibration icon . Start the
calibration.
7. When the calibration is completed a message window will appear.
This window gives:
• Locations of the cameras with respect to the calibration coordinate
system
• Number of points used in the calibration for each camera
• Average residual
• Standard deviation of wand length
• Difference in wand length.
If the calibration was unsuccessful, an error message will appear in the
Calibration results window.
8. Track calibration and view it provides a view of the entire calibration
process. It is important to choose this option before accepting the
calibration file to ensure there are no phantom markers present.
9. The calibration process is now complete. Choose Ok, and begin
capturing a measurement.
Fixed Camera Calibration:
1. Start QTM, locate the camera system, and load the linearization files for
each camera.
2. Setup the cameras and place at least two reference markers in the
measurement volume.
Get the exact location of each camera and each reference marker.
This is usually accomplished through surveying the measurement
volume.
Make sure each camera sees at least two markers.
3. Go to Tools
Workplace options
Calibration. Choose “Fixed camera
calibration”.
4. Enter the exact camera locations, exact marker locations, and the number
of markers seen by each camera in order from left to right.
5. Choose Apply, then Ok. Open a new file; choose the calibration icon .
Start the calibration.
6. When the calibration is completed a message window will appear.
This window gives:
• Locations of the cameras with respect to the calibration coordinate
system
• Number of points used in the calibration for each camera
• Average residual
• Standard deviation of wand length
• Difference in wand length.
If the calibration was unsuccessful, an error message will appear in the
Calibration results window.
7. Track calibration and view it provides a view of the entire calibration
process. It is important to choose this option before accepting the
calibration file to ensure there are no phantom markers present.
8. The calibration process is now complete. Choose Ok, and begin
capturing a measurement.
Appendix C
Tables 1 and 2 contain test results from using one L-Frame reference structure and
multiple wand lengths. Dependency on the number of points obtained from
calibration was evaluated. Generally, as the number of points gathered increases,
error decreases.
L-Frame: 402,300,160 Wand Length (mm) Id X (mm) Y (mm) Z (mm) Points Avg res (mm) Error (mm) Std. Deviation Max-Min 550 1 2657.14 307.23 4317.55 250 1.11461 -715.4473 6.04732 29.32935 2 -636.17 334.26 4231.2 250 1.11506 565 1 2712.54 319.11 4426.11 272 1.29275 -637.0327 8.33895 46.47931 2 -658.83 342.85 4325.07 272 1.29348 570 1 2728.24 322.83 4467.14 270 1.32083 -621.1835 9.60299 48.40161 2 -658.79 346.26 4359.64 270 1.32157 575 1 2744.38 329.03 4495.3 273 1.38674 -595.0032 11.14833 56.54468 2 -668.73 350.21 4383.79 273 1.38773 (Original) 580 1 2770.21 329.48 4510.31 280 1.38159 -557.2862 11.36271 48.8429 2 -680.93 351.84 4408.5 280 1.38195 585 1 2781.25 327.51 4514.75 290 1.37991 -532.1022 13.2962 48.80109 2 -695.11 352.09 4414.3 290 1.38043 590 1 2775.16 324.26 4476.08 328 1.4767 -547.4984 17.64419 53.38318 2 -686.23 352.09 4392.88 328 1.47783 595 1 2775.51 319.68 4456.33 330 1.59624 -549.6002 17.88797 50.258 2 -684 350.27 4384.07 330 1.59778 600 1 2776.12 318.09 4441.45 277 1.75456 -540.2567 15.51149 49.01251 2 -692.8 350.69 4373.26 277 1.75771 605 1 2817.56 305.21 4424.9 253 1.51072 -393.1295 9.0759 37.5694 2 -798.5 335.13 4354.42 253 1.51171 610 1 2856.67 302.61 4443.2 271 1.40076 -296.9382 7.53141 40.52362 2 -855.56 332.82 4370.65 271 1.40121 620 1 2897.07 305.56 4506.89 267 1.41266 -249.3321 6.9088 40.87671 2 -862.79 336.74 4435.45 267 1.41343 625 1 2904.64 308.47 4525.01 271 1.44892 -272.9689 8.20133 50.23566 2 -831.82 338.27 4466.87 271 1.44969 Table 1C-1
L-Frame: 402,300,160 Wand Length (mm) Id X (mm) Y (mm) Z (mm) Points Avg res (mm) Error (mm) Std. Deviation Max-Min 550 1 2922.38 311.73 4251.23 46 7.41083 34.2913 15.88385 40.43909 2 -1120.99 323.09 4165.66 46 7.41068 565 1 2786.67 273.59 4079.1 822 0.21842 -149.7421 2.21557 8.80963 2 -1072.29 297.72 3981.96 822 0.21849 570 1 2811.29 276.02 4115.06 822 0.2202 -115.6517 2.2385 8.88293 2 -1081.75 300.35 4017.1 822 0.22027 575 1 2835.9 278.42 4151.15 826 0.22176 -81.5092 2.26209 8.95953 2 -1091.27 302.97 4052.29 826 0.22184 (Original) 580 1 2860.5 280.87 4187.1 820 0.22411 -47.5292 2.28535 9.04633 2 -1100.64 305.62 4087.44 820 0.22418 585 1 2884.99 283.38 4223.01 811 0.22375 -13.6077 2.31015 9.12927 2 -1110.06 308.34 4122.49 811 0.22382 590 1 2909.52 285.84 4259.2 808 0.22604 19.8486 2.36006 9.30847 2 -1118.98 311.02 4158.04 808 0.22611 595 1 2934.24 288.25 4295.35 812 0.22792 54.0092 2.38102 9.39728 2 -1128.41 313.66 4193.37 812 0.22799 610 1 3007.3 295.78 4403.21 788 0.23405 154.4508 2.49586 8.97662 2 -1155.76 321.7 4298.76 788 0.23412 620 1 2868.73 306.49 4213.88 95 9.41029 -55.6734 23.5762 59.44415 2 -1084.47 314.65 4119.85 95 9.4105 Table 2
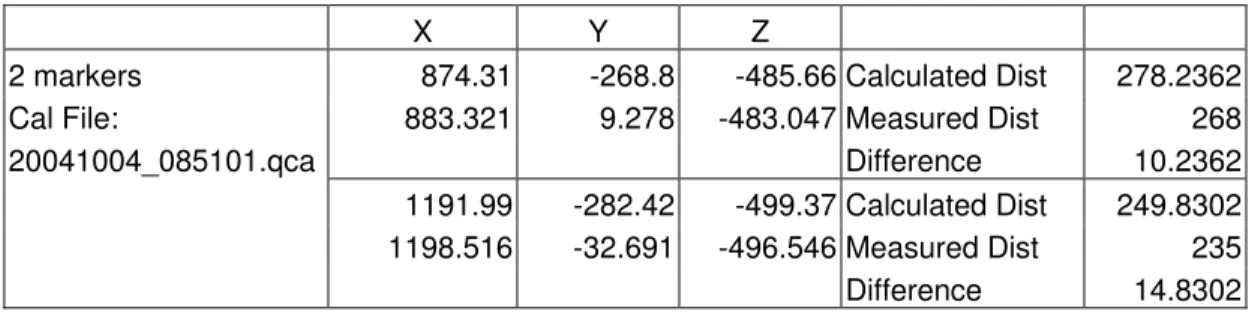
Accuracy of tracking an object, once it was calibrated using the wand technique, was
tested. An object was moved a measured distance (Measured Dist). It was tracked
by QTM and from obtaining x, y, z coordinates of the markers a distance (Calculated
Dist) was calculated. Differences between the two distances were recorded
(Difference).
Tables 3 and 4 contain data obtained from moving a 5-marker tree structure. Both
use a large wand (580mm), but Table 3 uses a larger L-frame than Table 4.
X Y Z
Tree -167.408 93.654 431.758 Calculated Dist 343.6501 Large L_Frame -173.41 85.673 775.263 Measured Dist 355 20041005_112915.qca Difference -11.3499 Table 3
X Y Z
Tree 584.76 -386.034 -134.641 Calculated Dist 814.5363 Small L-Frame 499.408 -373.233 675.31 Measured Dist 664 20041004_085101.qca Difference 150.5363 Table 4
Table 5 holds results acquired from moving a 2-marker frame a measured distance.
X Y Z
2 markers 874.31 -268.8 -485.66 Calculated Dist 278.2362 Cal File: 883.321 9.278 -483.047 Measured Dist 268 20041004_085101.qca Difference 10.2362 1191.99 -282.42 -499.37 Calculated Dist 249.8302 1198.516 -32.691 -496.546 Measured Dist 235
Difference 14.8302
Table 5
In order to distinguish if results from the wand calibration are accurate, a similar test
was conducted using Peak Frame. Peak frame is a frame of markers with exact
positions. It is used to calibrate cameras and produces accurate results.
Peak Frame Cal Results
ID X (mm) Y (mm) Z (mm) Points Avg Res(mm) Error (mm) 1 2133.38 753.1 4027.19 10 5.63948 17.3199 2 -1891.85 819.24 4138.79 10 5.51667
X Y Z
Peak Frame Cal -142.461 319.715 344.206 Calculated Dist 475.4734 -154.391 328.949 -131.028 Measured Dist 479
Difference -3.5266
Table 6
Since wand calibration results were much higher than Peak Frame results,
experimentation to improve the wand calibration technique was needed. First, exact
wand length and L-frame marker positions were captured (cameras were calibrated
using Peak Frame). Then, wand lengths and L-frame marker positions were
calculated.
Large L-Frame:
Long Arm Short Arm Long Arm Middle
751.76 550.749 203.753 Large Wand: X Y Z Calculated Length -343.537 731.21 -404.462 583.2695 239.288 717.2 -422.407 Small L-Frame:
Long Arm Short Arm Long Arm Middle
401.461 289.348 157.698 Small Wand: X Y Z Calculated Length 38.26 52.18 14.85 309.1327 347.37 55.79 15.86 Table 7
C-3
The following tables have results obtained from using exact wand lengths and
L-frame marker positions in different combinations.
Results using 583.2695 mm wand and large frame
ID X (mm) Y (mm) Z (mm) Points Avg Res (mm) Error (mm) 1 2057.22 629.04 4535.79 787 0.26718 -13.4764 2 -1938.71 565.35 4509.56 787 0.26718
X Y Z
Moving 5-marker -53.37 93.28 780.99 Calculated Dist 479.1263 Frame -51.39 97.89 301.89 Measured Dist 479
Difference 0.1263
Table 8
Results using 309.1327 mm wand and large frame
ID X (mm) Y (mm) Z (mm) Points Avg Res (mm) Error (mm) 1 2063.54 627.98 4504.46 805 0.43909 -8.9057 2 -1937.04 567.6 4482.79 805 0.43909
X Y Z
Moving 5-marker -46.02 93.33 776.23 Calculated Dist 473.4889 Frame -42.91 97.54 302.77 Measured Dist 479
Difference -5.5111
Table 9
Results using 583.2695 mm wand and small frame
ID X (mm) Y (mm) Z (mm) Points Avg Res (mm) Error (mm) 1 2862.29 274.4 4213.04 787 0.27637 -5.1243 2 -1140.87 297.23 4098.07 787 0.27636
X Y Z
Moving 5-marker 815.21 -156.11 379.29 Calculated Dist 478.2802 Frame 822.26 -143.81 -98.78 Measured Dist 479
Difference -0.7198
Table 10
Results using 309.1327 mm wand and small frame
ID X (mm) Y (mm) Z (mm) Points Avg Res (mm) Error (mm)
1 2850 270.45 4195.12 711 0.35244 -19.8929 2 -1138.4 295.48 4081.13 711 0.35245
X Y Z
Moving 5-marker 811.65 -155.57 377.41 Calculated Dist 476.4213 Frame 818.95 -143.02 -98.79 Measured Dist 479
Difference -2.5787
Table 11
Camera distance is distance from the reference frame origin to the camera. A
camera system, consisting of 2 cameras, was calibrated using different wand and
L-frame combinations and using Peak Frame. Each camera’s distance was calculated
from calibration results. Mean, standard deviation, minimum and maximum values,
and average absolute deviation of camera distance was calculated for camera 1 and
camera 2. Generation of similar results, camera distances for example, was shown
to be difficult using wand calibration. Especially if a number of wand and L-frame
combinations are used.
Peak Frame Cal Results Camera 1
ID X (mm) Y (mm) Z (mm) Camera Distance Mean 4983.9967 1 2133.38 753.1 4027.19 4619.1697 Std Deviation 151.6348 2 -1891.85 819.24 4138.79 4623.8332 Average Absolute Deviation 91.2067
Hi = 5100.75538, Low = 4619.169745 Cal Results using 583.2695 wand, Large L-Frame
ID X (mm) Y (mm) Z (mm) Camera Distance Camera 2
1 2057.22 629.04 4535.79 5020.0833 Mean 4726.5167 2 -1938.71 565.35 4509.56 4941.0878 Std Deviation 309.9473 Average Absolute Deviation 261.0533 Cal Results using 309.1327 wand, Large L-Frame Hi =4941.736361, Low = 4247.220864 ID X (mm) Y (mm) Z (mm) Camera Distance
1 2063.54 627.98 4504.46 4994.2683 2 -1937.04 567.6 4482.79 4916.2689 Cal Results using 583.2695 wand, Large L-Frame ID X (mm) Y (mm) Z (mm) Camera Distance
1 2080.17 642.47 4524.16 5020.7468 2 -1941.99 578.43 4507.2 4941.7364 Cal Results using 583.2695 wand, Large L-Frame ID X (mm) Y (mm) Z (mm) Camera Distance
1 2076.13 646.36 4521.36 5017.0503 2 -1934.92 582.45 4504.98 4937.4091 Cal Results using 583.2695 wand, Small L-Frame ID X (mm) Y (mm) Z (mm) Camera Distance
1 2862.29 274.4 4213.04 5100.7554 2 -1140.87 297.23 4098.07 4264.2828 Cal Results using 309.1327 wand, Small L-frame ID X (mm) Y (mm) Z (mm) Camera Distance
1 2850 270.45 4195.12 5078.8458 2 -1138.4 295.48 4081.13 4247.22089 Cal Results using 583.2695 wand, Large L-Frame ID X (mm) Y (mm) Z (mm) Camera Distance
1 2076.81 625.21 4528.46 5021.0534 2 -1949.55 561.55 4504.49 4940.2949
Appendix D
QTMDAC Source Code
'******Main Form******' '--- ' QualiDAC ' --- ' 'Description:
' This software is intended to enhance the current Qualisys system ' capabilities by taking marker and body data directly from the Qualisys ' system and providing a visual display, analog output, an RS-422 output ' stream, and text file logging capabilities.
' 'Author: ' Peter King ' Work Term V
' Faculty of Engineering
' Memorial University of Newfoundland ' www.peterking.ca ' [email protected] ' 'Last Modified: ' 15 Dec 2004 ' Dena Senior ' Work Term III ' MUN
'
'Modifications include:
' Module QTMClientVB added to project
' The ability to communicate via a TCP/IP connection to QTM software ' Option to update grid and/or graph
' Renamed QTMDAC
'--- Option Explicit
Private Const SM_CXVSCROLL As Long = 2 Private Const MAX_COLUMNS As Long = 7 Private Const MAX_COLUMNS_INFO As Long = 5 Private Const COLUMN_WIDTH As Long = 75 Private Const COLUMN_WIDTH_INFO As Long = 90
Private Const HEADER_COLOR As Long = &HC0FFFF 'Light Yellow Private Const ESCKeyCode As Long = 27
Private Const FRAME_RATE_WINDOW_MODULUS As Long = 301 Private Const SLEEP_MIN As Long = 1
Private Const SLEEP_SETTLING_TIME As Long = 1000 Private m_boolUpdateGrid As Boolean
Private m_boolUpdateGraph As Boolean Private m_boolFrameDropped As Boolean Private m_dwPreviousFrame As Long
Private Declare Sub Sleep Lib "Kernel32" (ByVal dwMilliseconds As Long)
Private Declare Function GetSystemMetrics Lib "user32" (ByVal nIndex As Long) As Long Private Declare Function timeBeginPeriod Lib "winmm.dll" (ByVal uPeriod As Long) As Long
Private Declare Function timeEndPeriod Lib "winmm.dll" (ByVal uPeriod As Long) As Long Dim f3 As Object 'Type 3 Frame (UnIdentified Markers)
Dim f5 As Object 'Type 5 frame (Body) Dim isOpen As Boolean 'Open state of PortA Dim isStart As Boolean 'loop state
Dim str As String 'general purpose output string 'Port A variables
Dim errA As Long 'PortA error state Dim handleA As Long 'Handle to PortA Dim RxBufferA As String 'Input buffer
Dim PortInfoA As PORT_INFO 'Structure containing port information Dim RxCount As Integer 'number of filled Rx Buffers
Dim TxCount As Integer 'number of availible Tx buffers 'Qualisys data stream
Dim retbytes As Long 'number of bytes returned from Qualisys Dim byteBuf() As Byte 'returned data from Qualisys
Dim split As Long 'location where marker data ends and body begins Dim watchdogcount As Long 'number of times watchdog has reset Qualisys 'TCP/IP variables
Dim moPPUFrameVB As QTMClientVB.QTM_TPPUFrame 'VB version of moPPUframe pointer Dim moPPUFrame As QTMClientVB.QTM_TPPUFrameC 'VC version of moPPUframe pointer Dim bStatus As Byte 'status variable
Dim errtcp As Byte 'TCP/IP error state Dim dwFrameCount As Long
Dim boolGridCleared As Boolean Dim boolGraphCleared As Boolean 'Variables used to calculate Frequancy Dim startCount As Currency
Dim finishCount As Currency
'--- 'Form_Load
' initializes variables and objects '--- Private Sub Form_Load()
isOpen = False fileOpen = False m_boolUpdateGrid = chkUpdateGrid.Value m_boolUpdateGraph = chkUpdateGraph.Value m_boolFrameDropped = False m_dwPreviousFrame = -1 'create frame objects Set f3 = New Frame3 Set f5 = New Frame5
'get system clock frequency
'If no configuration file present
If Not frmConfig.initializeConfig(GetSetting("QualiDAC", "Config", "configFile", "default.qdc")) Then ' Write config file, then retry initializing the config.
Set frmConfig.cfgFileStream = frmConfig.cfgFileObj.OpenTextFile("default.qdc", ForWriting, True) frmConfig.cfgFileStream.Write defaultConfig
Set frmConfig.cfgFileStream = Nothing
If Not frmConfig.initializeConfig("default.qdc") Then Unload Me Exit Sub End If End If ChangePriority (HIGH_PRIORITY_CLASS)
'For AOB8/16 card
InPortB AUTO 'place in automatic update mode
' This application uses a freeware grid from vbAccelerator to display data ' This grid enables fast update rates and is intuitive to use
'
' For fastest (flicker free) performance, the Redraw property should be ' set to False while updating the grid and set back to True once the ' grid has been completely updated
'
' The major grid properties used in this application are AddColumn, AddRow, and ' CellDetails
'
' The first 5 AddColumn parameters are key, header, textAlignment, ' iconIndex, and columnWidth
'
' The first 4 CellDetails parameters are row, col, text, textAlignment '
' vbalGrid6.ocx and SSubTmr6.dll must be registered on the client PC ' to use this component
'
Dim dwCol As Long
With vbalGridBody
'Turn off Redraw until grid is fully updated (reduces flicker) .Redraw = False
.DefaultRowHeight = 17
'.AddColumn - specify the column index as the key ' specify an empty string for the header value ' leave the text alignment and icon index fields empty ' specify 90 for the column width
'
'Set up the display grid to have MAX_COLUMNS '
For dwCol = 1 To MAX_COLUMNS
.AddColumn dwCol, "", , , COLUMN_WIDTH Next dwCol
'Turn on Redraw after grid is fully updated (reduces flicker) .Redraw = True
End With
With vbalGridMrks
'Turn off Redraw until grid is fully updated (reduces flicker) .Redraw = False
.DefaultRowHeight = 17
'.AddColumn - specify the column index as the key ' specify an empty string for the header value ' leave the text alignment and icon index fields empty ' specify 90 for the column width
'
'Set up the display grid to have MAX_COLUMNS '
For dwCol = 1 To MAX_COLUMNS
.AddColumn dwCol, "", , , COLUMN_WIDTH Next dwCol
'Turn on Redraw after grid is fully updated (reduces flicker) .Redraw = True
End With
With vbalGridInfo
'Turn off Redraw until grid is fully updated (reduces flicker) .Redraw = False
.DefaultRowHeight = 17
'.AddColumn - specify the column index as the key ' specify an empty string for the header value ' leave the text alignment and icon index fields empty ' specify 90 for the column width
'
'Set up the display grid to have MAX_COLUMNS '
For dwCol = 1 To MAX_COLUMNS_INFO
.AddColumn dwCol, "", , , COLUMN_WIDTH_INFO Next dwCol
'Turn on Redraw after grid is fully updated (reduces flicker) .Redraw = True
End With End Sub
'--- 'Startbutton
' initializes main data stream loop '--- Private Sub cmdStart_Click()
mnuTools.Enabled = False
'start time of data stream
QueryPerformanceCounter curStartTime cmdStart.Visible = False cmdStop.Visible = True isStart = True
'#If SIMULATION Then ' m_dwFrameCount = 0 ' m_dwMarkerCount = 0 ' m_dwBodyCount = 0 '
' 'Display simaulated tracking data until the ESC key is pressed or ' 'the form is unloaded
'
' m_boolExiting = False ' m_boolEscKeyPressed = False '
' While ((Not m_boolEscKeyPressed) And (Not m_boolExiting)) ' Call QTM_GetFrameVBT(moPPUFrameVB, moPPUFrame) ' ' Call DisplayData(moPPUFrameVB) ' ' DoEvents ' Sleep SLEEP_MIN ' Wend '
' If (Not m_boolExiting) Then ' Me.cmdStart.Enabled = True ' End If
'
' Exit Sub '#End If
'initialize frame count f5.getFrameCount
commStart 'open comm with Qualisys
'while stop button not clicked While isStart
getReading 'get data when availible Wend
commStop 'close comm with Qualisys End Sub
'--- 'commStart
'Open portA and start data stream '--- Private Sub commStart()
droppedFrames = 0 chkSumCount = 0 watchdogcount = 0 cmdLog.Enabled = True lblDropped.Caption = "0" lblStatus.Caption = vbNullString
'Open portA to communicate with Qualisys errA = SEAMAC_PortOpen(0, 1, handleA) If errA = 0 Then
isOpen = True
'initialize input string to buffer size
errA = SEAMAC_GetPortInfo(handleA, PortInfoA) RxBufferA = Space$(PortInfoA.wRxFrameSize) RxBufferB = Space$(PortInfoB.wRxFrameSize)
'Open portB to communicate to remote client errB = SEAMAC_PortOpen(0, 2, handleB)
errB = SEAMAC_GetPortInfo(handleB, PortInfoB)
'Start Qualisys data stream
str = "#f000A" & vbCr '6D and 3D data errA = SEAMAC_PutData(handleA, str, Len(str))
str = "#Tffff" & vbCr 'transmit continuous errA = SEAMAC_PutData(handleA, str, Len(str))
str = "#Gffff" & vbCr 'start data collection errA = SEAMAC_PutData(handleA, str, Len(str)) tmrWatchDog.Enabled = True Else bStatus = QTM_OpenTCPIPConnection("10.1.2.15", "1221") If (bStatus = 1) Then isOpen = True
'Init to NULL otherwise QTM_AllocateFrameMemory...() will return error ZeroMemory moPPUFrame, LenB(moPPUFrame)
'Set the frame types that is wanted
bStatus = QTM_SetFrameTypes(QTM_FrameTypeUnidentified3D Or _ QTM_FrameTypeIdentified3D Or _
QTM_FrameType6DOF Or _ QTM_FrameTypeRotationMatrix)
' Allocate memory for the largest possible number of markers/bodies bStatus = QTM_AllocateFrameMemoryUnidentified3D(moPPUFrame, 50) bStatus = QTM_AllocateFrameMemoryIdentified3D(moPPUFrame, 50) bStatus = QTM_AllocateFrameMemory6DOF(moPPUFrame, 10)
bStatus = QTM_AllocateFrameMemoryRotationMatrix(moPPUFrame, 10) ' Start real-time data transfer from QTM
Call QTM_ContinuousTransmission(True)
Else
MsgBox "Cannot open TCP/IP or PortA connection" Exit Sub End If ' tmrWatchDogTCP.Enabled = True End If
'start RMS strip chart startGraph ClearGridData ClearGraphData boolGridCleared = True boolGraphCleared = True picFrameDropped.Enabled = False picFrameDropped.Visible = False End Sub '--- 'getReading
' -Reads data from Qualisys and passes it to ' appropriate objects
'--- Public Sub getReading()
Dim returnVal As Long Dim data As Byte timeBeginPeriod 1 Sleep SLEEP_SETTLING_TIME dwFrameCount = -1 m_boolFrameDropped = False m_dwPreviousFrame = -1 While (isStart) bStatus = QTM_HasNewData() ' While (bStatus = 0) ' bStatus = QTM_HasNewData()
' OutPort DAC6, limit(((ErrRMS - MinRes) / (MaxRes - MinRes)) * 65535) ' OutPort DAC14, limit(((ErrRMS - MinRes) / (MaxRes - MinRes)) * 65535) ' Wend
If (bStatus = 1) Then
bStatus = QTM_GetFrameVB(moPPUFrameVB, moPPUFrame) If (bStatus = 1) Then
dwFrameCount = dwFrameCount + 1 If (m_boolUpdateGrid) Then
DisplayData moPPUFrameVB boolGridCleared = False Else
If (Not boolGridCleared) Then ClearGridData boolGridCleared = True End If End If If (m_boolUpdateGraph) Then With moPPUFrameVB.frame6DOF If (.numberOfBodies > 0) Then
graphData .frameBody(0).residual, .frameBody(.numberOfBodies - 1).residual End If
End With
boolGraphCleared = False Else
If (Not boolGraphCleared) Then ClearGraphData
boolGraphCleared = True End If
End If
'If ((dwFrameCount Mod FRAME_RATE_WINDOW_MODULUS) = (FRAME_RATE_WINDOW_MODULUS - 1)) Then
QueryPerformanceCounter finishCount
vbalGridInfo.CellDetails 2, 5, Format$((dwFrameCount Mod
FRAME_RATE_WINDOW_MODULUS) / ((finishCount - startCount) / curFreq), "#00"), DT_RIGHT 'End If
If ((dwFrameCount Mod FRAME_RATE_WINDOW_MODULUS) = 0) Then QueryPerformanceCounter startCount
End If
With moPPUFrameVB.frame6DOF If (Not m_boolFrameDropped) Then If (m_dwPreviousFrame > -1) Then
If ((.frameCount - m_dwPreviousFrame) < 2) Then m_dwPreviousFrame = .frameCount Else picFrameDropped.Visible = True picFrameDropped.Enabled = True m_boolFrameDropped = True End If Else m_dwPreviousFrame = .frameCount End If End If End With Else
OutPort DAC6, limit(((ErrRMS - MinRes) / (MaxRes - MinRes)) * 65535) OutPort DAC14, limit(((ErrRMS - MinRes) / (MaxRes - MinRes)) * 65535)
End If
Else
OutPort DAC6, limit(((ErrRMS - MinRes) / (MaxRes - MinRes)) * 65535) OutPort DAC14, limit(((ErrRMS - MinRes) / (MaxRes - MinRes)) * 65535) End If DoEvents Sleep SLEEP_MIN Wend timeEndPeriod 1
'poll for incoming data
errA = SEAMAC_GetBufferCount(handleA, RxCount, TxCount)
'if data availible
If RxCount > 0 And errA = 0 Then 'clear entire buffer
While RxCount > 0 And errA = 0
errA = SEAMAC_GetData(handleA, RxBufferA, PortInfoA.wRxFrameSize, retbytes) errA = SEAMAC_GetBufferCount(handleA, RxCount, TxCount)
Wend DoEvents Else DoEvents Exit Sub End If If errA = 0 Then
'convert data to array of bytes
byteBuf = StrConv(RxBufferA, vbFromUnicode)
'clear the log string logString = ""
'1st part of buffer has marker data returnVal = f3.passData(byteBuf)
'if no error in frame If returnVal > -1 Then 'calculate separation point split = returnVal + 1
'if frame in error Else
'set RMS high on error
OutPort DAC6, limit(((ErrRMS - MinRes) / (MaxRes - MinRes)) * 65535) OutPort DAC14, limit(((ErrRMS - MinRes) / (MaxRes - MinRes)) * 65535) droppedFrames = droppedFrames + 1 lblDropped.Caption = droppedFrames Exit Sub End If
returnVal = f5.passData(MidB(byteBuf, split))
'write to log file If fileOpen Then
fileStream.WriteLine logString End If
'if frame in error If returnVal < 0 Then 'set RMS high on error
OutPort DAC6, limit(((ErrRMS - MinRes) / (MaxRes - MinRes)) * 65535) OutPort DAC14, limit(((ErrRMS - MinRes) / (MaxRes - MinRes)) * 65535) droppedFrames = droppedFrames + 1 lblDropped.Caption = droppedFrames Exit Sub End If End If End Sub '--- 'DisplayData
' -Display tracking data
' -The first 4 .CellDetails parameters are row, ' col, text, textAlignment
'---
Private Sub DisplayData(ByRef moPPUFrameVB As QTM_TPPUFrame)
Dim dwRow As Long Dim dwIdx As Long
With vbalGridBody
'Turn off Redraw until grid is fully updated (reduces flicker) .Redraw = False
.Clear
'Display 6DOF tracking data dwRow = 0 If (moPPUFrameVB.frame6DOF.numberOfBodies > 0) Then dwRow = dwRow + 1 .AddRow
.CellDetails dwRow, 1, "x", DT_RIGHT .CellDetails dwRow, 2, "y", DT_RIGHT .CellDetails dwRow, 3, "z", DT_RIGHT .CellDetails dwRow, 4, "roll", DT_RIGHT .CellDetails dwRow, 5, "pitch", DT_RIGHT .CellDetails dwRow, 6, "yaw", DT_RIGHT .CellDetails dwRow, 7, "residual", DT_RIGHT
' Call SetRowBackgroundColor(dwRow, HEADER_COLOR)
dwRow = dwRow + 1
For dwIdx = 0 To (moPPUFrameVB.frame6DOF.numberOfBodies - 1) If (moPPUFrameVB.frame6DOF.frameBody(dwIdx).residual > 0) Then .AddRow
.CellDetails (dwRow + dwIdx), 1, Format$(moPPUFrameVB.frame6DOF.frameBody(dwIdx).x, "#0.0000"), DT_RIGHT
.CellDetails (dwRow + dwIdx), 2, Format$(moPPUFrameVB.frame6DOF.frameBody(dwIdx).y, "#0.0000"), DT_RIGHT
.CellDetails (dwRow + dwIdx), 3, Format$(moPPUFrameVB.frame6DOF.frameBody(dwIdx).Z, "#0.0000"), DT_RIGHT
.CellDetails (dwRow + dwIdx), 4,
Format$(moPPUFrameVB.frame6DOF.frameBody(dwIdx).roll, "#0.0000"), DT_RIGHT .CellDetails (dwRow + dwIdx), 5,
Format$(moPPUFrameVB.frame6DOF.frameBody(dwIdx).pitch, "#0.0000"), DT_RIGHT .CellDetails (dwRow + dwIdx), 6,
Format$(moPPUFrameVB.frame6DOF.frameBody(dwIdx).yaw, "#0.0000"), DT_RIGHT .CellDetails (dwRow + dwIdx), 7,
Format$(moPPUFrameVB.frame6DOF.frameBody(dwIdx).residual, "#0.0000"), DT_RIGHT
If fileOpen Then
fileStream.Write (" " & (dwIdx + 1) & vbTab & Format$((dwFrameCount Mod
FRAME_RATE_WINDOW_MODULUS) / ((finishCount - startCount) / curFreq), "#00") & " " & vbTab & _ Format$(moPPUFrameVB.frame6DOF.frameBody(dwIdx).x, "#0.0000") & " " & _ Format$(moPPUFrameVB.frame6DOF.frameBody(dwIdx).y, "#0.0000") & " " & _ Format$(moPPUFrameVB.frame6DOF.frameBody(dwIdx).Z, "#0.0000") & " " & _ Format$(moPPUFrameVB.frame6DOF.frameBody(dwIdx).roll, "#0.0000") & " " & _ Format$(moPPUFrameVB.frame6DOF.frameBody(dwIdx).pitch, "#0.0000") & " " & _ Format$(moPPUFrameVB.frame6DOF.frameBody(dwIdx).yaw, "#0.0000") & " " & _ Format$(moPPUFrameVB.frame6DOF.frameBody(dwIdx).residual, "#0.0000")) End If
Else
.AddRow
.CellDetails (dwRow + dwIdx), 1, "", DT_RIGHT .CellDetails (dwRow + dwIdx), 2, "", DT_RIGHT .CellDetails (dwRow + dwIdx), 3, "", DT_RIGHT .CellDetails (dwRow + dwIdx), 4, "", DT_RIGHT .CellDetails (dwRow + dwIdx), 5, "", DT_RIGHT .CellDetails (dwRow + dwIdx), 6, "", DT_RIGHT .CellDetails (dwRow + dwIdx), 7, "", DT_RIGHT
If fileOpen Then
fileStream.Write (vbTab & vbTab & vbTab & vbTab & vbTab & vbTab & vbTab & vbTab & vbTab & vbTab & vbTab)
End If End If Next If fileOpen Then fileStream.Write (vbNewLine) End If
Else
dwRow = dwRow + 1 End If
'Turn on Redraw after grid is fully updated (reduces flicker) .Redraw = True
End With
With vbalGridMrks
'Turn off Redraw until grid is fully updated (reduces flicker) .Redraw = False
.Clear
'Display Identified3D tracking data dwRow = 0
If (moPPUFrameVB.frameIdentified3D.numberOfMarkers > 0) Then dwRow = dwRow + 1
.AddRow '.AddRow
.CellDetails dwRow, 1, "bodyID", DT_RIGHT .CellDetails dwRow, 2, "x", DT_RIGHT .CellDetails dwRow, 3, "y", DT_RIGHT .CellDetails dwRow, 4, "z", DT_RIGHT .CellDetails dwRow, 5, "residual", DT_RIGHT
' Call SetRowBackgroundColor(dwRow, HEADER_COLOR)
dwRow = dwRow + 1
For dwIdx = 0 To (moPPUFrameVB.frameIdentified3D.numberOfMarkers - 1) .AddRow
.CellDetails (dwRow + dwIdx), 1,
Format$(moPPUFrameVB.frameIdentified3D.frameBody(dwIdx).bodyID, "#0.0000"), DT_RIGHT .CellDetails (dwRow + dwIdx), 2,
Format$(moPPUFrameVB.frameIdentified3D.frameBody(dwIdx).x, "#0.0000"), DT_RIGHT .CellDetails (dwRow + dwIdx), 3,
Format$(moPPUFrameVB.frameIdentified3D.frameBody(dwIdx).y, "#0.0000"), DT_RIGHT .CellDetails (dwRow + dwIdx), 4,
Format$(moPPUFrameVB.frameIdentified3D.frameBody(dwIdx).Z, "#0.0000"), DT_RIGHT .CellDetails (dwRow + dwIdx), 5,
Format$(moPPUFrameVB.frameIdentified3D.frameBody(dwIdx).residual, "#0.0000"), DT_RIGHT Next
dwRow = dwRow + dwIdx Else
dwRow = dwRow + 1 End If
.AddRow
' dwRow = dwRow + 2 '
' .AddRow ' .AddRow '
' .CellDetails dwRow, 1, "Unidentified3D"
' 'Call SetRowBackgroundColor(dwRow, HEADER_COLOR) ' ' dwRow = dwRow + 2 ' ' .AddRow ' .AddRow '
' .CellDetails dwRow, 1, "Frame Count" ' .CellDetails dwRow, 2, "Markers" '
' dwRow = dwRow + 1 '
' .AddRow '
' .CellDetails dwRow, 1, moPPUFrameVB.frameUnidentified3D.frameCount ' .CellDetails dwRow, 2, moPPUFrameVB.frameUnidentified3D.numberOfMarkers ' ' If (moPPUFrameVB.frameUnidentified3D.numberOfMarkers > 0) Then ' dwRow = dwRow + 2 ' ' .AddRow ' .AddRow '
' .CellDetails dwRow, 1, "x", DT_RIGHT ' .CellDetails dwRow, 2, "y", DT_RIGHT ' .CellDetails dwRow, 3, "z", DT_RIGHT ' .CellDetails dwRow, 4, "residual", DT_RIGHT '
' dwRow = dwRow + 1 '
' For dwIdx = 0 To (moPPUFrameVB.frameUnidentified3D.numberOfMarkers - 1) ' .AddRow
'
' .CellDetails (dwRow + dwIdx), 1,
Format$(moPPUFrameVB.frameUnidentified3D.frameBody(dwIdx).X, "#0.00000"), DT_RIGHT ' .CellDetails (dwRow + dwIdx), 2,
Format$(moPPUFrameVB.frameUnidentified3D.frameBody(dwIdx).Y, "#0.00000"), DT_RIGHT ' .CellDetails (dwRow + dwIdx), 3,
Format$(moPPUFrameVB.frameUnidentified3D.frameBody(dwIdx).z, "#0.00000"), DT_RIGHT ' .CellDetails (dwRow + dwIdx), 4,
Format$(moPPUFrameVB.frameUnidentified3D.frameBody(dwIdx).residual, "#0.00000"), DT_RIGHT ' Next
' End If
'Turn on Redraw after grid is fully updated (reduces flicker) .Redraw = True
End With
With vbalGridInfo
.Redraw = False .Clear
'Display General tracking data dwRow = 1
.AddRow
.CellDetails dwRow, 1, "Frame Count", DT_RIGHT .CellDetails dwRow, 2, "Bodies", DT_RIGHT .CellDetails dwRow, 3, "Identified", DT_RIGHT .CellDetails dwRow, 4, "Unidentified", DT_RIGHT .CellDetails dwRow, 5, "Frequency", DT_RIGHT
' Call SetRowBackgroundColor(dwRow, HEADER_COLOR)
dwRow = dwRow + 1
.AddRow
.CellDetails dwRow, 1, moPPUFrameVB.frame6DOF.frameCount, DT_RIGHT .CellDetails dwRow, 2, moPPUFrameVB.frame6DOF.numberOfBodies, DT_RIGHT .CellDetails dwRow, 3, moPPUFrameVB.frameIdentified3D.numberOfMarkers, DT_RIGHT .CellDetails dwRow, 4, moPPUFrameVB.frameUnidentified3D.numberOfMarkers, DT_RIGHT
'Turn on Redraw after grid is fully updated (reduces flicker) .Redraw = True
End With End Sub
'Private Sub SetRowBackgroundColor(ByVal dwRow As Long, ByVal dwColor As Long) ' Dim dwCol As Long
' '
' With vbalGridBody
' For dwCol = 1 To .Columns
' .CellBackColor(dwRow, dwCol) = dwColor ' Next dwCol
' End With '
' With vbalGridMrks
' For dwCol = 1 To .Columns
' .CellBackColor(, dwCol) = dwColor ' Next dwCol
' End With ''
'' With vbalGridInfo
'' For dwCol = 1 To .Columns
'' .CellBackColor(dwRow, dwCol) = dwColor '' Next dwCol
'' End With 'End Sub