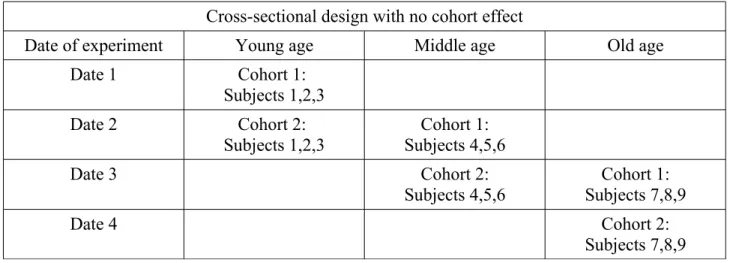
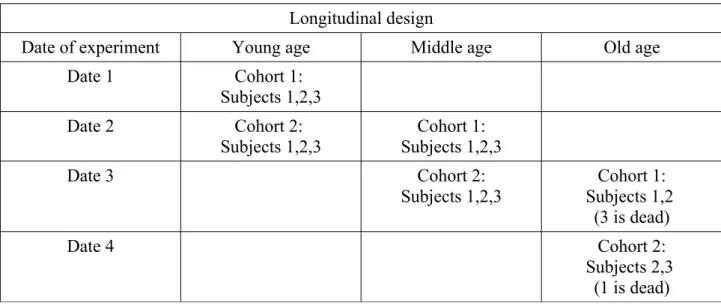
Cross-Sectional and Longitudinal Designs in Animal Models
Texte intégral
Figure


Documents relatifs
Please cite this article as: Robinson, P.M., Correlation testing in time series, spatial and cross-sectional data. As a service to our customers we are providing this early version
FIG. Dashed lines with the same color plot the corresponding values of the error in conditional fidelity, 1 − ¯F 11. The legend shows the limiting values of the conditional fidelity,
PhenoStacks employs an observations plot (D) to reveal the distribution of phenotypes (rows) across patients (columns) in a cohort, which can be sorted by patient or
Hereafter, the authors offer an explanation in regards to the rationale behind the approach chosen for their research: namely, a qualitative approach centred on the analysis of
We check the accuracy of our policy function using a grid of capital holdings that is much more dense than the one used to obtain the numerical solution and the grid points for
The aim of the present study was to assess whether different sedentary behaviors, including TV viewing, computer use and reading, would be differentially associated with indicators
We check the accuracy of our policy function using a grid of capital holdings that is much more dense than the one used to obtain the numerical solution and the grid points for