HAL Id: inserm-03231675
https://www.hal.inserm.fr/inserm-03231675
Submitted on 21 May 2021
HAL is a multi-disciplinary open access
archive for the deposit and dissemination of
sci-entific research documents, whether they are
pub-lished or not. The documents may come from
teaching and research institutions in France or
abroad, or from public or private research centers.
L’archive ouverte pluridisciplinaire HAL, est
destinée au dépôt et à la diffusion de documents
scientifiques de niveau recherche, publiés ou non,
émanant des établissements d’enseignement et de
recherche français ou étrangers, des laboratoires
publics ou privés.
early onset of diabetic cardiomyopathy in a mouse model
R. Johnson, X. Nxele, M. Cour, N. Sangweni, T. Jooste, N. Hadebe, E.
Samodien, M. Benjeddou, M. Mazino, J. Louw, et al.
To cite this version:
R. Johnson, X. Nxele, M. Cour, N. Sangweni, T. Jooste, et al.. Identification of potential biomarkers
for predicting the early onset of diabetic cardiomyopathy in a mouse model. Scientific Reports, Nature
Publishing Group, 2020, 10 (1), pp.12352. �10.1038/s41598-020-69254-x�. �inserm-03231675�
Identification of potential
biomarkers for predicting the early
onset of diabetic cardiomyopathy
in a mouse model
Rabia Johnson
1,2*, Xolisa Nxele
1,3, Martin Cour
4,5, Nonhlakanipho Sangweni
1,2,
Tracey Jooste
1,2, Nkanyiso Hadebe
5,6, Ebrahim Samodien
1, Mongi Benjeddou
3,
Mikateko Mazino
7, Johan Louw
1,8& Sandrine Lecour
5Type 2 diabetes (T2D) is characterized by metabolic derangements that cause a shift in substrate preference, inducing cardiac interstitial fibrosis. Interstitial fibrosis plays a key role in aggravating left ventricular diastolic dysfunction (LVDD), which has previously been associated with the asymptomatic onset of heart failure. The latter is responsible for 80% of deaths among diabetic patients and has been termed diabetic cardiomyopathy (DCM). Through in silico prediction and subsequent detection in a leptin receptor-deficient db/db mice model (db/db), we confirmed the presence of previously identified potential biomarkers to detect the early onset of DCM. Differential expression of Lysyl Oxidase Like 2 (LOXL2) and Electron Transfer Flavoprotein Beta Subunit (ETFβ), in both serum and heart tissue of 6–16-week-old db/db mice, correlated with a reduced left-ventricular diastolic dysfunction as assessed by high-resolution Doppler echocardiography. Principal component analysis of the combined biomarkers, LOXL2 and ETFβ, further displayed a significant difference between wild type and db/ db mice from as early as 9 weeks of age. Knockdown in H9c2 cells, utilising siRNA of either LOXL2 or ETFβ, revealed a decrease in the expression of Collagen Type I Alpha1 (COL1A1), a marker known to contribute to enhanced myocardial fibrosis. Additionally, receiver-operating curve (ROC) analysis of the proposed diagnostic profile showed that the combination of LOXL2 and ETFβ resulted in an area under the curve (AUC) of 0.813, with a cut-off point of 0.824, thus suggesting the favorable positive predictive power of the model and further supporting the use of LOXL2 and ETFβ as possible early predictive DCM biomarkers.
Diabetes affects 463 million people worldwide and this number is said to increase to 700 million by 20451.
Diabetes and its complications are inextricably linked to cardiovascular dysfunction, which is currently the leading cause of mortality worldwide, affecting 17.9 million individuals2. This association was first reported in
the Framingham Heart study and since then numerous reports have come to the forefront, confirming a 2–4 times increased susceptibility of diabetic individuals to heart failure (HF)3,4. Coronary artery disease (CAD) is
the major type of CVD responsible for HF in diabetic individuals, however diabetic cardiomyopathy (DCM) is an established complication of diabetes mellitus (DM) existing in the absence of CAD or hypertension5.
Fur-thermore, DCM is referred to as the silent killer, due to the manifestation of a long subclinical period in which the disease exists with no overt clinical symptoms6–8.
open
1Biomedical Research and Innovation Platform (BRIP), South African Medical Research Council (SAMRC),
Tygerberg 7505, South Africa. 2Division of Medical Physiology, Faculty of Health Sciences, Stellenbosch
University, Tygerberg, South Africa. 3Department of Biotechnology, University of Western Cape, Cape Town, South
Africa. 4Hospices Civils de Lyon, Hôpital Edouard Herriot, Service de Médecine Intensive-Réanimation, Lyon Cedex
03, France. 5Hatter Institute for Cardiovascular Research in Africa (HICRA), Faculty of Health Sciences, University of
Cape Town, Observatory, South Africa. 6Department of Anaesthesia, Faculty of Health Sciences, University of Cape
Town, Observatory, South Africa. 7Biostatistics Research Unit, South African Medical Research Council (SAMRC),
Cape Town, South Africa. 8Department of Biochemistry and Microbiology, University of Zululand, KwaDlangezwa
DCM proceeds in three different stages: asymptomatic, diastolic and systolic stages, respectively. In its asymp-tomatic stage, the disease is characterized by abnormal left ventricular relaxation, referred to as left ventricular dysfunction (LVD). These functional abnormalities can be seen in 40–60% of asymptomatic diabetic cases using Doppler echocardiography, Tissue Doppler Imaging (TDI) echocardiography analysis or Speckle Track Imaging (STI) echocardiography9. Also, diabetic patients with subclinical diastolic dysfunction (DD) have a
5-year motility rate of 30% compared to the 12.1% for non-diabetic patients with no diastolic dysfunction10. As
DCM enters its later stage, it progresses from DD to overt heart failure with preserved ejection fraction, which has no proven effective treatment nor a biomarker available that can detect the early onset of DCM8. TDI- and
STI echocardiograph analysis are the only imaging technologies available to detect DCM in its asymptomatic stage. However, these techniques are not always available, especially in developing countries. Current diagnostic markers include N-terminal pro b-type brain natriuretic peptide (NT-proBNP) and cardiac troponin T (cTn-T). However, none of these markers are able to detect DCM, either in its asymptomatic stage or early enough to have a therapeutic impact.
As such, there is a need for a prognostic marker that can improve early detection of DCM prior to the onset of irreversible complications. However, despite numerous clinical and pharmacological intervention studies, DCM remains elusive warranting new strategies to identify asymptomatic detection of the disease state. In this study, using an in silico predictive method the combination use of two possible biomarkers was identified, Lysyl Oxidase Like 2 (LOXL2) and Electron Transfer Flavoprotein Beta Subunit (ETFβ). The presence of the identified markers was then screened in the serum of db/db mice with confirmed LVDD.
Results
DCM biomarker prediction.
Meta-analysis of publicly available microarray data sets using ArrayExpress resulted in approximately 15,485 and 16,450 common Ensemble IDs for T2DM and CVD, respectively. Upon statistical differential expression analysis, using the QD binning approach, 812 and 296 differential expressed genes (DEGS) were identified for T2DM and CVD, respectively. Thereafter, using a similar quantile discretiza-tion (QD) analysis, T2DM and CVD genes were integrated, and 228 common genes were identified. Due to limited serum availability in the animal study and to prevent bias, the top 2 genes were selected according to their Wilcoxon score (p value < 6 × 10⁻⁶), namely LOXL2 and ETFβ, for further downstream analysis (Fig. 1).Morphometric analysis of risk factors associated with DCM.
To assess the presence of cardiac risk factors in our db/db model, fasting blood glucose levels (FBG) and serum lipids levels were investigated (Table 1). In this study, diabetic (db/db) mice presented with significantly increased body weight/tibia length at age 6, 9, 11 and 16 weeks when compared to the non-diabetic (db/ +) control. There were no differences in heart weight/tibia length (data not shown), as well as the heart rate between db/db mice and aged-matched con-trols (p > 0.05). Fasting blood glucose levels, cholesterol, triglycerides and low-density lipoproteins (LDL) of db/ db mice were significantly elevated from 9 weeks onwards when compared to their age-matched controls. The observed effects are characteristic of metabolic syndrome that continued throughout the study.mRNA expression analysis of LOXL2 and ETFβ in cardiac tissue.
The expression of the two can-didate biomarkers was verified in cardiac tissue of leptin-receptor-deficient mice. The results obtained showed a marked increase in LOXL2 mRNA expression at 11-weeks (sevenfold, p < 0.001) when comparing db/db mice to the db/+ control. This expression difference was maintained at both 14-weeks (fourfold, p < 0.1) and 16-weeks (sixfold, p < 0.01) (Fig. 2A). ETFβ mRNA expression, on the other hand, tends to increase until 11-weeks (1.8-fold) when comparing db/db mice to db/+ control, after which a tendency to decrease in expression was observed at 14- (1.2-fold) and 16-weeks (1.3-fold), (Fig. 2B).LOXL2, ETFβ and proBNP protein are expressed in the serum of obese mice.
To explore the effect of LOXL2 and ETFβ as a prognostic marker, we tested if the identified proteins are released from thecar-Figure 1. Venn diagram of differentially expressed genes (DEGs). Within the type 2 diabetes mellitus (T2DM)
and cardiovascular disease (CVD) datasets, 812 and 296 candidate genes were identified respectively. Integration of the T2DM and CVD datasets, a diabetic cardiomyopathy (DCM) dataset was generated, in which 2 possible candidate genes were identified based on their Wilcoxon score (p value < 6 × 10⁻⁶).
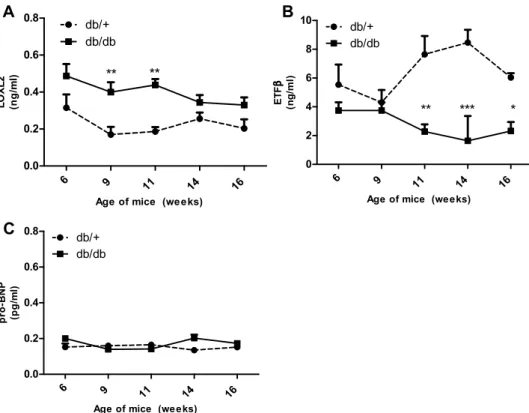
diac interstitial space into the circulation. Results obtained showed that LOXL2 levels were significantly elevated in the serum of obese animals at 9- (p < 0.01), and 11-weeks (p < 0.01) when compared to age-matched controls, whereas serum levels at 6-, 14- and 16-weeks showed an increasing trend (p > 0.05) (Fig. 3A). Next serum protein levels of ETFβ were investigated and data obtained showed that protein levels of db/db mice showed no change at 6 and 9 weeks (p > 0.05) and were significantly reduced at 11- (p < 0.01), 14- (p < 0.001) and 16-weeks (p < 0.05) when compared to the control (Fig. 3B). Interestingly, measurements of serum NT-pro-BNP (the known HF biomarker) was unchanged between 6 and 16 weeks. (p > 0.05) (Fig. 3C).
Table 1. Risk markers of cardiovascular dysfunction in db/db mice compared to their wild type control
(db/ +). BW body weight, LDL low-density lipoprotein, FBG fasting blood glucose levels. *p ≤ 0.015, **p < 0.01 ***p ≤ 0.001 versus wild type control (db/ +) at the same time point.
Wild type (db/ +) Obese (db/db)
6 weeks 9 weeks 11 weeks 14 weeks 16 weeks 6 weeks 9 weeks 11 weeks 14 weeks 16 weeks
BW (g)/tibia length
(mm) 1.21 ± 0.03 1.28 ± 0.06 1.34 ± 0.03 1.38 ± 0.02 1.33 ± 0.03 1.68 ± 0.06*** 1.96 ± 0.03*** 2.11 ± 0.07*** 1.80 ± 0.14*** 1.69 ± 0.11** FBG (mmol/L) 8.33 ± 0.58 7.09 ± 0.29 8.91 ± 5.15 6.94 ± 0.71 10.46 ± 8.07 12.50 ± 0.52 22.74 ± 2.76*** 28.30 ± 1.88*** 29.50 ± 1.44*** 27.33 ± 9.20*** Cholesterol (mol/L) 1.90 ± 0.07 2.37 ± 0.41 1.75 ± 0.03 1.85 ± 0.05 2.12 ± 0.17 3.90 ± 0.21*** 3.45 ± 0.59* 3.79 ± 0.24** 3.90 ± 0.34** 3.77 ± 0.20*** LDL (mmol/L) 0.30 ± 0.00 0.30 ± 0.00 n/a 0.30 ± 0.00 0.30 ± 0.00 0.55 ± 0.05** 0.37 ± 0.08 n/a 0.50 ± 0.15 0.53 ± 0.10** Triglycerides
(mmol/L) 0.84 ± 0.14 0.77 ± 0.08 n/a 1.10 ± 0.13 0.78 ± 0.17 2.43 ± 0.22** 2.10 ± 0.56 n/a 3.11 ± 0.36 1.86 ± 0.65**
6 9 11 14 16 0 1 2 3 4 5 6
db/+
db/db
*** * *Age of mice (weeks)
LO XL 2 mR NA exp ressi on (n or ma lize d to HP RT an d β-Act in ) 6 9 11 14 16 0 1 2 3 4 5 6
db/+
db/db
Age of mice (weeks)
ET F β mR NA ex pr essi on (n or ma lize d to HP RT an d β -Act in )
A
B
Figure 2. mRNA expression of LOXL2 and ETFβ in hearts tissue of 6–16-week-old db/db mice. Differential
mRNA expression of (A) Lysyl Oxidase Like 2 (LOXL2) and (B) Electron transfer flavoprotein subunit beta (ETFβ) in heart tissue of leptin receptor-deficient mice (db/db) compared to aged matched lean control (db/ +). Results are expressed as mean ± SEM of n = 4–8 animals per group. *p < 0.05 and ***p ≤ 0.001 compared to wild type control (db/ +).
High resolution Doppler echocardiography analysis as the gold standard to detect diabetic
cardiomyopathy.
High-resolution Doppler echocardiography analysis was used to record structural and functional measurements of left ventricular remodeling in db/db and control mice as summarized in Fig. 4 and Supplementary Table S1. No significant difference in left ventricular internal diameter, left ventricular posterior wall thickness-end diastole and left ventricular mass at 6, 9, 11,14 and 16 weeks of age were observed in db/db compared to db/+ control (p > 0.05). As shown in Fig. 4, significant impairement in LV systolic dysfunction was observed at 16 weeks in db/db mice while diastolic dysfunction, as assessed by a decrease in mitral E:A ratio, was diagnosed as early as 11 weeks (Fig. 4). Diastolic dysfunction was also confirmed by a significant increase in E6 9 11 14 16 0.0 0.2 0.4 0.6 0.8 db/+ db/db ** **
Age of mice (weeks)
LO XL 2 (n g/ ml ) 6 9 11 14 16 0 2 4 6 8 10 db/+ db/db *** ** *
Age of mice (weeks)
ET F β (n g/ ml ) 6 9 11 14 16 0.0 0.2 0.4 0.6 0.8 db/+ db/db
Age of mice (weeks)
pro-BN P (pg/ ml )
A
B
C
Figure 3. Expression of serum LOXL2 and ETFβ in 6–16-week-old Leptin receptor-deficient db/db mice and
aged matched controls. (A) Lysyl Oxidase Like 2 (LOXL2), (B) Electron transfer flavoprotein subunit beta (ETFβ) and (C) N-terminal pro b-type natriuretic peptide protein expression in serum of leptin receptor-deficient mice (db/db) compared to aged matched lean control (db/ +). Results are expressed as mean ± SEM of n = 8 animals per group. *p < 0.05, **p < 0.01 and ***p < 0.001 compared to wild type control (db/ +) at the same point.
Figure 4. High-resolution Doppler echocardiography analysis in 6–16-week-old Leptin receptor-deficient
db/db mice and their age matched db/+ heterozygous non-diabetic control group. (A) Measurement of left ventricular ejection fraction (LVEF) as a marker of systolic function; (B) Measurement of mitral E:A ratio as a marker of left ventricular diastolic function. Results are expressed as mean ± SEM of 6–8 animals per group. Statistical significance was evaluated using Mann–Whitney test . *p < 0.05, **p < 0.01, and ***p < 0.001 compared to aged matched wild type control.
wave deceleration time (EDT) and in isovolumic relaxation time (IVRT) in db/db compared to db/+ at both 14 and 16 weeks (Supplementary Table S1).
Serum LOXL2, ETFβ and NT-proBNP correlation analysis with mitral E:A ratio.
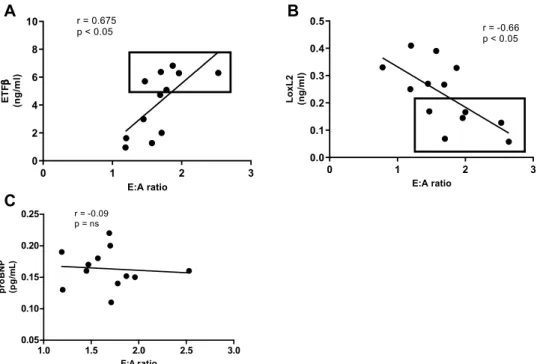
In clinical prac-tice the mitral E:A ratio is currently used as an indication of the degree of HF, guiding the implementation of interventions. Therefore, we examined the correlation between serum levels of the two candidate biomarkers (LOXL2, ETFβ) as well as NT-proBNP, using the Pearson’s correlation test, and observed no linear relationship between serum levels of NT-proBNP and the mitral E:A ratio (r = 0.05) (Fig. 5C). However, a strong (downhill) negative linear relationship was observed between serum LOXL2 levels and the E: A ratio (r = − 0.65, p = 0.01), while a positive correlation was observed between ETFβ and the E: A ratio (Pearson correlation, r = 0.65,p < 0.001) (Fig. 5A,B). Based on the correlation analysis, we suggest that LOXL2 and ETFβ could serve as poten-tial biomarkers for the diagnosis of DCM.
siRNA analysis of LOXL2 and ETF β.
In order to assess the functional role LOXL2 and ETFβ may play in collagen crosslinking, H9c2 cells treated with siRNA were exposed to high glucose (HG) and palmitate (PAL). Results obtained showed that HG and PAL significantly increased scr_LOXL2, while decreasing scr_ETFβ when compared to the untreated control (p < 0.001) (Fig. 6A,C). Alternatively, cells treated with either si_LOXL2 or si_ETFβ showed significantly decreased mRNA expression when compared to the control (p < 0.001 and p < 0.01, respectively) (Fig. 6A,C). Subsequently, the role of LOXL2 and ETFβ on the expression on COL1A was assessed. Results obtained showed that H9c2 cells transfected with the si_LOXL2, and post-treated with HG and PAL, resulted in a significant decrease in COL1A mRNA expression (p < 0.01) when compared to the scrambled (Fig. 6B). Similarly, H9c2 cells transfected with si_ETFβ showed significantly decreased COL1A mRNA expres-sion (Fig. 6D).Determination of sensitivity and specificity of LOXL2 and ETFβ as a predictive biomarker.
In order to evaluate the diagnostic ability of the two candidate biomarkers (LOXL2 and ETFβ) and it’s possible use in a clinical setting, a generalised linear model was used to test for significant differences (p < 0.001) between db/+ and db/db mice at each week and compared to that of NT-proBNP. The results obtained showed no significant differences for NT-proBNP and LOXL2 at all the evaluated time points. Conversely, ETFβ showed significant differences at week 11 and 14 (p < 0.01) (Table 2). Subsequently, the results for the three biomarkers (NT-proBNP, LOXL2 and ETFβ) were combined to perform principal component analysis (PCA). Results showed that the first principal component accounted for almost 89% of the variation in the data, which was the linear combination of the three biomarkers (data not shown). To conduct ROC curve analysis the mice groups were either specified (db/+ or db/db) or unspecified. Receiver Operating Characteristic (ROC) curves, for NT-proBNP and LOXL20 1 2 3 0 2 4 6 8 10 r = 0.675 p < 0.05 E:A ratio ET Fβ (n g/ ml ) 0 1 2 3 0.0 0.1 0.2 0.3 0.4 0.5 r = -0.66 p < 0.05 E:A ratio LoxL 2 (n g/ ml )
B
A
C
1.0 1.5 2.0 2.5 3.0 0.05 0.10 0.15 0.20 0.25 r = -0.09 p = ns E:A ratio proB NP (p g/ mL )Figure 5. Correlation analysis of serum LOXL2, ETFβ and proBNP with mitral E:A ratio in Leptin
receptor-deficient db/db mice at 16 weeks. Mitral E:A ratio is a marker of left ventricular diastolic dysfunction, (A) Lysyl Oxidase Like 2 (LOXL2), was negatively and (B) Electron transfer flavoprotein subunit beta (ETFβ) was positively correlated with mitral E:A ratio, while no correlation was observed with (C) N-terminal pro b-type natriuretic peptide (proBNP).
Contr ol scr_E TF si_ET F 0.0 0.5 1.0 1.5 100µM PAL and 33 mM HG * ** ET Fβ mRNA expr es sion (n or ma lize d to HP RT an d β-A ctin ) Contr ol scr_L OXL2 si_LO XL2 0 1 2 3 4 100µM PAL and 33 mM HG ** *** *** LO XL 2 mR NA ex pre ssi on
A
B
D
C
Contr ol scr_E TF si_ET F 0.0 0.5 1.0 1.5 100µM PAL and 33mM HG * COL1 A m RNA expr es sion (n or ma lize to HP RT an d β-A ctin ) Contr ol scr_L OXL2 si_LO XL2 0.0 0.5 1.0 1.5 2.0 2.5 *** ** 100 µM PAL and 33 mM HG CO L1 A mR NA exp re ss io n (n or ma lize to HP RT an d β-A ct in )Figure 6. Effect of LOXL2 knockdown on Col1A and ETFβ expression. The degree of knockdown after H9c2
cardiomyocytes transfected with (A) siLOXL2 and (C) siETFβ was exposed to 100 µM Palmitate (PAL) and 33 mM glucose (HG). The relative mRNA expression of the fibrosis gene, COL1A in (B) LOXL2 and (D)
ETFβ after transfection of cells with either small interfering RNA (siRNA) or scrambled RNA (scrRNA). The
expression levels were normalized relative to the control. Statistical significance was evaluated using the one-way ANOVA with a Tukey Post-hoc t-test. This graph represents the SEM of triplicate samples. p < 0.05, p < 0.01 and
p < 0.001 when compared to control or scrambled control.
Table 2. Statistical analysis for all biomarkers. *ETFβ, at 11 and 14 weeks have a significant difference
(p = 0.01).
Mice age (weeks) t value p value
NT-proBNP 6 − 2.05 0.096 9 1.33 0.23 11 1.85 0.1 14 − 1.05 0.34 16 − 1.22 0.25 ETFβ 6 1.94 0.09 9 0.59 0.57 11 3.91 0.001* 14 3.67 0.001* 16 3.08 0.022 LOXL2 6 0.11 0.92 9 − 2.39 0.04 11 − 4.29 0.09 14 0.23 0.82 16 − 1.98 0.08
generated area under the curve (AUC) values that remained non-significant in both specified and unspecified groups (data not shown). However, results obtained for ETFβ demonstrated an AUC of 0.679 when the groups were not specified (Fig. 7A), which increased to 0.797 when they were specified (Fig. 7B). These results suggested that ETFβ may be sensitive and specific enough to detect DCM.
Combination use of LOXL2 and ETFβ.
Since there was a significant difference in the expression of both biomarkers, LOXL2 and ETFβ, between mice at 9 weeks to 14 weeks, a principal component analysis was per-formed by combining the two datasets to further improve their diagnostic ability. This linear combination was also used to generate ROC curves. Data presented for the linear combination of LOXL2 and ETFβ showed an AUC of 0.795 with a cutoff point of 0.789 when the groups were not specified (Fig. 7C). However, the AUC was significantly increased to 0.813 when the groups were specified, with a cutoff value of 0.824 (Fig. 7D). The latter demonstrated a good predictive power of the model, thus implying that, compared with ETFβ alone, the com-bination of the ETFβ and LOXL2 as a biomarker is more sensitive and potentially has a higher diagnostic value.Discussion
Currently, there is no single prognostic test that is sensitive enough to detect the pre-clinical onset of LVDD11,12.
Although brain natriuretic peptide (BNP) and NT-pro-BNP are well-established serum markers used to detect cardiac abnormalities, they are unable to predict the early onset of DCM12,13. This was confirmed in the current
study. Furthermore, TDI echocardiography, Phase-Magnetic Resonance Imaging and 2D/3D-Speckle Track-ing echocardiography are all non-invasive diagnostic methods with the ability to diagnose and stratify LVDD in diabetic patients. However, these tests are expensive and not done routinely as they are specialized equip-ment that requires trained personal which is not available in all healthcare facilities. Recently, sodium-glucose linked transporter (SGLT2) inhibitors have been recognized as a new class of drugs that can protect the diabetic
Figure 7. Receiver operating characteristics (ROC) of LOXL2 and ETFβ between 9 and 14 weeks. ROC curve
analysis of ETFβ with (A) groups not specified and (B) groups specified. (C) Linear combination of LOXL2 and ETFβ when groups are not specified and when (D) groups are specified a good predictive cut-off point of 0.824 was obtained. Logistic regression was used to perform ROC, p < 0.05.
myocardium. However, clinicians are currently faced with the dilemma of when to start treating diabetic indi-viduals with SGLT2 inhibitors. Thus, a routine biomarker would greatly aid the confirmation of the presence of cardiac dysfunction and would allow an opportunity for the implementation of corrective therapy.
In the current study, we confirmed the occurrence of two potential serum biomarkers, LOXL2 and ETFβ, to detect early onset of DCM. The presence of serum LOXL2 was first reported by Yang followed by Zhao who argued that augmented LOXL2 enhances collagen crosslinking that consequently increases cardiac fibrosis14,15.
Pertaining to ETFβ, Lu reported that decreased ETFβ expression was implicated in mitochondrial shift in sub-strate preference16,17. Also, in a review conducted by Lorenzo and colleagues, the mentioned disease
patho-physiology came under investigation and the authors concluded that both processes (augmented fibrosis and mitochondrial dysfunction) play a major role in the development of diabetes-induced HF11,18. However, none
of the mentioned studies aimed to investigate the combined use of the identified serum biomarkers. As such, our current study is the first to investigate the use of LOXL2 and ETFβ as a combination biomarker for early detection of DCM.
The db/db mouse model is a well-established heart failure animal model in which mice develop diabetes by 8 weeks of age19,20 with increased LDL, cholesterol and triglycerides observed by week 921,22. We observed that
by 6 weeks, diabetic mice weighed significantly more and presented with increased FBG, triglycerides, LDL and cholesterol levels. The latter are known features of DCM and were confirmed in a study conducted by Dludla, where the authors showed that increased FBG and lipid profiles are key risk predictors of cardiac fibrosis and subsequent HF22. Furthermore, it has been argued by Fang that myocardial functional changes do not progress
in parallel with histological changes8. Instead, diabetic individuals have a long latent phase in which functional
abnormalities, induced by the hyperglycaemic state, precede the onset of any structural changes. This was con-firmed by Liu who argued that DCM has a long latent phase in which subtle structural modifications occur in the absence of symptomatic onset of the disease23. The current study confirmed this with echocardiography changes
confirming the presence of reduced ejection fraction whilst subtle changes in fibrosis was observed at 16 weeks (Supplementary Data, Figure S1). However, changes in LOXL2 were concomitant with echocardiography data. This was confirmed by Alex who further argued that the db/db mouse model in the C57BL6J background is a pathophysiological relevant model to study diabetes-induced cardiac dysfunction as it displays a marked increase in cardiac risk predicters, however, cardiac fibrosis using this specific model are only detected at 6 months only (24 weeks)24. Taken together, these results confirm that this model displays a T2DM phenotype, whilst high
cholesterol and LDL levels are important risk parameters for CVD development, thus, making it a clinically relevant model to test the identified biomarkers.
During disease progression, cardiac hypertrophy is usually characterized by an increase in interstitial fibrosis with augmented triglycerides and LDL affecting oxidative phosphorylation, myocardial structure as well as gene and protein expression of essential genes within this process22. In the present study, we found an increase in
mRNA expression of LOXL2, after 11 weeks of age, which was concomitant with an impairment in LV diastolic function. This was the first study to show such an increase in diabetic cardiomyopathy. The observed increase at 11 weeks of LOXL2 expression was confirmed by various other HF studies other than diabetes, where the authors showed an increase in mRNA expression of LOXL2 was positively correlated with increased tissue fibrosis14,25,26.
Similarly, in a study performed by Zhao, it was argued that serum LOXL2 levels were positively correlated to the degree of left atrial fibrosis in Atrial fibrillation (AF) patients15. Furthermore, findings from Lu and later studies
by Karthik argued that ETFβ may be modulated during the development of insulin resistance in pancreatic β cells whereas the upregulation reduced cardiovascular dysfunction 17,27. Conversely, Boudina showed that after
exposing db/db mice to increased palmitate, protein expression levels of ETFβ were significantly decreased, however no coordinate increase in oxidative phosphorylation was observed28. Nonetheless, more recently in a
study done by Ruiz-Pinto, it was found that susceptible variants in the ETFβ is a major contributor to anthra-cycline-mediated oxidative stress and myocardial injury. Inferring that decreased ETFβ expression is linked to myocardial dysfunction29. Our study made use of a db/db mice model who confirmed previous findings from
Yang14 and Lu17, using different models showing that differential expression of LOXL2 and ETFβ was concomitant
to increased ROS. Inferring that LOXL2 and ETFβ might be implicated in the disease pathophysiology of DCM. During disease progression, increased gluco- and lipotoxicity affect mitochondrial substrate preference ensu-ing in the enlargement of the heart muscle and hinderensu-ing the ability of the myocardium to pump blood through the body effectively. As cardiomyopathy progresses, the heart becomes weaker due to reduced ejection fraction and is less able to pump blood through the body effectively. Although the precise age of onset in heart muscle deterioration in DCM is still incompletely understood, the development of LVD can directly be associated with increased fibrosis and development of LV wall thickness and decreased mitral E:A ratio. Mitral E:A ratio and ejection fraction are currently used as measurements of the hearts’ ability to function optimally. In our study, we found that our identified serum markers correlated with cardiac dysfunction when the disease was still in its asymptomatic stage. This implies that the change in the circulatory markers (LOXL2 and ETFβ) are as a result of the diabetic state that induces functional changes prior to the onset of any pathological changes. As such, the observed differential expression of the biomarkers is complicit to the maladaptive structural modifications that follow. According to Fuentes-Antras the maladaptive structural changes underlies the observed changes as shown by echocardiography, confirming that the hyperglycaemic state is the cause of LVD30.
Furthermore, this study showed that knockdown of either LOXL2 or ETFβ was able to reduce the expression of COL1A, a gene associated with increased fibrosis. Increased interstitial fibrosis, in the stressed heart, triggers the formation of enhanced collagen deposition that stiffens the heart muscle, while impairing diastolic relaxa-tion and filling. Increased collagen deposits are not only concomitant to increased COL1A expression but also reduced ejection fraction and LV remodeling. Our data presented, therefore, infers that collagen formation might be modulated by LOXL2 and ETFβ. Our findings are supported by two independent research groups report-ing on the role of LOXL2 and ETFβ and their association with increased fibrosis14,31,32. In addition, ROC curve
analysis strongly supports that the identified markers were sensitive enough to detect the early onset of DCM, as confirmed by the AUC of 0.813 which is an indication of a good predictive test.
Study limitations
A limitation to this study was the inability to show the role ETFβ plays in mitochondrial bioenergetics and the effect a loss in ETFβ enzyme activity has on the respiratory chain, and subsequent ATP production. According to Boudina28, ETFβ is an electron acceptor that transfers electrons between Acyl-CoA substrates to the main
respiratory chain, ubiquinone, which links the oxidation of fatty acids to the mitochondrial respiratory system. As such, a loss of function or decreased ETFβ is known to alter cardiac mitochondrial flux, which consequently is the hallmark of DCM. To address this future studies should consider assessing the link between ETFβ and respiratory chain function and mitochondrial ultrastructural abnormalities within the disease state.
Furthermore, it would have been of interest to follow disease progression from asymptomatic until a late stage of DCM, using LOXL2 and ETFβ as serum biomarkers. Also, scarring as a consequence of hyperglyceamia is a progressive disease that worsens over time, with no cure and attaining treatment early might slow progression whilst maintaining the quality of life of the affected individual. Based on findings presented including studies performed by Yang14 and Lu17 it could be suggested that those diabetic patients (in this study reference is made to
mice) with early dysregulation of serum LOXL2 and ETFβ levels may be treated prophylactically in order to slow the progress of CVD. The proposed implementation strategy might be cost-intensive, however, in time patients might benefit from such treatment through increased life expectancy. As such, a follow-up human study should be initiated to prove such a hypothesis as the scope of this study did not encompass this important aspect. In the case of whether the identified markers can be used as either a preventative or even therapeutic intervention, it requires further investigation in order to support the clinical implication of the attained results.
Conclusion
It is well known that that increased hyperglycemia and augmented lipid accumulation are the main drivers of myocardial dysfunction and subsequent heart failure. In our study, a change in previously identified possible cardiac markers, LOXL2 and ETFβ, was confirmed in the serum of db/db mice and correlated with increased LVDD, as observed with high-resolution Doppler echocardiography14,17,27,28. We observed a significant increase in
FBG and serum lipids levels from 9 weeks onwards. This was concomitant with increased LOXL2 and decreased ETFβ serum levels at 9 and 11 weeks, respectively. Confirming a diabetic phenotype that was sustained until termination. As such, it would have been of interest to investigate if the identified changes occur only in the diabetic phenotype, regardless of whether they develop CVD and/or whether only the diabetic animals that eventually develop CVD had differentially regulated levels of the identified markers. Further investigation would need to be conducted to address this issue.
Furthermore, this study brings further insights to suggest that LOXL2 and ETFβ might be implicated in the pathophysiology of DCM. Mechanistically, we propose that both identified biomarkers were able to regulate the expression of COLA1, a known cardiac fibrotic marker14. Most importantly, our data strongly suggest that the
combined use of LOXL2 and ETFβ displayed a good predictive power to detect the early onset of DCM and as such, support that the disease progression can be slowed through early intervention.
Materials and methods
In silico prediction of DCM biomarkers.
Data acquisition and processing. In order to identifycandi-date genes differentially expressed in diabetic cardiomyopathy (DCM), the ArrayExpress database (https ://www. ebi.ac.uk/array expre ss) was screened for studies with publicly available microarray datasets belonging to Homo sapiens over 35 years of age. These studies included healthy controls and patients suffering from either type 2 diabetes mellitus (T2DM) or cardiovascular disease (CVD). To provide specificity for the disease state of interest (DCM), studies involving ischemia, CAD and hypertension were excluded; while studies inclusive of LVD and left ventricular ejection fraction (EF) were included with no restriction on ethnic group, gender, tissue or cell type.
For studies, utilising the Affymetrix and Agilent platform, raw datasets were extracted from Gene Expres-sion Omnibus (GEO) using R scripting and the R package, GEOquery. Samples within these datasets fulfilling the specified criteria were then Robust-Multi array Average (RMA) normalised using the R package, Simpleaffy. Additionally, studies using a custom spotted oligonucleotide array was also included. These raw datasets were imported into R using the ArrayExpress package, while the Limma package was used for normalisation. Subse-quently, microarray probe identifiers (IDs) in all the processed datasets were converted to Ensemble IDs or gene names, using a custom Python script. Probe sets, mapping multiple Ensembl IDs and technical replicates, were averaged to resolve probe redundancy using R and Ruby scripting.
Dataset integration and candidate gene identification. Differential expression analysis was performed in three
stages: 1) to obtain differentially expressed genes (DEGs) for T2DM only, 2) to obtain DEGs for CVD only and 3) to obtain DEGs for integrated datasets from both T2DM and CVD, representing the DCM group. To this end, common Ensemble IDs were combined using a quantile discretization (QD) data binning approach, which inte-grates different microarray data at the gene expression level. In this study, a QD range of 128 was used to com-bine datasets in the T2DM and CVD subgroups only for statistical differential expression analysis, while a QD range of 1,028 was used for the integration (i.e. DCM) subgroup. Genes with a p-value of < 0.05 were regarded as significantly different using the Wilcoxon Rank Sum Test with Bonferroni and Benjamin-Hochberg correction for multiple testing. To prevent bias and due to limited samples, only the top 2 genes based on their Wilcoxon score were used for subsequent biomarker analysis.
In vivo validation.
Animals sample size and randomization. Male C57BLKS/J leptin-receptor-deficientmice were obtained from Jackson’s Laboratories (Sacramento, USA) and housed at the Primate Unit and Delft Animal Centre (PUDAC) of the South African Medical Research Council (SAMRC) in a controlled environ-ment with a 12 h light/dark cycle in a temperature range of 23-25ºC (relative humidity: ∼50%). The mice re-ceived standard laboratory chow pellets (Afresh Vention, Cape Town, SA) ad libitum and had free access to water. At 6 weeks, based on their genetic background, mice were divided into 2 groups: (1) homozygous leptin receptor-deficient diabetic (db/db, n = 40) mice and (2) heterozygous leptin-receptor-deficient non-diabetic wild type controls (db/+, n = 40). Each group was then further divided into a total of 5 subgroups (week 6, 9, 11, 14, 16), with n = 6–8 animals per subgroup. After each week, (6, 8, 9, 11, 14 and 16) high-resolution Doppler echocardiography was performed, and animals were terminated to collect blood and heart tissue for subsequent serum biomarker analysis. Ethical clearance for the use of animals was obtained from South African Medical Research Council (SAMRC) (ECRA 07/13) and all experiments were conducted in accordance with the National Institute of Health Guide for the Care and use of laboratory animals.
Echocardiography analysis. The mice were placed in a holding chamber and gassed with 1.0–2.5% isoflurane,
whereafter they were removed and positioned in the supine position on a warming pad. Closed chest high-reso-lution Doppler echocardiography was performed with a VEVO 2,100 ultrasound system (Fujifilm, Visualsonics, Ontario, Canada) and a 30 MHz linear array transducer at the respective time intervals. Left ventricular internal diameter, interventricular septum thickness, posterior wall thickness were measured in systole and diastole (Fig-ure S2). EF was meas(Fig-ured as a marker of systolic function. Mitral E and A wave flow velocity, E:A ratio, decelera-tion time of mitral E wave velocity and isovolumic relaxadecelera-tion time (IVRT) were assessed as measurements of LVD using Doppler echocardiography (Figure S2). All measurements were made off-line on the mean of at least three consecutive cardiac cycles with the software resident on the ultrasound system.
Body weights and fasting blood glucose levels. Body weights were measured weekly, while 4 h FBG levels were
monitored by tail prick using a OneTouch Select glucometer (Lifespan, Milpitas, CA, USA).
Cardiovascular disease risk predictors. On the day of termination, mice were anaesthetised with halothane
before blood was collected from the abdominal vena cava for subsequent lipid profile and serum biomarker analysis. Serum was isolated from peripheral blood by centrifugation at 4,000 g for 15 min. Thereafter, the serum was removed and divided into two parts; one part was sent to PathCare Medical Diagnostic Laboratories (Cape Town, RSA) for total cholesterol, triglycerides and LDL analysis; while the other half was stored at -80ºC for subsequent serum biomarker analysis.
Detection of LOXL2, ETFβ and proBNP in serum. LOXL2, ETFβ and NT-proBNP concentrations were
meas-ured with enzyme-linked immunosorbent assay (ELISA) (MYbioscource, Berlin, Germany), according to the manufacturer’s instructions.
Functional analysis using an in vitro model.
Cell culture. H9c2 cardiomyoblasts were cultured insupplemented Dulbecco’s Modified Eagle’s Medium (10% fetal bovine serum, 100 µg/mL penicillin and 100 µg/ mL streptomycin) under standard tissue culture conditions (37 °C in humidified air and 5% CO2). Cells were seeded in a 6-well plate at a seeding density of 2 × 10⁴ cells/well and left for 2–3 days until confluent. On day 4, cells were utilised for transfection experiments using siRNA.
Knockdown of LOXL2 and ETFβ using small Interfering RNA (SiRNA). Knockdown experiments for the two
selected candidate biomarkers were done using a Lipofectamine RNAimax reagent (ThermoFisher Sceintific, Inc, Waltham, MA, USA), according to the manufacturer’s instructions. Briefly, H9c2 cells at approximately 70% confluence were transfected with either siLOXL2, siETFβ or scrRNA for LOXL2 or ETFβ for 24 h, respectively. Thereafter, transfected cells were exposed to both high glucose (HG; 33 mM) and palmitate (PAL; 100 µM) for 6 h. The degree of knockdown after 24 h of transfection was confirmed by RT-PCR. Non-transfected cells, exposed to either 5.5 mM glucose or 33 mM glucose, served as controls, respectively.
Gene expression analysis using quantitative real‑time polymerase chain reaction (qRT‑PCR). Total RNA was
extracted using the TRIzol method (ThermoFisher Scientific Inc, Waltham, MA, USA), and subsequently puri-fied with an RNeasy mini kit according to the manufacturer’s instructions. The extracted RNA was treated with DNase1 (Applied Biosystems, Foster City, CA, USA) to eliminate genomic DNA contamination and reversed transcribed to generate cDNA with a Superscript first-strand cDNA synthesis kit (Applied Biosystems, Foster City, CA, USA) as per previously described protocol33. Thereafter, qRT-PCR analysis was performed using 5 µL
Taqman Universal PCR master mix, 0.5 µL predesigned and optimized TaqMan gene expression assays (LOXL2: Mm00804740_m1; ETFβ: Mm005033401_m1) and 1 µL cDNA on an ABI 7,500 Instrument (Applied Biosys-tems, Life Technologies, USA). The PCR reaction was as follows: 50 °C for 1 min and 95 °C for 10 min; followed by 95 °C for 15 s and 60° C for 30 s (40 cycles). Gene expression data was normalized to that of Actin-β (ACT‑
β) and hypoxanthine–guanine phosphoribosyltransferase (HPRT) and relative gene expression was calculated
using the standard curve method.
Statistical analysis.
All data obtained throughout this study are expressed as the mean ± standard error of the mean (SEM) where appropriate. Results for in vitro experiments were expressed as the mean of threeinde-pendent biological experiments, with each experiment containing at least three technical replicates, unless oth-erwise stated. For in vivo experiments, each treatment group included six mice. Differences between the means of groups were first tested for normality with Shapiro–Wilk tests. In the instances where data sets were normally distributed, they were assessed for statistical significance using one-way or two-way multivariate ANOVA and Student t-tests, while non-parametric Mann–Whitney U tests were used to analyse data sets deviating from1 a
normal distribution. To evaluate the diagnostic potential of each biomarker, principal component (PCI) analy-sis was performed by combining the data for the identified biomarkers and receiver operating characteristic (ROC) curve analysis, where an area under the curve (AUC) greater than 0.5 indicated diagnostic value. Sub-sequently, the ROC curve analysis was used to calculate corresponding sensitivity and specificity. To measure the strength and nature of the relationship between the expression levels of the candidate biomarkers and mitral E:A ratio, correlation analysis was performed using a Pearson and Spearman coefficient test. Statistical analyses were performed using GraphPad Prism software version 5.00 (GraphPad Software, Inc., La Jolla, CA, USA). In all instances, statistical significance was inferred for a p-value less than, or equal to 0.05.
Received: 5 December 2019; Accepted: 23 June 2020
References
1. IDF. International Diabetes Federation (IDF) Diabetes Atlas (9th Edition) Global fact sheet. 1–2 (2019). 2. WHO. World Health Organization. Hypertensive Fact Sheet (2019).
3. Rubler, S. et al. New type of cardiomyopathy associated with diabetic glomerulosclerosis. Am. J. Cardiol. 30, 595–602 (1972). 4. Bertoluci, M. C. & Rocha, V. Z. Cardiovascular risk assessment in patients with diabetes. Diabetol. Metab. Syndr. 9, 25. https ://doi.
org/10.1186/s1309 8-017-0225-1 (2017).
5. Miki, T., Yuda, S., Kouzu, H. & Miura, T. Diabetic cardiomyopathy: pathophysiology and clinical features. Heart Fail. Rev. 18, 149–166. https ://doi.org/10.1007/s1074 1-012-9313-3 (2013).
6. Boudina, S. & Abel, E. D. Diabetic cardiomyopathy revisited. Circulation 115, 3213–3223. https ://doi.org/10.1161/circu latio naha.106.67959 7 (2007).
7. Guo, R. & Nair, S. Role of microRNA in diabetic cardiomyopathy: from mechanism to intervention. Biochem. Biophys. Acta. 2070–2077, 2017. https ://doi.org/10.1016/j.bbadi s.2017.03.013 (1863).
8. Fang, Z. Y., Prins, J. B. & Marwick, T. H. Diabetic cardiomyopathy: evidence, mechanisms, and therapeutic implications. Endocr.
Rev. 25, 543–567. https ://doi.org/10.1210/er.2003-0012 (2004).
9. Lee, W. S. & Kim, J. Diabetic cardiomyopathy: where we are and where we are going. Korean J. Int. Med. 32, 404–421. https ://doi. org/10.3904/kjim.2016.208 (2017).
10. Bui, A. L., Horwich, T. B. & Fonarow, G. C. Epidemiology and risk profile of heart failure. Nat. Rev. Cardiol. 8, 30–41. https ://doi. org/10.1038/nrcar dio.2010.165 (2011).
11. Lorenzo-Almoros, A. et al. Diagnostic approaches for diabetic cardiomyopathy. Cardiovasc. Diabetol. 16, 28 (2017).
12. Leon, L. E., Rani, S., Fernandez, M., Larico, M. & Calligaris, S. D. Subclinical detection of diabetic cardiomyopathy with microRNAs: challenges and perspectives. J. Diabetes Res. 2016, 6143129. https ://doi.org/10.1155/2016/61431 29 (2016).
13. Romano, S. et al. Early diagnosis of left ventricular diastolic dysfunction in diabetic patients: a possible role for natriuretic peptides.
Cardiovasc. Diabetol. 9, 89. https ://doi.org/10.1186/1475-2840-9-89 (2010).
14. Yang, J. et al. Targeting LOXL2 for cardiac interstitial fibrosis and heart failure treatment. Nat. Commun. 7, 13710. https ://doi. org/10.1038/ncomm s1371 0 (2016).
15. Zhao, Y. et al. Increased serum lysyl oxidase-like 2 levels correlate with the degree of left atrial fibrosis in patients with atrial fibril-lation. Biosci. Rep. 37. https ://doi.org/10.1042/bsr20 17133 2 (2017).
16. Jiang, J. et al. Increased mitochondrial ROS formation by acetaminophen in human hepatic cells is associated with gene expression changes suggesting disruption of the mitochondrial electron transport chain. Toxicol. Lett. 234, 139–150. https ://doi.org/10.1016/j. toxle t.2015.02.012 (2015).
17. Lu, H., Yang, Y., Allister, E. M., Wijesekara, N. & Wheeler, M. B. The identification of potential factors associated with the develop-ment of type 2 diabetes: a quantitative proteomics approach. Mol. Cell. Proteomics MCP 7, 1434–1451. https ://doi.org/10.1074/ mcp.M7004 78-MCP20 0 (2008).
18. Lorenzo, O., Ramirez, E., Picatoste, B., Egido, J. & Tunon, J. Alteration of energy substrates and ROS production in diabetic car-diomyopathy. Mediat. Inflamm. 2013, 461967. https ://doi.org/10.1155/2013/46196 7 (2013).
19. Belke, D. D. & Dillmann, W. H. Altered cardiac calcium handling in diabetes. Curr. Hypertens. Rep. 6, 424–429 (2004). 20. Kobayashi, K. et al. The db/db mouse, a model for diabetic dyslipidemia: molecular characterization and effects of Western diet
feeding. Metab. Clin. Exp. 49, 22–31 (2000).
21. Inoue, T. et al. Downregulation of adipose triglyceride lipase in the heart aggravates diabetic cardiomyopathy in db/db mice.
Biochem. Biophys. Res. Commun. 438, 224–229. https ://doi.org/10.1016/j.bbrc.2013.07.063 (2013).
22. Dludla, P. V. et al. Age-dependent development of left ventricular wall thickness in type 2 diabetic (db/db) mice is associated with elevated low-density lipoprotein and triglyceride serum levels. Heart Vessels 32, 1025–1031. https ://doi.org/10.1007/s0038 0-017-0978-3 (2017).
23. Liu, Q., Wang, S. & Cai, L. Diabetic cardiomyopathy and its mechanisms: Role of oxidative stress and damage. J. Diabetes Invest. 5, 623–634. https ://doi.org/10.1111/jdi.12250 (2014).
24. Alex, L., Russo, I., Holoborodko, V. & Frangogiannis, N. G. Characterization of a mouse model of obesity-related fibrotic cardio-myopathy that recapitulates features of human heart failure with preserved ejection fraction. Am. J. Physiol. Heart Circul. Physiol. 315, H934–H949. https ://doi.org/10.1152/ajphe art.00238 .2018 (2018).
25. Gonzalez-Santamaria, J. et al. Matrix cross-linking lysyl oxidases are induced in response to myocardial infarction and promote cardiac dysfunction. Cardiovasc. Res. 109, 67–78. https ://doi.org/10.1093/cvr/cvv21 4 (2016).
26. Chen, L., Li, S. & Li, W. LOX/LOXL in pulmonary fibrosis: potential therapeutic targets. J. Drug Targeting https ://doi. org/10.1080/10611 86x.2018.15506 49 (2018).
27. Karthik, D., Vijayakumar, R., Pazhanichamy, K. & Ravikumar, S. A proteomics approach to identify the differential protein level in cardiac muscle of diabetic rat. Acta Biochim. Pol. 61, 285–293 (2014).
28. Boudina, S. et al. Mitochondrial energetics in the heart in obesity-related diabetes: direct evidence for increased uncoupled respira-tion and activarespira-tion of uncoupling proteins. Diabetes 56, 2457–2466. https ://doi.org/10.2337/db07-0481 (2007).
29. Ruiz-Pinto, S. et al. Exome array analysis identifies ETFB as a novel susceptibility gene for anthracycline-induced cardiotoxicity in cancer patients. Breast Cancer Res. Treat. 167, 249–256. https ://doi.org/10.1007/s1054 9-017-4497-9 (2018).
30. Fuentes-Antras, J. et al. Targeting metabolic disturbance in the diabetic heart. Cardiovasc. Diabetol. 14, 17. https ://doi.org/10.1186/ s1293 3-015-0173-8 (2015).
31. Hirokawa, S., Shimanuki, T., Kitajima, H., Nishimori, Y. & Shimosaka, M. Identification of ETFB as a candidate protein that participates in the mechanoregulation of fibroblast cell number in collagen gel culture. J. Dermatol. Sci. 64, 119–126. https ://doi. org/10.1016/j.jderm sci.2011.08.003 (2011).
32. Hirokawa, S., Shimanuki, T., Kitajima, H., Nishimori, Y. & Shimosaka, M. Knockdown of electron transfer flavoprotein beta subunit reduced TGF-beta-induced alpha-SMA mRNA expression but not COL1A1 in fibroblast-populated three-dimensional collagen gel cultures. J. Dermatol. Sci. 68, 179–186. https ://doi.org/10.1016/j.jderm sci.2012.09.012 (2012).
33. Johnson, R. et al. Aspalathin, a dihydrochalcone C-glucoside, protects H9c2 cardiomyocytes against high glucose induced shifts in substrate preference and apoptosis. Mol. Nutr. Food Res. 60, 922–934. https ://doi.org/10.1002/mnfr.20150 0656 (2016).
Acknowledgements
The work reported herein was made possible through funding by the South Africa Medical Research Council’s Biomedical Research and Innovation Platform baseline funding as well as Division of Research Capacity Devel-opment Internship Scholarship and Intra-mural Post-doctoral Program, South African Rooibos Council and the National Research Foundation (NRF) Thuthuka Programme Grant 107261. NRF echocardiograph large equipment Grant at the University of Cape Town. We would like to thank Charna Chapman, Desmond Linden, Samira Ghoor, Ruzayda van Aarde and Joritha van Heerden for technical support.
Author contributions
RJ conceptualized, designed, wrote and edited the manuscript. X.N. conducted the experiments and collected and analyzed the data. T.J. performed the mRNA expression analysis and edited the manuscript. N.S. performed siRNA expression analysis. E.S. contributed to the siRNA design, analysis and edited the manuscript. M.M. performed the receiver operating characteristic (ROC) analysis. M.C. performed TDI echocardiography, ana-lyzed the data and edited the manuscript. N.H. performed TDI echocardiography and edited the manuscript. S.L. performed TDI echocardiography and edited the manuscript. M.B. reviewed and edited the manuscript. J.L. acquired funding.
Competing interests
The authors declare no competing interests.
Additional information
Supplementary information is available for this paper at https ://doi.org/10.1038/s4159 8-020-69254 -x.
Correspondence and requests for materials should be addressed to R.J.
Reprints and permissions information is available at www.nature.com/reprints.
Publisher’s note Springer Nature remains neutral with regard to jurisdictional claims in published maps and
institutional affiliations.
Open Access This article is licensed under a Creative Commons Attribution 4.0 International
License, which permits use, sharing, adaptation, distribution and reproduction in any medium or format, as long as you give appropriate credit to the original author(s) and the source, provide a link to the Creative Commons license, and indicate if changes were made. The images or other third party material in this article are included in the article’s Creative Commons license, unless indicated otherwise in a credit line to the material. If material is not included in the article’s Creative Commons license and your intended use is not permitted by statutory regulation or exceeds the permitted use, you will need to obtain permission directly from the copyright holder. To view a copy of this license, visit http://creat iveco mmons .org/licen ses/by/4.0/.