HAL Id: hal-01228101
https://hal.archives-ouvertes.fr/hal-01228101
Submitted on 12 Feb 2021HAL is a multi-disciplinary open access archive for the deposit and dissemination of sci-entific research documents, whether they are pub-lished or not. The documents may come from teaching and research institutions in France or abroad, or from public or private research centers.
L’archive ouverte pluridisciplinaire HAL, est destinée au dépôt et à la diffusion de documents scientifiques de niveau recherche, publiés ou non, émanant des établissements d’enseignement et de recherche français ou étrangers, des laboratoires publics ou privés.
human bronchial epithelial barrier.
Isabelle George, Grégoire Naudin, Sonja Boland, Stéphane Mornet, Vincent
Contremoulins, Karine Beugnon, Laurent Martinon, Olivier Lambert, Armelle
Baeza-Squiban
To cite this version:
Isabelle George, Grégoire Naudin, Sonja Boland, Stéphane Mornet, Vincent Contremoulins, et al.. Metallic oxide nanoparticle translocation across the human bronchial epithelial barrier.. Nanoscale, Royal Society of Chemistry, 2015, 7 (10), pp.4529-4544. �10.1039/c4nr07079h�. �hal-01228101�
Metallic oxide nanoparticle translocation across the human bronchial
epithelial barrier
Isabelle George *a, Grégoire Naudin b, Sonja Boland a, Stéphane Mornet c, Vincent Contremoulins d,
Karine Beugnon e, Laurent Martinon e, Olivier Lambert b and Armelle Baeza-Squiban *a
aUniv Paris Diderot, Sorbonne Paris Cité, Unit of Functional and Adaptive Biology (BFA) (BFA) UMR 8251 CNRS, F-75205, Paris,
France. E-mail: [email protected]; [email protected]; Tel: +33 1 57 27 83 35
bCBMN Architecture of Membrane Complexes and Cellular Processes – CBMN UMR CNRS 5248 University Bordeaux 1, IPB
Bâtiment B14 - Allée Geoffroy Saint-Hilaire, 33600 Pessac, France
cChemistry of Condensed Matter Institute of Bordeaux, UPR CNRS 9048, University Bordeaux 1, 87 Avenue du Docteur A.
Schweitzer, F-33608 Pessac cedex, France
dJacques Monod Institute, CNRS, UMR 7592, University Paris Diderot, Sorbonne Paris Cité, ImagoSeine BioImaging Core
Facility, France.
eInhaled Particles Laboratory (LEPI), Paris City, 11, rue George Eastman, 75013 Paris, France
Footnote :
† Electronic supplementary information (ESI) available: 1. NP synthesis. 2. NP characterization. 3. NP cytotoxicity and pro-inflammatory response. 4. Modulation of cellular permeability after NP treatment and NP retention inside the Calu-3 monolayer after 1 week of exposure. 5. NP translocation through TF in the absence of cells as a function of NP concentration, composition or corona. 6. Confocal microscopy observations of NCI-H292 cells exposed to fresh and conditioned media. 7. Quantification of NP internalization by Calu-3 cells by flow cytometry. See DOI: 10.1039/c4nr07079h
Inhalation is the most frequent route of unintentional exposure to nanoparticles (NPs). Our aim was to quantify the translocation of different metallic NPs across human bronchial epithelial cells and to determine the factors influencing this translocation. Calu-3 cells forming a tight epithelial barrier when grown on a porous membrane in a two compartment chamber were exposed to fluorescently labelled NPs to quantify the NP translocation. NP translocation and uptake by cells were also studied by confocal and transmission electron microscopy. Translocation was characterized according to NP size (16, 50, or 100 nm), surface charge (negative or positive SiO2), composition (SiO2 or TiO2), presence of proteins or
phospholipids and in an inflammatory context. Our results showed that NPs can translocate through the Calu-3 monolayer whatever their composition (SiO2 or TiO2), but this translocation was increased for the
smallest and negatively charged NPs. Translocation was not associated with an alteration of the integrity of the epithelial monolayer, suggesting a transcytosis of the internalized NPs. By modifying the NP corona, the ability of NPs to cross the epithelial barrier differed depending on their intrinsic properties, making positively charged NPs more prone to translocate. NP translocation can be amplified by using agents known to open tight junctions and to allow paracellular passage. NP translocation was also modulated when mimicking an inflammatory context frequently found in the lungs, altering the epithelial integrity and inducing transient tight junction opening. This in vitro evaluation of NP translocation could be extended to other inhaled NPs to predict their biodistribution.
Introduction
During the last few decades the widespread use of nanomaterials (NMs) in many fields such as cosmetics, electronics or textile industries has raised questions about their potential adverse health effects.1
tract, or skin,2 and their unique properties are suspected to favour their ability to easily cross protective
biological barriers. The respiratory tract, as an interface organ, is a major route of NP entry after involuntary exposure and NPs can deposit all along the airways as a function of their physicochemical properties. Conducting airways, composed of a mucociliary epithelium, contribute to the particle clearance through a “mucociliary escalator”. The mucus lining the epithelium helps to trap the particles present in the inhaled air and is expelled by the activity of ciliated cells.2,3 Moreover the presence of a belt
of tight junctions on the apical side of the cells prevents the passage of exogenous particles through the paracellular space, thus restricting their access to the interstitium.4–6 In the alveolar region, the most
potent mechanism for solid particle clearance is mediated by alveolar macrophages through phagocytosis of deposited particles that is, however, less efficient for NPs.2,3
Despite all these protective mechanisms in vivo studies have shown important lung retention. Previous studies have revealed that cerium,7 gold8–10 or iridium11 NPs could be trapped inside rat or mice lungs.
This NP pulmonary retention is associated with NP translocation to the systemic circulation followed by a bio-distribution into different organs.7,10,12,13In vivo studies having provided evidence of translocation, in
vitro models of biological barriers are needed to characterize the NP determinants favouring their capacity to go through protective epithelium and to determine the underlying mechanisms. Numerous in vitro studies have investigated the mechanisms of NP internalization and have determined that NPs can enter cells by active transport via macropinocytosis,14,15 caveolae-mediated processes,16,17 or
clathrin-dependant pathways.18–20 However, very few in vitro studies have questioned the mechanism of NP
translocation through the pulmonary barrier.
The physicochemical characteristics of NPs involved in their fate have not yet been clearly identified. In addition to their intrinsic features such as shape, size, composition, or surface charges, the biological medium encountered by the NPs could influence their behaviour and interaction with cells due to modifications of their agglomeration and the formation of a corona.21,22 In the respiratory tract, this
corona could include proteins of the mucus layer and of the epithelial lining fluids and molecules of the alveolar surfactant.23,24 In the context of respiratory diseases, translocation could be increased. People
suffering from chronic inflammatory diseases such as asthma or COPD (chronic obstructive pulmonary disease) could be more susceptible to NP penetration.
In this study our aim was the characterization and the quantification of the translocation of NPs across an in vitro model of the pulmonary barrier according to the physicochemical properties of the NPs and the integrity of the bronchial epithelium. For this purpose, we used different metal oxide NPs: SiO2-NPs of
three different sizes (16, 50, 100 nm) with negative or positive surface charges, and TiO2-coated SiO2-NPs
with a size of 140 nm. These NPs were fluorescently labelled for facilitating their detection after cellular uptake or to follow their translocation.16,25,26 We performed our experiments with the Calu-3 cell line
seeded onto a Transwell Filter (TF) because of their in vitro abilities to develop a confluent and tight monolayer.27–30 Qualitative experiments by confocal and transmission electron microscopy (TEM) were
carried out to determine NP internalization by Calu-3 monolayers. Furthermore fluorescence measurements of media inside the apical and basolateral chambers allowed the reliable quantification of NP translocation across the Calu-3 epithelium. NP translocation was compared according to their size, charge and composition as well as treatment conditions (the presence or absence of foetal calf serum (FCS) or dipalmitoyl lecithin (DPL) which has been suspected to form a protein or lipid corona respectively). To mimic inflammatory pathological conditions, the epithelial monolayer was previously exposed to the pro-inflammatory mediator tumor necrosis factor-alpha (TNF-α) or to lipopolysaccharide (LPS) to stimulate an inflammatory response.
Briefly, we have demonstrated a NP translocation based on NP physicochemical characteristics without cytotoxicity. NP translocation followed NP uptake by Calu-3 cells which highlights transcytosis
mechanisms. NP translocation could be modulated by the formation of a protein or lipid corona. Mimicking pathological contexts frequently observed in the lungs, we noted a paracellular NP translocation in addition to the transcytosis pathway.
Results and discussion
NP characterization
The NP synthesis process was validated by Transmission Electron Microscopy (TEM) observations (ESI S1A†) showing the expected NP sizes and by Diffuse Reflectance Infrared Fourier Transform (DRIFT) spectroscopy (ESI S2A†). The different NPs were compared for their isoelectric point by laser Doppler interferometry showing the same surface features for fluorescent and non-fluorescent NPs (IEP, ESI S2B†). Evaluation of the ratio between Si and Ti elements measured by ICP-OES for the TiO2-coated SiO2-NPs of
140 nm size allowed confirmation of the estimated 2 nm thickness of the TiO2 (ESI S2C†).
Characterization of NPs suspended in DMEM/F-12 medium at 5 μg cm−2 was performed by measurements
of Dynamic Light Scattering (DLS) and zeta Potential (Pz) (ESI S1B†). These experiments have shown small agglomerates for all NPs. We could note that SiO2-FITC-NPs+ have formed larger agglomerates than SiO2
-FITC-NPs. Furthermore a negative surface charge in DMEM/F12 culture medium was observed for each batch of NPs. This low absolute charge could explain the colloidal instability. It was previously described for polymer NPs of different surface charges.31
Calu-3 monolayer characterization
We chose to use Calu-3 cell lines as these cells were able to form a confluent (Fig. 1A) and tight epithelium after 14 days of growth on a TF of 3 μm porosity. Liquid covered cultures were chosen for this study as they develop tighter junctions and a less permeable cell layer compared to air–liquid interface cultures32
and because exposure was performed with NPs in the liquid phase. These cells kept their capacities to secrete mucus,33,34 and more specifically the MUC5AC mucin (Fig. 1B). The immunodetection of
zonula-occludens 1 (ZO-1) and claudin-4 (CLD-4) proteins (Fig. 1C and 1D) known for their binding to tight junctions, and labelling of the actin filaments (Fig. 1E) revealed the formation of a tight and confluent epithelium. Moreover we have previously demonstrated that Calu-3 cells developed a strong trans-epithelial electric resistance (TEER) of 1200 mV after 14 days of culture when the passage of a fluorescent marker, the Lucifer Yellow (452 Da), was prevented.28 Our results are in accordance with those of Florea
and collaborators obtained for Calu-3 cells seeded onto a 0.4 μm pore TF.35 Altogether these
characteristics make Calu-3 cells an appropriated cell line to study NP translocation across a pulmonary epithelium27,28,36,37 by comparison with other human pulmonary cell lines such as NCI-H292 and A549 cells
that did not form a tight epithelium.28,38–40
NP exposure did not alter the epithelial monolayer viability and integrity
As determined by the WST-1 metabolic cytotoxicity assay, NPs were not cytotoxic for Calu-3 cells exposed to 16, 50, 100 nm SiO2-FITC-NPs or 140 nm TiO2-coated SiO2-FITC-NPs until 50 μg cm−2 for 24 h (ESI Fig.
S3A†). The absence of SiO2-NP cytotoxicity has previously been shown for several cell types such as
fibroblasts, but for other cells like macrophages SiO2-NPs have induced an important toxicity but only at
very high concentrations up to 1000 μg mL−1.41,42 This discrepancy could be attributed to SiO
2-NP
In our study we limited NP treatments to 5 and 10 μg cm−2 to ensure complete absence of cytotoxicity.
Moreover at these concentrations no, or a low, pro-inflammatory response characterized by IL-8 release was observed after NP treatment (ESI Fig. S3B†). NP fluorescence was easily detected and it could be considered as non-excessive exposure concentrations. In addition we have evaluated whether NP treatment could alter epithelial barrier integrity by measuring TEER values before and after 24 h of NP treatment. After 24 h of exposure at 5 and 10 μg cm−2 we observed an increase of TEER. This result
indicated that NPs did not alter the integrity of tight junctions and suggested that NPs could not cross the cellular monolayer through the paracellular pathway (ESI Fig. S4A†).
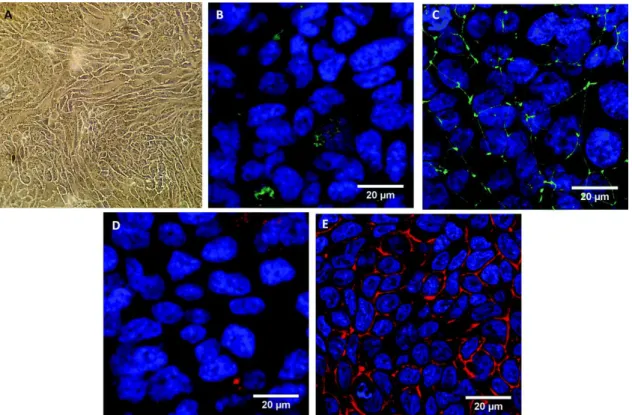
Fig. 1 Morphological characterization of the Calu-3 epithelium without any treatment. Control Calu-3 cells were observed
by optical microscopy (A) or confocal microscopy (B–E) after 14 days of TF-culture. The (x;y) images correspond to the z-projection of a stack of 5 to 10 images acquired. Staining of the cells is as follows: blue – DAPI-stained nuclei, green – (B)
MUC5AC protein labelled with Alexa-488-anti mouse antibody or (C) ZO-1 protein labelled with Alexa-488-antirabbit antibody, red – (D) CLD-4 protein labelled with Alexa-568-antigoat antibody, or (E) phalloidin-stained actin filaments. The
scale bar corresponds to 20 μm.
NP uptake into the epithelial monolayer
To support the hypothesis of a NP transcytosis, we assessed NP uptake by Calu-3 cells (Fig. 2A). Confocal microscopy observations allowed the demonstration of NP internalization and that NP uptake did not modify actin organization and ZO-1 distribution to tight junctions. Orthogonal views clearly demonstrated that NPs were located inside the cellular monolayer and very few NPs adsorbed on the top of the cells. The pictures revealed a heterogeneous NP distribution and NP agglomerates inside the cellular monolayer whatever the NP size.
It has been known that NPs could be internalized by cells through different mechanisms, among which is clathrin-mediated or caveolae-mediated endocytosis.20,43,44 Despite NP endocytosis in Calu-3 cells was
very poorly documented, a study has shown that Calu-3 cells exposed to amphiphilic glycopolymer NPs could internalize NPs by clathrin-mediated endocytosis or lipid raft/caveolae-mediated endocytosis but not by macropinocytosis.45 Other NP types have been shown to be internalized by Calu-3 cells as CeO
-NPs as a function of their effective density and so their sedimentation speed29 or as PLGA
(poly(lactide-co-glycolide)) NPs coated by using PVA (poly(vinyl alcohol)) or poloxamer F68.46,47
Fig. 2 Internalization of SiO2-FITC-NPs inside the Calu-3 monolayer. (A) Cells were exposed for 24 h to 16, 50, and 100
nm SiO2-FITC-NPs at 5 μg cm−2. The (x;y) left images correspond to the z-projection of a stack of 5 to 10 images acquired
by confocal microscopy. Orthogonal views represent (x,z)- and (y,z)-slices of the section indicated by the green lines. Staining of the cells is as follows: blue – DAPI-stained nuclei, green – SiO2-FITC-NPs, red – phalloidin-stained actin
filaments or ZO-1 protein labelled with Alexa-568-antirabbit antibody. The (x;y) right images corresponding to the z-projection of a stack of 5 to 10 images acquired by using only the green channel for a better observation of SiO2-FITC-NP
distribution inside the cellular monolayer. The scale bar corresponds to 20 μm. (B) Cells exposed, or not, for 24 h to 50 nm SiO2-FITC-NPs at 5 μg cm−2 were observed by TEM. The 50 nm SiO2-FITC-NPs were found on the apical and basolateral
side of the cell inside vesicles with a simple or double membrane. The scale bar corresponds to 200 nm and NPs are indicated by red arrows.
TEM observations revealed individualized 50 nm SiO2-FITC-NPs at the apical and basolateral sides of the
cell (Fig. 2B) whereas no similar signal was observed for non-treated cells control (Fig. 2B). Interestingly no NPs have been found inside cell nuclei in TEM observations in contrast to confocal microscopy results obtained in a previous study performed on human oral buccal mucosa cells treated with SiO2-NPs.94 NPs
were visible inside large double membrane vesicles containing membrane or organelle fragments (Fig. 2B) that could be specific to a lysosome-based degradative pathway, the autophagy.48 Recently several
studies established that some NPs such as gold NPs,49,50 fullerenes51,52 or quantum dots53,54 could induce
autophagy and thus NPs may become a novel class of autophagy activators.50,55 Immunolabelling with
anti-LC3-II to specifically identify autophagosomes was performed on Calu-3 treated with 16 nm SiO2
-FITC-NPs at 5 μg cm−2 for 24 h (Fig. 3). Cells exhibited a LC3-II-autophagosome accumulation after
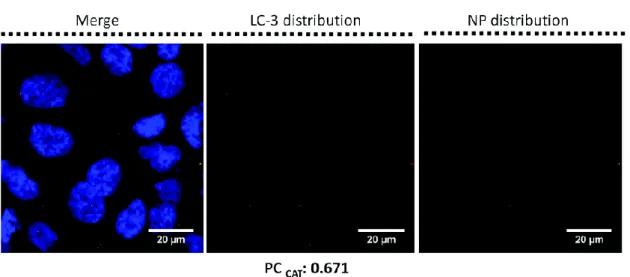
treatment compared to controls (data not shown) that could be either due to the increased production or blocking of the degradation of the autophagosome. Moreover Pearson coefficient (PC) calculation provided evidence of a co-localisation of NPs inside autophagosomes (Fig. 3). Although a low NP signal was detected, PC reflects the difference between the fluorescence level of NPs and LC3-II staining and could not be due to background noise.93
Fig. 3 Detection of autophagy inside NP-treated Calu-3 cells. Calu-3 cells were exposed to 16 nm SiO2-FITC-NPs at 5 μg
cm−2 for 24 h. Confocal microscopy experiments were performed after cell fixation. The (x;y) left images corresponding to the z-projection of a stack of 5 to 10 images acquired. Staining of the cells is as follows: blue – DAPI-stained nuclei, green
– 16 nm SiO2-FITC-NPs, red – LC3-II proteins labelled with Alexa-568-antirabbit antibody. The (x;y) central images
corresponding to the z-projection of a stack of 5 to 10 images acquired by using only the red channel for a better observation of LC3-II expression. The (x;y) right images corresponding to the z-projection of a stack of 5 to 10 images acquired by using only the green channel for a better observation of 16 nm SiO2-FITC-NP distribution inside the cellular
monolayer. The scale bar corresponds to 20 μm. Pearson coefficient (PC) was calculated by Image J software; PC (LC3-II) = 0.116. To improve PC a Costes’ Automatic Threshold (PCCAT) was performed and new PC was obtained;93 PCCAT
(LC3-II) = 0.671.
NP translocation across the Calu-3 epithelium
To determine if NPs could translocate depending on their size, Calu-3 cells were treated for 24 h with 16, 50, 100 nm SiO2-FITC-NPs at 5 and 10 μg cm−2. By measuring fluorescence in the apical and basolateral
compartments, NP concentrations were determined using a standard curve and compared to the initial applied concentration. NP translocation across TF in the absence of cells was firstly determined to ensure that 3 μm porosity filters were not a limitation to our experiments (ESI Fig. S5†).
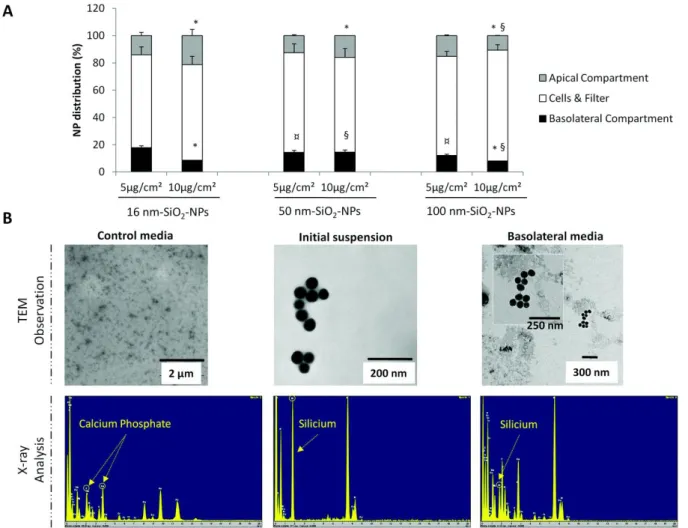
Regardless of NP size, fluorescence can be detected inside the basolateral compartment, suggesting that a NP translocation occurred for all NPs (Fig. 4A). However the rate of NP translocation was lower after treatment at 10 μg cm−2 than that after treatment at 5 μg cm−2; for instance 16 nm SiO
2-FITC-NP
translocation was determined at 17.9% and 8.6% corresponding to 0.89 μg cm−2 or 0.86 μg cm−2
(respectively for initial concentration at 5 and 10 μg cm−2). NP translocation tended to be more important
for the smaller NPs at low concentration. For example, after initial NP treatment at 5 μg cm−2 we
determined a NP translocation of 17.9%/14.4%/12.1% respectively for 16/50/100 nm SiO2-FITC-NPs. Low
levels of fluorescence were revealed in apical compartments, suggesting a low retention unlike the very high retention inside the cellular & filter compartment. While the NP exposure was generally limited to 24 h, we observed that NPs could be retained inside the cellular monolayer even 1 week after treatment (ESI Fig. S4B†).
Several studies underlined that one disadvantage of fluorescently labelled NPs could be the potential leakage of the fluorochrome from the NPs.56,57 To ascertain that the fluorescence measurement in the
basolateral side was really related to NP translocation and not to a leakage of fluorescence, two control experiments were performed. Initial NP suspension, control basolateral media, and basolateral media recovered after exposure to 50 nm SiO2-FITC-NPs were observed by TEM and analyzed by X-ray (Fig. 3B).
while no NPs were detected inside the control media. X-ray analysis attested the absence of silicon (but a calcium phosphate peak) in control media whereas a peak of SiO2 was detected in initial and basolateral
suspensions. These results provided evidence that NPs have translocated across the Calu-3 epithelium. Moreover these basolateral media were used to expose another cell line, NCI-H292 cells for 6 h showing fluorescent agglomerates not observed in cells exposed to free FITC (ESI Fig. S6†), confirming NP translocation.
Fig. 4 NP translocation across the Calu-3 monolayer as a function of the size and the concentration. Calu-3 cells were
treated for 24 h with 16, 50, and 100 nm SiO2-FITC-NPs at 5 and 10 μg cm−2. (A) Quantification of NP distribution in
percentage inside the apical (grey bar), basolateral (black bar) and the cells & filter (white bar) compartments. Data were expressed as mean ± SEM, n = 4. *: different from 5 μg cm−2 value (p < 0.05); ¤: different from 16 nm SiO
2-FITC-NPs
value at 5 μg cm−2 (p < 0.05); §: different from 16 nm SiO
2-FITC-NPs value at 10 μg cm−2 (p < 0.05). (B) For 50 nm SiO2
-FITC-NPs: observation of basolateral media of control cell cultures, initial suspension and Calu-3 basolateral media after 24 h of exposure to 50 nm SiO2-FITC-NPs by TEM, and the corresponding X-ray analysis.
NP translocation was dependent on NP surface charges
To study the impact of surface charge of the NPs on cellular uptake and translocation, SiO2-FITC NPs were
synthesized with a positive surface charge (SiO2-FITC-NPs+) and compared with SiO2-FITC-NPs. Confocal
microscopy observations demonstrated that these positive NP were taken up without modifying actin filaments and ZO-1 distribution to tight junctions, as already observed for negatively charged SiO2
-FITC-NPs (Fig. 2A). SiO2-FITC-NPs+ exhibited a heterogeneous distribution within the cellular monolayer that
was more diffuse and seemed more important (Fig. 5A) than for NPs with a negative surface charge (Fig. 2A). Many in vivo studies provided evidence that positively charged NPs were absorbed more efficiently than negatively or neutrally charged NPs58,59 that led to a better blood clearance and a higher
been demonstrated for selenium NPs,61 gold NPs,62 or iron NPs63,64 compared to their respective anionic
NPs. Cellular uptake mechanisms were also governed by NP surface charge as reported in the overview presented by Fröhlich.65
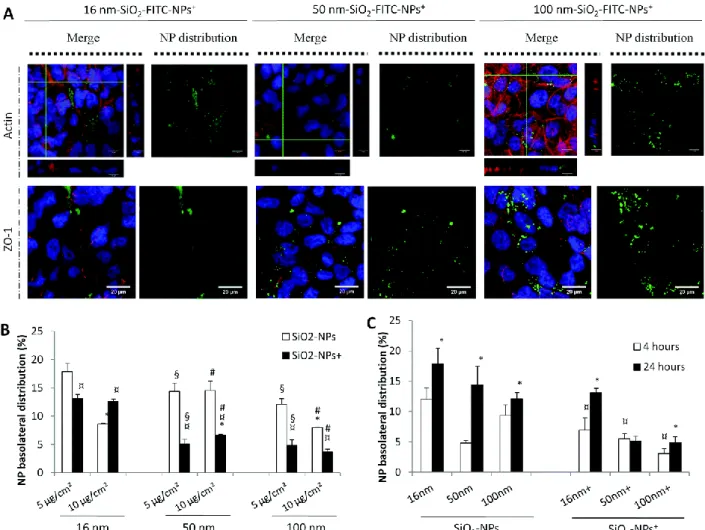
Fig. 5 Internalization of SiO2-FITC-NPs+ by Calu-3 cells and their translocation across the monolayer in comparison with
SiO2-FITC-NPs. Calu-3 cells were exposed to 16, 50, and 100 nm SiO2-FITC-NPs+ at 5 μg cm−2 for 24 h before being
rinsed and fixed for (A) confocal microscopy experiments. The (x;y) left images corresponding to the z-projection of a stack of 5 to 10 images acquired. Orthogonal views represent (x,z)- and (y,z)-slices of the section indicated with the green lines.
Staining of the cells is as follows: blue – DAPI-stained nuclei, green – SiO2-FITC-NPs+, red – phalloidin-stained actin
filaments or ZO-1 protein labelled with Alexa-568-antirabbit antibody. The (x;y) right images corresponding to the z-projection of a stack of 5 to 10 images acquired by using only the green channel for a better observation of SiO2-FITC-NP+
distribution inside the cellular monolayer. The scale bar corresponds to 20 μm. (B) Quantification of NP distribution in percentage inside the basolateral compartment as a function of the surface charge of the NP, in white SiO2-FITC-NP and in
black SiO2-FITC-NP+. Data were expressed as mean ± SEM, n = 3. *: different from 5 μg cm−2 value (p < 0.05); ¤:
different from SiO2-FITC-NPs (p < 0.05); §: different from 16 nm-SiO2-FITC-NPs value at 5 μg cm−2 (p < 0.05); #:
different from 16 nm-SiO2-FITC-NPs value at 10 μg cm−2 (p < 0.05). (C) Calu-3 cells were exposed to 16, 50, and 100 nm
SiO2− or SiO2+-FITC-NPs at 5 μg cm−2 for 4 h (white bar) or 24 h (black bar) before quantification of NP distribution in
percentage inside the basolateral compartment as a function of the time of exposure. Data were expressed as mean ± SEM, n = 3. *: different from 4 h-treatment (p < 0.05); ¤: different from SiO2-FITC-NPs value after 4 h of treatment (p < 0.05).
Comparison between SiO2-FITC-NPs and SiO2-FITC-NPs+ revealed that the translocation of NPs with a
negative surface charge was the most important (Fig. 5B). The low translocation of SiO2-FITC-NPs+ was
likely not related to a low internalization. Flow cytometry analysis demonstrated that NPs were taken up by Calu-3 cells in the same amount (ESI Fig. S7†). These results were only based on NP internalization without taking into account NP adsorption onto the cellular membrane thanks to the addition of trypan blue during flow cytometry measurements. Moreover, a time-course study revealed that after 4 h of exposure translocation of SiO2-FITC-NPs was already important whereas SiO2-FITC-NPs+ translocation
or surface charge (Fig. 5B). Quantification of SiO2-FITC-NPs+ translocation across the Calu-3 epithelium
revealed that 16 nm SiO2-FITC-NPs+ translocated more easily than larger SiO2-FITC-NPs+.
Besides the influence of NP size on NP translocation, several studies have underlined the fact that the negative or positive surface charge of the NP could modulate their translocation across the air–blood barrier.3 This could be explained by the modification of NP speed and extent of agglomeration due to the
NP attraction or repulsion. NPs with the same surface charge repel each other, while neutral NPs tend more to agglomerate.66In vivo studies went further and elucidated NP passage across the lung barrier as
a function of their surface charge. Quantification of translocation in rat models of NIR fluorescent NPs which varied in surface charge (zwitterionic, polar, anionic or cationic) revealed that negatively charged NPs could easily translocate.12
NP translocation was dependent on NP composition
In order to determine whether NP composition mattered, the translocation of 140 nm TiO2-coated SiO2
-FITC-NPs was compared to 100 nm SiO2 and SiO2+-FITC-NPs. As for SiO2+-FITC-NPs, TiO2-coated SiO2
-FITC-NPs were shown to be internalized without altering the actin network and ZO-1 distribution to tight junctions and also exhibited heterogeneous distribution of large agglomerates (Fig. 6A).
Fig. 6 Internalization and translocation of 140 nm TiO2-coated SiO2-FITC-NPs by Calu-3 cells. (A) Calu-3 cells were
exposed to 140 nm TiO2-coated SiO2-FITC-NPs at 5 μg cm−2 for 24 h before being rinsed and fixed for confocal microscopy
observations. The (x;y) left images corresponding to the z-projection of a stack of 5 to 10 images acquired. Orthogonal views represent (x,z)- and (y,z)-slices of the section indicated with the green lines. Staining of the cells is as follows: blue – DAPI-stained nuclei, green – 140 nm-TiO2-coated SiO2-FITC-NPs, red – phalloidin-stained actin filaments or ZO-1 protein
labelled with Alexa-568-antirabbit antibody. The (x;y) right images corresponding to the z-projection of 5 to 10 images acquired by using only the green channel for a better observation of 140 nm TiO2-coated SiO2-FITC-NP distribution inside
the cellular monolayer. The scale bar corresponds to 20 μm. (B) Quantification of NP distribution in percentage inside the basolateral compartment for 140 nm TiO2-coated SiO2-FITC-NPs in comparison with SiO2− and SiO2+-FITC-NPs at the
cm−2 value (p < 0.05); ¤: different from SiO2-FITC-NPs value at 5 μg cm−2 (p < 0.05); §: different from SiO2-FITC-NPs
value at 10 μg cm−2 (p < 0.05).
Again we observed that the efficiency of NP translocation was higher for the lower initial NP concentration. 140 nm TiO2-coated SiO2-FITC-NPs translocated better than 100 nm SiO2-FITC-NPs+ and
less than 100 nm SiO2-FITC-NPs. This ranking is in accordance with the NP iso-electric point (IEP), IEP(SiO2)
< IEP(TiO2-coated SiO2) < IEP(SiO2+) (ESI Fig. S2A†), which could play a role in the NP retention inside the cell after
internalization. Moreover, at physiological pH SiO2-FITC-NPs and TiO2-coated SiO2-FITC-NPs were both
negatively charged but TiO2-coated SiO2-FITC-NP translocation was less important than those of SiO2
-FITC-NPs.
Quantification of translocation in rat models of NIR fluorescent NPs revealed no difference in translocation for either organic or inorganic NPs12 of the same size and charge. In vitro studies performed
on the intestinal barrier using the Caco-2 cell line seeded onto TF have demonstrated that NP translocation could be modulated by the NP composition. Indeed recent studies have shown that translocation of gold67 or 12 nm anatase titanium NPs68 across the gut epithelium varied as a function of
their physico-chemical characteristics.
Protein and lipid corona increased translocation of NPs with a positive surface charge
NPs were rapidly covered with a corona when they interact with physiological fluids.22 This phenomenon
could modulate NP–cell interactions and induce changes in cell responses.21
To investigate whether the presence of a protein corona could modify NP translocation, cells were treated with 16, 50, 100 nm SiO2- or SiO2-FITC-NPs+ at 5 μg cm−2 for 24 h in the presence or absence of
FCS (2%). Confocal microscopy observation revealed no modification of the actin network or changes in ZO-1 distribution (data not shown). The uptake of 50 nm SiO2-FITC-NPs seemed reduced after FCS
treatment and their distribution was more diffused inside the cellular monolayer (Fig. 7A) compared to cells treated with NPs in the absence of FCS. After FCS treatment, SiO2-FITC-NP translocation decreased
while SiO2-FITC-NPs+ translocation increased (Fig. 7A). This was in contrast to the results obtained in the
absence of the Calu-3 monolayer when we observed NP translocation across TF after co-exposure with FCS (ESI Fig. S5†). SiO2-FITC-NP translocation was enhanced by FCS by a factor of 3 whereas SiO2
-FITC-NP+ translocation was not modified. Altogether these data suggest that the nature of the protein corona
is quite different depending on the initial surface properties of NPs, which greatly contributes to modifying the fate of NPs.
Different proteins could form the corona such as plasma proteins69,70 or mucus proteins.23 The NP
interaction with secreted mucus of Calu-3 cells has shown to decrease the penetration of positively and neutrally charged PLGA-NPs, while PLGA-NPs coated with a hydrophilic compound (PF68) could diffuse more easily across the mucus barrier.46 While protein corona formation is possible for any NPs, Lesniak et
al. provided evidence that the formation of a protein corona around silica NPs could alter their level of uptake and the intracellular fate of NPs in A549 cells.21 Impacts were dependent on surface properties
and NP size.70 The uptake was also NP composition-dependent, and for instance the mechanisms involved
were different for polystyrene spheres,71 gold NPs,72 silica NPs,73 titanium NPs74,75 or carbon nanotubes.76
To determine whether the presence of a lipid corona could modify NP translocation, cells were treated with 16, 50, 100 nm SiO2- or SiO2-FITC-NPs+ at 5 μg cm−2 for 24 h in the presence or absence of DPL
(0.004%), a pulmonary synthetic surfactant phospholipid. Confocal microscopy observation revealed no modification of the actin network or changes in ZO-1 distribution (data not shown). We note the formation of large agglomerates of 50 nm SiO2-FITC-NPs within the Calu-3 epithelium in the presence of DPL (Fig. 7B). During co-treatment with DPL, SiO2-FITC-NP translocation was not significantly modified while SiO2
-FITC-NP+ translocation greatly increased (Fig. 7B). However these results were in contrast to those
obtained in the absence of cells (ESI Fig. S5†). SiO2-FITC-NP translocation was enhanced by DPL by a factor
of 10 whereas DPL exposure did not modulate SiO2-FITC-NP+ translocation.
Fig. 7 Modulation of the NP translocation in the presence of FCS or DPL. Calu-3 cells were exposed simultaneously with
(A) FCS at 2% or (B) DPL at 0.004% and with SiO2− or SiO2+-FITC-NPs at 5 μg cm−2 for 24 h. NP distribution in
percentage was determined for the basolateral compartment as a function of the size and the surface charge of NPs, in white the NP translocation without additives, in black in the presence of FCS or DPL. Data were expressed as mean ± SEM,
n = 6. *: different from NP treatment value without modification of cellular environment (p < 0.05); ¤: different from SiO2
-FITC-NPs value (p < 0.05). Cells were then fixed for confocal microscopy experiments. The (x;y) left images corresponding to the z-projection of 5 to 10 images acquired. Orthogonal views represent (x,z)- and (y,z)-slices of the section indicated with the green lines. Staining of the cells is as follows: blue – DAPI-stained nuclei, green – 50 nm-SiO2-FITC-NPs, red –
phalloidin-stained actin filaments. The (x;y) right images corresponding to the z-projection of 5 to 10 images acquired by using only the green channel for a better observation of 50 nm SiO2-FITC-NP distribution inside the cellular monolayer.
The scale bar corresponds to 20 μm.
It has been previously reported that NPs could interact with the pulmonary surfactant. These interactions were governed by NP physicochemical properties. Several studies using alveolar macrophages have shown an increase of NP uptake in the presence of surfactants24 potentially mediated by the surfactant
protein A.77 The surfactant protein D could also play an important role in NP uptake because of its
co-localization in A549 cells.24 Moreover, the physiological functions of the lung surfactant could also be
modified after NP exposure. A recent study has provided evidence that hydrophilic NPs could more easily translocate through the surfactant film compared to hydrophobic NPs.78 It was also demonstrated that
gold NP79 or TiO
2-NPs80 could impede the structure and function of the lung surfactant according to NP
size or surface area.
Inflammatory context enhanced NP translocation
The lung is a site of frequent inflammations related to the exposure to particles, toxins or pathogens and can show chronic inflammation66 in case of pulmonary diseases like asthma or COPD.
It is well established that the Calu-3 cell line expresses the TLR-4 (Toll like receptor-4)81 proteins involved
in the pro-inflammatory response, in order to protect the airway epithelium from endotoxins. To investigate whether NP translocation could be modulated by pathological conditions, and more particularly by an inflammatory context, the Calu-3 monolayer was pre-treated for 4 h with TNF-α (1 ng mL−1), a pro-inflammatory mediator, or LPS (25 ng mL−1), an endotoxin known as a strong inducer of
inflammation by the activation of TLR-4. Thereafter cells were exposed to 16, 50, 100 nm SiO2 or SiO2+
-FITC-NPs or 140 nm TiO2-coated SiO2-FITC-NPs at 5 μg cm−2 for 24 h. TNF-α as well as LPS-exposure clearly
induced a decrease of TEER (loss of 32% and 36% respectively), an increase of Lucifer Yellow passage (by a factor of 4 and 3 respectively) after the end of a 4 h exposure (Fig. 8A and 8C), and alterations of ZO-1 distribution (Fig. 8B) which was not exacerbated by NP treatment. These results underlined the abilities of TNF-α and LPS to alter tight junctions. It confirms the observations of Hermanns and colleagues showing the ability of TNF-α to open tight junction in an in vitro alveolar–capillary barrier.82
Fig. 8 Modulation of NP translocation in a pro-inflammatory context. Calu-3 cells were initially exposed during 4 h to
TNF-α at 1 ng ml−1, or LPS at 25 ng ml−1, then rinsed and treated for 24 h with 16, 50, 100 nm SiO2 or SiO2+-FITC-NPs or
140 nm TiO2-coated SiO2-FITC-NPs at 5 μg cm−2. (A) TEER values were determined over time, before and after exposure to
TNF-α or LPS. *: different from control (p < 0.05). (B) Cells were then fixed for confocal microscopy experiments. The (x;y) images corresponding to the z-projection of 5 to 10 images acquired. Staining of the cells is as follows: blue –
DAPI-stained nuclei, green – SiO2− SiO2+-FITC-NPs of 50 nm, red – ZO-1 protein labelled with Alexa-568-antirabbit antibody.
The scale bar corresponds to 20 μm. (C) Quantification of Lucifer Yellow (LY) distribution was determined in percentage as a function of the pro-inflammatory treatment, without (white bar), with TNF-α (grey bar), or with LPS (black bar) just after
pre-treatment, or after NP treatment. Data were expressed as mean ± SEM, n = 3. *: different from control (p < 0.05). (D) NP distribution was determined in percentage as a function of the NP composition, in white the NP translocation in a normal case, in grey in the presence of TNF-α and in black in the presence of LPS. Data were expressed as mean ± SEM, n
= 3. *: different from NP treatment value in the absence of pro-inflammatory context (p < 0.05); ¤: different from SiO2
-FITC-NPs value in the presence of TNF-α (p < 0.05); §: different from SiO2-FITC-NPs value in the presence of LPS (p <
0.05).
Quantification of the basolateral distribution of NPs after TNF-α pre-exposure has shown that 50, 100 nm SiO2+ and 140 nm TiO2-coated SiO2-FITC-NP translocation were increased by a factor of 2.6/2/ and 1.8,
respectively. However, NP translocation was not modified for SiO2-FITC-NPs and 16 nm SiO2+-FITC-NPs. In
addition, LPS pre-exposure improved 16, 50, 100 nm SiO2+ and 140 nm TiO2-coated SiO2-FITC-NP
translocation by a factor of 1.7/4.5/4.8/ and 3.7, respectively, but had no effect on SiO2-FITC-NP
translocation. These results allowed us to hypothesize that NP translocation could be enhanced by a pro-inflammatory context.
In vivo experiments have demonstrated that NP biodistribution was altered in the presence of LPS. Oropharyngeal aspiration of gold NPs has resulted in high retention of NPs in the lung treated with LPS, but in the absence of LPS, NPs were observed in the spleen.83 Tight junction opening and
pro-inflammatory response induced by LPS exposure could explain the fact that NPs have translocated in greater amounts compared to NP-treated Calu-3 cells without LPS-pretreatment.
Mechanisms of NP translocation
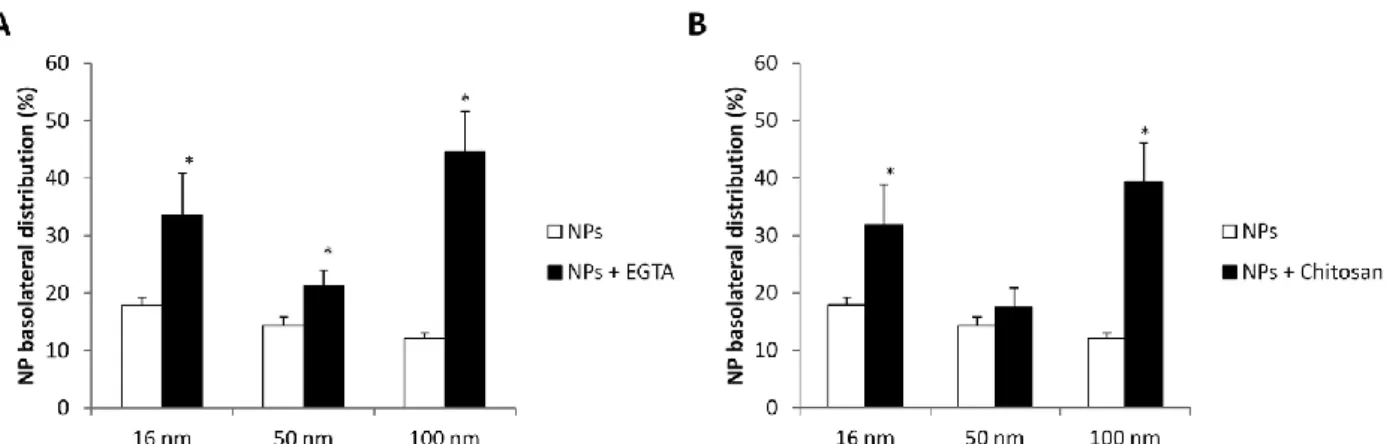
We demonstrated the translocation of the different NPs with an efficacy depending on their own properties. This raises the question of the mechanism involved in their passage. The observation of an internalization, the absence of cytotoxicity, and the stability of the TEER suggest a transcellular passage. In contrast, mimicking an inflammatory context alters the epithelial integrity and an increased translocation is observed for some NPs that could be related to a paracellular transport as the TEER is transiently reduced. To ascertain that the opening of tight junctions could increase NP translocation through the paracellular route, EGTA and CS (produced by deacetylation of chitin) were used for their ability to open tight junctions.5,6,84,85 Calu-3 cells were pre-exposed for 1 h to EGTA (20 mM)86 and CS (0.5
mg mL−1)87 and then treated with 16, 50, 100 nm SiO
2-FITC-NPs at 5 μg cm−2 for 24 h. NP translocation
significantly increased after EGTA and CS treatment (Fig. 9A and 9B). For both compounds, NP translocation was modulated in a size-dependent manner. 16 nm-SiO2-FITC-NP translocation was
enhanced by 48% and 45%, 50 nm SiO2-FITC-NPs NP translocation by 33% and 18%, 100 nm SiO2-FITC-NPs
NP translocation by 72% and 69% by EGTA and CS pre-exposure, respectively. NP translocation was more important for larger NPs. Altogether these results demonstrate that the translocation of SiO2-FITC-NPs
can occur by the paracellular route. A previous study provided evidence that NPs could pass through the cellular barrier. They demonstrate that TiO2-NPs could interact with the junctional VE-cadherin protein of
endothelial cells by physical interactions.88
Fig. 9 Modulation of NP translocation after treatment with EGTA or chitosan. Calu-3 cells were exposed to 16, 50, 100 nm
SiO2-FITC-NPs at 5 μg cm−2 for 24 h. Quantification of NP translocation after 1 h of pre-exposure to (A) EGTA at 20 mm
or (B) chitosan at 0.5 mg ml−1. Data were expressed as mean ± SEM, n = 3. *: different from NP treatment value without opening tight junctions (p < 0.05).
Interestingly NP translocation was more important in the presence of the Calu-3 monolayer compared to NP translocation across the TF in the absence of cells. These data confirm that SiO2-FITC-NP passage to
mechanism involved in the transcytosis is still an open and unsolved question and the role of the cytoskeleton has to be addressed as it has been shown that NPs can bind and disturb the microtubule cytoskeleton.95 We consider that the intracellular trafficking of internalized NPs is likely different
according to the NP type as we have seen for positive SiO2-FITC-NPs showing a similar amount of NP
internalized but with a less effective mechanism of translocation.
Conclusion
In conclusion our results have shown that NPs can translocate through the Calu-3 monolayer whatever their composition (SiO2 or TiO2), but this translocation is increased for the smallest and negatively charged
NPs. The translocation is not associated with an alteration of the integrity of the epithelial monolayer, suggesting a transcytosis of the internalized NP. By modifying the NP corona, the ability of NPs to cross the epithelial barrier differs depending on their intrinsic properties, making positively charged NPs more prone to translocate. NP translocation can be amplified by using agents known to open tight junctions and to allow paracellular passage. The translocation of NPs was also modulated when mimicking an inflammatory context, frequently found in the lungs, that alters the epithelial integrity and induces transient tight junction opening. These results held promise for supplying PBPK models with NP absorption data.
Methods
Nanoparticle synthesis
Size-controlled fluorescent silica nanoparticle (NP) production. SiO2-NPs of three size classes, 16, 50 and
100 nm were produced and covalently fluorescently labelled for this study by incorporation of fluorescein into the silica NP according to a procedure modified from van Blaaderen et al.89 These NPs were named
SiO2-FITC-NPs. For more details please refer to ESI (ESI Fig. S1A†).
Chemical surface modification of SiO2-FITC-NPs by EDPS. Surface modifications of SiO2-FITC-NPs were
carried out by adding in the medium an excess of 10 equivalents of
N-(trimethoxysilylpropyl)ethylenediamine (EDPS), sufficient to provide 2–3 monolayer coatings of the SiO2
-FITC-NPs. These NPs were named SiO2-FITC-NPs+. For more details please refer to ESI (ESI Fig. S1A†).
Production of TiO2-coated fluorescent silica nanoparticles. This TiO2 coating was performed according to
a modified procedure from Imhof used to coat a TiO2 layer on poly(styrene) nanospheres.90,91 These NPs
were named TiO2-coated SiO2-FITC-NPs. For more details please refer to ESI (ESI Fig. S1A†). Initial NP
suspensions were observed by TEM (Tecnai 12 microscope) at 80 kV with a CCD camera (SiS 1k × 1k Keen View), by drop deposing and drying on a TEM grid (ESI Fig. S1A†).
NP characterization
NP suspensions in DMEM/F-12 medium diluted at 5 μg cm−2 (10 μg mL−1) were characterized by DLS in
intensity and zeta potential measurements (Zetasizer, nano ZS, Malvern Instruments, USA). Additional NP characterization methods are described in ESI.†
Cell culture
Human epithelial cell lines. Human lung adenocarcinoma cells (Calu-3) were purchased from the American Type Culture Collection (ATCC, Sigma-Aldrich) and grown in DMEM/F12 (Dulbecco's modified Eagle's medium) culture medium with phenol red (Life Technologies, Saint Aubin, France), containing 1% GlutaMAX (Life Technologies) and 10% foetal calf serum (FCS, Life Technologies), 1% penicillin– streptomycin (PS, Life Technologies), and 0.5% amphotericin B (Life Technologies), subsequently referred
to as complete cell culture medium. All experiments were performed with these cells from passages 25 to 33. Cells were grown in T75-flasks (Costar, Corning, New York, USA) for cellular expansion and seeded at 500 000 cells cm−2 (ref. 28,30,35,92) onto 3 μm pore size polycarbonate Transwell Filters (TF, Costar) in
two compartment chambers (12 mm in diameter) for translocation experiments. 500 μL of complete culture medium were added in the apical chamber and 1500 μL in the basolateral chamber.
Calu-3 translocation Studies
Without modification of cellular environment. After 14 days of culture, TF-confluent Calu-3 cultures were rinsed with PBS to eliminate trace amounts of FCS. NP stock solutions were shortly vortexed before making final dilutions at 5 and 10 μg cm−2 (corresponding respectively to 10 μg mL−1 and 20 μg mL−1) in
cell culture medium without phenol red, GlutaMAX or FCS. Cells were apically treated with NPs for 4 or 24 h. After treatments, apical and basolateral media were removed and kept for fluorescence measurements, Transmission Electron Microscopy (TEM) or Enzyme-Linked ImmunoSorbent Assay (ELISA). Cells were rinsed two times with PBS and fixed for TEM and confocal microscopy observations. With alterations of cellular environment. Calu-3 cells were treated with NPs ± FCS (Life Technologies) or NPs ± DPL (Sigma Aldrich) respectively at 2% and 0.004% final in culture medium for 24 h. Pro-inflammatory context was induced by a 4 h exposure to 2 different pro-Pro-inflammatory mediators such as Tumor Necrosis Factor alpha (TNF-α, 1 ng mL−1 final in culture medium, R&D Systems, Abington, UK), or a
strong inducer of inflammation, the lipopolysaccharide (LPS, 25 ng mL−1 final in culture medium, Enzo, Life
Science, Villeurbanne, France). In some experiments the epithelial monolayer was altered by a 1 h pre-treatment with Ethylene Glycol Tetraacetic Acid (EGTA) at 20 mM, a Ca2+ chelator inducing tight junction
opening, or chitosan at 0.5 mg mL−1 known to open tight junctions. After all pre-treatments, mediators
were removed and cells were rinsed two times with PBS and then treated for 24 h by NPs. After NP treatments apical and basolateral media were removed, cells were rinsed two times with PBS and fixed for confocal microscopy experiments. To ascertain tight junction permeability the LY passage was measured, and cells were rinsed with PBS (Life Technologies, supplemented with Ca2+ and Mg2+) and
apically incubated for 1 h at 37 °C with 500 μL of LY (0.2 μg mL−1 final in PBS) before quantification of LY
in the apical and basal compartment by spectrophotometric analysis.30
Quantification of NP translocation. Serial dilutions of NPs were performed (in a concentration range from 0 to 10 μg cm−2) in culture media to establish a standard curve. After 24 h of treatment, 100 μL of each
apical and basolateral media as well as the serial NP dilutions were deposited inside a white 96-well plate with a clear bottom (Greiner, Courtaboeuf, France). FITC fluorescence (488 nm/521 nm) coupled to NPs was quantified using FluoStar Galaxy (BMG, Ortenberg, Germany). The fluorescence background value (medium without NPs) was subtracted from sample fluorescence. Fluorescence values were converted in final NP concentrations in each compartment by using a standard curve, and then in percentage of the initial NP concentration. For the “filter” and “cells/filter” compartments, values were determined by subtraction of the apical and basolateral media from the initial NP concentration applied.
Immunolabelling and confocal microscopy observations
After NP treatment cells were fixed using 4% paraformaldehyde in PBS (Santa-Cruz, Heidelberg, Germany) over 20 min at RT, then incubated with NH4Cl (50 mM, Sigma-Aldrich) for 10 min and permeabilized in
0.05% Tween 20 (Sigma-Aldrich) in PBS for 5 min. Fixed cells were incubated overnight at 4 °C with human microtubule-associated protein 1A/1B-light chain 3 (LC3-II) polyclonal primary antibody (Abcam, Paris, France) diluted to 1 : 200 produced in rabbit; human Claudin-4 (CLD-4) polyclonal primary antibodies (Santa Cruz Biotechnology, Heidelberg, Germany) diluted to 1 : 100 produced in goat; human MUC5AC monoclonal primary antibodies (Life Technologies) diluted to 1 : 100 produced in mouse or with human ZO-1 polyclonal primary antibody (Sigma Aldrich) diluted to 1 : 500 produced in rabbit. This incubation was followed by incubation with secondary antibodies stained with Alexa 488 or 568 fluorochrome diluted
to 1 : 500 (Life Technologies) for 2 h at RT. For actin filaments staining, fixed cells were incubated for 40 min with rhodamine–phalloidin (final concentration at 0.9 nM in PBS, Life Technologies). Cell nuclei were stained for 2 min with DAPI (4′,6-diamidino-2-phenylindole dihydrochloride, final concentration at 0.25 μg mL−1 in PBS, Life Technologies). Cells were examined under a Zeiss LSM710 confocal microscope using
an objective 63× with a 1.5 zoom after mounting in polyvinyl alcohol mounting medium with DABCO (Sigma-Aldrich). Considering optical laws the theoretical resolution was calculated and instrument settings adapted to obtain the best possible resolution in our images. Image treatment and co-localisation study were done with Image J software (Image J 1.42 NIH, USA) by the addition of LOCI and Jacol plugins respectively. Imaris software (Imaris 7.6, Bitplane, Zurich, Switzerland) was used for the three-dimensional (3D) visualisation. Z-stack merges were obtained with the merging of 5 to 10 z-stacks with a stack-spread of 0.45 μm.
Transmission electron microscopy
Calu-3 cell preparation. Cells were fixed using 1.6% (v/v) glutaraldehyde and 1% (v/v) tannic acid in phosphate buffer 0.1 M, pH 7.4 for 1 h and post-fixed using 1% (v/v) osmium tetroxide for 60 min. The membranes were then stripped from the insert, dehydrated in ascending series of ethanol dilutions and impregnated in ascending dilutions of resin in ethanol, left in pure resin overnight (Epon, Inland Europe), embedded and polymerized at 60 °C for 48 h. Ultra-thin sections (70 nm) performed on ultramicrotome (RMC, PowerTome PC) were collected on Butvar-coated single-slot copper grids, and stained with 2% (v/v) uranyl acetate for 30 min and with lead citrate for 2 min. For characterization of the basal medium, solution at 40 μg mL−1 was deposited on a carbon coated grid previously submitted to a glow discharge
(Elmo, Cordouan Technologies). Grids were examined by TEM (CM120, FEI) and the images were acquired using a digital 2k × 2k Gatan camera.
X-Ray analysis. With a view to checking the size and chemical nature of NP, to assess the effectiveness of translocation and the NP agglomeration, several observations and chemical analyses were performed with a Transmission Electron Microscope (TEM, JEOL JEM 1400 ST) fitted with an Energy Dispersive X-Ray Spectrometer (EDS, Oxford Inca Energy TEM 350-EDS 7215) and with a digital camera (Gatan Erlangshen ES 500W-782). Observations were performed at a magnification between ×15 000 and ×80 000 at 120 kV, and X-ray data were analyzed with INCA software.
Statistical analysis
Every experiment was repeated at least twice with triplicates for each condition. Data are represented as means ± SEM and are analyzed with SigmaStat commercially available software (Version 3.0, Systat software Inc., San Jose, California, USA) using analysis of variance (one-way ANOVA) followed by Dunnett's test for multiple comparisons with p < 0.05 (two tailed) considered as significant.
Conflict of interest:
The authors declare no competing financial interest.Author contribution:
IG contributed to the study design, did the experimental work, analyzed data and wrote the manuscript. GN prepared Calu-3 cells for TEM experiments and acquired TEM pictures. VC helped in the co-localization study and did 3D reconstructions of confocal microscopic images. SM performed the synthesis of the different batches of NPs. KB and LM performed X-ray analysis of NP suspensions. SB and OL critically reviewed the manuscript and gave intellectual input. ABS contributed to the study design, analyzed data, coordinated the work and wrote the manuscript. All the authors have read and approved the final manuscript.Funding sources:
This study was funded by the French Agency for Food, Environmental and Occupational Health & Safety (ANSES), TiSiTrans project (no. PNR-EST-2010/2/79) and by INERIS in the context of thepost-Grenelle program, Nanotrans project (no. EST-2010/2/079). The Ph.D. of Isabelle George was funded by the Région Ile-de-France and the DIM SEnT. Flow Cytometry facility was financially supported by the Ligue contre le Cancer.
Acknowledgements:
This study was funded by the French Agency for Food, Environmental and Occupational Health & Safety (ANSES), TiSiTrans project (no. PNR-EST-2010/2/79) and by INERIS in the context of the post-Grenelle program, Nanotrans project (no. EST-2010/2/079). The Ph.D. of I. George was funded by the Région Ile-de-France and the DIM SEnT. We acknowledge X. Baudin from the confocal microscopy platform, J. Lo, and R. Leborgne from the transmission electron microscopy platform and N. Boggetto from the flow cytometry platform (financially supported by the Ligue contre le Cancer) for their invaluable assistance, and the ImagoSeine BioImaging Core Facility, Institute Jacques Monod, Paris, France. The authors wish to thank S. Vranic for her expert advice.Notes and references
1. R. J. Aitken, M. Q. Chaudhry, A. B. Boxall and M. Hull, Manufacture and use of nanomaterials: current status in the UK and global trends, Occup. Med., 2006, 56, 300–306.
2. G. Oberdörster, E. Oberdörster and J. Oberdörster, Nanotoxicology: an emerging discipline evolving from studies of ultrafine particles, Environ. Health Perspect., 2005, 113, 823–839.
3. M. Geiser and W. G. Kreyling, Deposition and biokinetics of inhaled nanoparticles, Part. Fibre Toxicol., 2010, 7, 2.
4. E. Steed, M. S. Balda and K. Matter, Dynamics and functions of tight junctions, Trends Cell Biol., 2010, 20, 142–149.
5. P. D. Ward, T. K. Tippin and D. R. Thakker, Enhancing paracellular permeability by modulating epithelial tight junctions, Pharm. Sci. Technol. Today, 2000, 3, 346–358.
6. R. Rosenthal, M. S. Heydt, M. Amasheh, C. Stein, M. Fromm and S. Amasheh, Analysis of absorption enhancers in epithelial cell models, Ann. N. Y. Acad. Sci., 2012, 1258, 86–92.
7. X. He, H. Zhang, Y. Ma, W. Bai, Z. Zhang, K. Lu, Y. Ding, Y. Zhao and Z. Chai, Lung deposition and extrapulmonary translocation of nano-ceria after intratracheal instillation, Nanotechnology, 2010, 21, 285103.
8. C. Lasagna-Reeves, D. Gonzalez-Romero, M. A. Barria, I. Olmedo, A. Clos, V. M. Sadagopa Ramanujam, A. Urayama, L. Vergara, M. J. Kogan and C. Soto, Bioaccumulation and toxicity of gold nanoparticles after repeated administration in mice, Biochem. Biophys. Res. Commun., 2010, 393, 649–655.
9. W. H. De Jong, W. I. Hagens, P. Krystek, M. C. Burger, A. J. Sips and R. E. Geertsma, Particle
size-dependent organ distribution of gold nanoparticles after intravenous administration, Biomaterials, 2008, 29, 1912–1919.
10. C. Schleh, U. Holzwarth, S. Hirn, A. Wenk, F. Simonelli, M. Schäffler, W. Möller, N. Gibson and W. G. Kreyling, Biodistribution of Inhaled Gold Nanoparticles in Mice and the Influence of Surfactant Protein D, J. Aerosol Med. Pulm. Drug Deliv., 2012, 26(1), 24–30.
11. W. G. Kreyling, M. Semmler, F. Erbe, P. Mayer, S. Takenaka, H. Schulz, G. Oberdörster and A. Ziesenis, Translocation of ultrafine insoluble iridium particles from lung epithelium to extrapulmonary organs is size dependent but very low, J. Toxicol. Environ. Health, Part A, 2002, 65, 1513–1530.
12. H. S. Choi, Y. Ashitate, J. H. Lee, S. H. Kim, A. Matsui, N. Insin, M. G. Bawendi, M. Semmler-Behnke, J. V. Frangioni and A. Tsuda, Rapid translocation of nanoparticles from the lung airspaces to the body, Nat. Biotechnol., 2010, 28, 1300–1303.
13. M. Semmler-Behnke, S. Takenaka, S. Fertsch, A. Wenk, J. Seitz, P. Mayer, G. Oberdörster and W. G. Kreyling, Efficient elimination of inhaled nanoparticles from the alveolar region: evidence for interstitial
uptake and subsequent reentrainment onto airways epithelium, Environ. Health Perspect., 2007, 115, 728–733.
14. S. Vranic, N. Boggetto, V. Contremoulins, S. Mornet, N. Reinhardt, F. Marano, A. Baeza-Squiban and S. Boland, Deciphering the mechanisms of cellular uptake of engineered nanoparticles by accurate evaluation of internalization using imaging flow cytometry, Part. Fibre Toxicol., 2013, 10, 2.
15. J. Dausend, A. Musyanovych, M. Dass, P. Walther, H. Schrezenmeier, K. Landfester and V. Mailänder, Uptake mechanism of oppositely charged fluorescent nanoparticles in HeLa cells, Macromol. Biosci., 2008, 8, 1135–1143.
16. T. Xia, M. Kovochich, M. Liong, J. I. Zink and A. E. Nel, Cationic polystyrene nanosphere toxicity depends on cell-specific endocytic and mitochondrial injury pathways, ACS Nano, 2008, 2, 85–96.
17. L. Migliore and F. Coppedè, Environmental-induced oxidative stress in neurodegenerative disorders and aging, Mutat. Res., 2009, 674, 73–84.
18. Y. Xiao, S. P. Forry, X. Gao, R. D. Holbrook, W. G. Telford and A. Tona, Dynamics and mechanisms of quantum dot nanoparticle cellular uptake, J. Nanobiotechnol., 2010, 8, 13.
19. W. Jiang, B. Y. Kim, J. T. Rutka and W. C. Chan, Nanoparticle-mediated cellular response is size-dependent, Nat. Nanotechnol., 2008, 3, 145–150.
20. O. Harush-Frenkel, N. Debotton, S. Benita and Y. Altschuler, Targeting of nanoparticles to the clathrin-mediated endocytic pathway, Biochem. Biophys. Res. Commun., 2007, 353, 26–32.
21. A. Lesniak, F. Fenaroli, M. P. Monopoli, C. Åberg, K. A. Dawson and A. Salvati, Effects of the presence or absence of a protein corona on silica nanoparticle uptake and impact on cells, ACS Nano, 2012, 6, 5845– 5857.
22. S. R. Saptarshi, A. Duschl and A. L. Lopata, Interaction of nanoparticles with proteins: relation to bio-reactivity of the nanoparticle, J. Nanobiotechnol., 2013, 11, 26.
23. E. Casals and V. F. Puntes, Inorganic nanoparticle biomolecular corona: formation, evolution and biological impact, Nanomedicine, 2012, 7, 1917–1930.
24. M. Kendall, P. Ding, R. M. Mackay, R. Deb, Z. McKenzie, K. Kendall, J. Madsen and H. Clark, Surfactant protein D (SP-D) alters cellular uptake of particles and nanoparticles, Nanotoxicology, 2013, 7, 963–973. 25. B. Rothen-Rutishauser, C. Mühlfeld, F. Blank, C. Musso and P. Gehr, Translocation of particles and
inflammatory responses after exposure to fine particles and nanoparticles in an epithelial airway model, Part. Fibre Toxicol., 2007, 4, 9.
26. N. R. Yacobi, N. Malmstadt, F. Fazlollahi, L. DeMaio, R. Marchelletta, S. F. Hamm-Alvarez, Z. Borok, K. J. Kim and E. D. Crandall, Mechanisms of alveolar epithelial translocation of a defined population of nanoparticles, Am. J. Respir. Cell Mol. Biol., 2010, 42, 604–614.
27. J. Geys, L. Coenegrachts, J. Vercammen, Y. Engelborghs, A. Nemmar, B. Nemery and P. H. Hoet, In vitro study of the pulmonary translocation of nanoparticles: a preliminary study, Toxicol. Lett., 2006, 160, 218– 226.
28. I. George, S. Vranic, S. Boland and A. Baeza-Squiban, Translocation of SiO2-NPs across in vitro human
bronchial epithelial monolayer. IOP Publishing: 2013; Vol. Journal of Physics: Conference Series 429 (2013) 012022.
29. J. M. Cohen, R. Derk, L. Wang, J. Godleski, L. Kobzik, J. Brain and P. Demokritou, Tracking translocation of industrially relevant engineered nanomaterials (ENMs) across alveolar epithelial monolayers in vitro, Nanotoxicology, 2014, 8(S1), 216–225.
30. I. George, S. Vranic, S. Boland, A. Courtois and A. Baeza-Squiban, Development of an in vitro model of human bronchial epithelial barrier to study nanoparticle translocation, Toxicol. In Vitro, 2014, 29, 51–58. 31. B. He, P. Lin, Z. Jia, W. Du, W. Qu, L. Yuan, W. Dai, H. Zhang, X. Wang, J. Wang, X. Zhang and Q. Zhang, The
transport mechanisms of polymer nanoparticles in Caco-2 epithelial cells, Biomaterials, 2013, 34, 6082– 6098.
32. C. I. Grainger, L. L. Greenwell, D. J. Lockley, G. P. Martin and B. Forbes, Culture of Calu-3 cells at the air interface provides a representative model of the airway epithelial barrier, Pharm. Res., 2006, 23, 1482– 1490.
33. I. Forbes, Human airway epithelial cell lines for in vitro drug transport and metabolism studies, Pharm. Sci. Technol. Today, 2000, 3, 18–27.
34. Y. Zhu, A. Chidekel and T. H. Shaffer, Cultured human airway epithelial cells (calu-3): a model of human respiratory function, structure, and inflammatory responses, Crit. Care Res. Pract., 2010, 2010.
35. B. I. Florea, M. L. Cassara, H. E. Junginger and G. Borchard, Drug transport and metabolism characteristics of the human airway epithelial cell line Calu-3, J. Controlled Release, 2003, 87, 131–138.
36. J. Geys, B. Nemery and P. H. Hoet, Optimisation of culture conditions to develop an in vitro pulmonary permeability model, Toxicol. In Vitro, 2007, 21, 1215–1219.
37. M. Madlova, S. A. Jones, I. Zwerschke, Y. Ma, R. C. Hider and B. Forbes, Poly(vinyl alcohol) nanoparticle stability in biological media and uptake in respiratory epithelial cell layers in vitro, Eur. J. Pharm. Biopharm., 2009, 72, 437–443.
38. I. H. Heijink, S. M. Brandenburg, J. A. Noordhoek, D. S. Postma, D. J. Slebos and A. J. van Oosterhout, Characterisation of cell adhesion in airway epithelial cell types using electric cell-substrate impedance sensing, Eur. Respir. J., 2010, 35, 894–903.
39. M. van Schilfgaarde, L. van Alphen, P. Eijk, V. Everts and J. Dankert, Paracytosis of Haemophilus influenzae through cell layers of NCI-H292 lung epithelial cells, Infect. Immun., 1995, 63, 4729–4737.
40. B. Forbes and C. Ehrhardt, Human respiratory epithelial cell culture for drug delivery applications, Eur. J. Pharm. Biopharm., 2005, 60, 193–205.
41. S. K. Sohaebuddin, P. T. Thevenot, D. Baker, J. W. Eaton and L. Tang, Nanomaterial cytotoxicity is composition, size, and cell type dependent, Part. Fibre Toxicol., 2010, 7, 22.
42. F. Schrurs and D. Lison, Focusing the research efforts, Nat. Nanotechnol., 2012, 7, 546–548.
43. S. Li, S. Yang, G. Chen, X. Li, J. Chen and Y. Ma, Mechanism of cellular uptake, localization and cytotoxicity of organic nanoparticles, J. Nanosci. Nanotechnol., 2014, 14, 3292–3298.
44. C. Y. Dombu, M. Kroubi, R. Zibouche, R. Matran and D. Betbeder, Characterization of endocytosis and exocytosis of cationic nanoparticles in airway epithelium cells, Nanotechnology, 2010, 21, 355102. 45. C. Zheng, Q. Guo, Z. Wu, L. Sun, Z. Zhang, C. Li and X. Zhang, Amphiphilic glycopolymer nanoparticles as
vehicles for nasal delivery of peptides and proteins, Eur. J. Pharm. Sci., 2013, 49, 474–482.
46. S. Mura, H. Hillaireau, J. Nicolas, S. Kerdine-Römer, B. Le Droumaguet, C. Deloménie, V. Nicolas, M. Pallardy, N. Tsapis and E. Fattal, Biodegradable nanoparticles meet the bronchial airway barrier: how surface properties affect their interaction with mucus and epithelial cells, Biomacromolecules, 2011, 12, 4136–4143.
47. S. Mura, H. Hillaireau, J. Nicolas, B. Le Droumaguet, C. Gueutin, S. Zanna, N. Tsapis and E. Fattal, Influence of surface charge on the potential toxicity of PLGA nanoparticles towards Calu-3 cells, Int. J. Nanomed., 2011, 6, 2591–2605.
48. K. Ma, H. Sai and U. Wiesner, Ultrasmall sub-10 nm near-infrared fluorescent mesoporous silica nanoparticles, J. Am. Chem. Soc., 2012, 134, 13180–13183.
49. J. J. Li, D. Hartono, C. N. Ong, B. H. Bay and L. Y. Yung, Autophagy and oxidative stress associated with gold nanoparticles, Biomaterials, 2010, 31, 5996–6003.
50. X. Ma, Y. Wu, S. Jin, Y. Tian, X. Zhang, Y. Zhao, L. Yu and X. J. Liang, Gold nanoparticles induce
autophagosome accumulation through size-dependent nanoparticle uptake and lysosome impairment, ACS Nano, 2011, 5, 8629–8639.
51. Q. Zhang, W. Yang, N. Man, F. Zheng, Y. Shen, K. Sun, Y. Li and L. P. Wen, Autophagy-mediated chemosensitization in cancer cells by fullerene C60 nanocrystal, Autophagy, 2009, 5, 1107–1117.
52. P. Wei, L. Zhang, Y. Lu, N. Man and L. Wen, C60(Nd) nanoparticles enhance chemotherapeutic susceptibility of cancer cells by modulation of autophagy, Nanotechnology, 2010, 21, 49510.
53. S. T. Stern, B. S. Zolnik, C. B. McLeland, J. Clogston, J. Zheng and S. E. McNeil, Induction of autophagy in porcine kidney cells by quantum dots: a common cellular response to nanomaterials?, Toxicol. Sci., 2008, 106, 140–152.
54. O. Seleverstov, O. Zabirnyk, M. Zscharnack, L. Bulavina, M. Nowicki, J. M. Heinrich, M. Yezhelyev, F. Emmrich, R. O'Regan and A. Bader, Quantum dots for human mesenchymal stem cells labeling. A size-dependent autophagy activation, Nano Lett., 2006, 6, 2826–2832.
55. O. Zabirnyk, M. Yezhelyev and O. Seleverstov, Nanoparticles as a novel class of autophagy activators, Autophagy, 2007, 3, 278–281.
56. T. Tenuta, M. P. Monopoli, J. Kim, A. Salvati, K. A. Dawson, P. Sandin and I. Lynch, Elution of labile fluorescent dye from nanoparticles during biological use, PLoS One, 2011, 6, e25556.
57. A. Salvati, C. Aberg, T. dos Santos, J. Varela, P. Pinto, I. Lynch and K. A. Dawson, Experimental and theoretical comparison of intracellular import of polymeric nanoparticles and small molecules: toward models of uptake kinetics, Nanomedicine, 2011, 7, 818–826.
58. A. T. Florence, Nanoparticles uptake by the oral route: Fulfilling its potential?, Drug Discovery Today: Technol., 2005, 2, 75–81.
59. R. Landsiedel, E. Fabian, L. Ma-Hock, B. van Ravenzwaay, W. Wohlleben, K. Wiench and F. Oesch, Toxico-/biokinetics of nanomaterials, Arch. Toxicol., 2012, 86, 1021–1060.
60. J. S. Zhang, F. Liu and L. Huang, Implications of pharmacokinetic behavior of lipoplex for its inflammatory toxicity, Adv. Drug Delivery Rev., 2005, 57, 689–698.
61. B. Yu, Y. Zhang, W. Zheng, C. Fan and T. Chen, Positive surface charge enhances selective cellular uptake and anticancer efficacy of selenium nanoparticles, Inorg. Chem., 2012, 51, 8956–8963.
62. C. Brandenberger, B. Rothen-Rutishauser, C. Mühlfeld, O. Schmid, G. A. Ferron, K. L. Maier, P. Gehr and A. G. Lenz, Effects and uptake of gold nanoparticles deposited at the air-liquid interface of a human
epithelial airway model, Toxicol. Appl. Pharmacol., 2010, 242, 56–65.
63. Y. Ge, Y. Zhang, J. Xia, M. Ma, S. He, F. Nie and N. Gu, Effect of surface charge and agglomerate degree of magnetic iron oxide nanoparticles on KB cellular uptake in vitro, Colloids Surf., B, 2009, 73, 294–301. 64. S. S. Yu, C. M. Lau, S. N. Thomas, W. G. Jerome, D. J. Maron, J. H. Dickerson, J. A. Hubbell and T. D. Giorgio,
Size- and charge-dependent non-specific uptake of PEGylated nanoparticles by macrophages, Int. J. Nanomed., 2012, 7, 799–813.
65. E. Fröhlich, The role of surface charge in cellular uptake and cytotoxicity of medical nanoparticles, Int. J. Nanomed., 2012, 7, 5577–5591.
66. H. M. Braakhuis, M. V. Park, I. Gosens, W. H. De Jong and F. R. Cassee, Physicochemical characteristics of nanomaterials that affect pulmonary inflammation, Part. Fibre Toxicol., 2014, 11, 18.
67. I. C. Lin, M. Liang, T. Y. Liu, Z. M. Ziora, M. J. Monteiro and I. Toth, Interaction of densely polymer-coated gold nanoparticles with epithelial Caco-2 monolayers, Biomacromolecules, 2011, 12, 1339–1348.
68. E. Brun, F. Barreau, G. Veronesi, B. Fayard, S. Sorieul, C. Chanéac, C. Carapito, T. Rabilloud, A. Mabondzo, N. Herlin-Boime and M. Carrière, Titanium dioxide nanoparticle impact and translocation through ex vivo, in vivo and in vitro gut epithelia, Part. Fibre Toxicol., 2014, 11, 13.
69. D. Dutta, S. K. Sundaram, J. G. Teeguarden, B. J. Riley, L. S. Fifield, J. M. Jacobs, S. R. Addleman, G. A. Kaysen, B. M. Moudgil and T. J. Weber, Adsorbed proteins influence the biological activity and molecular targeting of nanomaterials, Toxicol. Sci., 2007, 100, 303–315.
70. M. Lundqvist, J. Stigler, G. Elia, I. Lynch, T. Cedervall and K. A. Dawson, Nanoparticle size and surface properties determine the protein corona with possible implications for biological impacts, Proc. Natl. Acad. Sci. U. S. A., 2008, 105, 14265–14270.