1
Characterizing the Materials Footprint of a University Campus:
Data, Methods, Recommendations
by
Rachel Martha Katims Perlman
S.M. Technology and Policy, MIT (2015)
B.S. Science of Natural and Environmental Systems, Cornell University (2012) Submitted to the Institute for Data, Systems and Society
in Partial Fulfillment of the Requirements for the Degree of Doctor of Philosophy in Engineering Systems
at the
MASSACHUSETTS INSTITUTE OF TECHNOLOGY June, 2020
© 2020 Massachusetts Institute of Technology. All rights reserved.
Signature of Author……….. Rachel Martha Katims Perlman Institute for Data, Systems, and Society March 18, 2020 Certified by ………
John E. Fernández Professor and Director, MIT Environmental Solutions Initiative Thesis Supervisor and Chair Certified by ………
Timothy G. Gutowski Professor of Mechanical Engineering Doctoral Committee Member Certified by ………
Julie Newman Director, MIT’s Office of Sustainability Doctoral Committee Member Accepted by ……… Stephen Graves Abraham J. Siegel Professor of Management Graduate Officer, Institute for Data, Systems, and Society
2 This page intentionally left blank.
3
Characterizing the Materials Footprint of a University Campus:
Data, Methods, and Recommendations
byRachel M.K. Perlman
Submitted to the Institute for Data, Systems, and Society On March 18, 2019 in partial fulfillment of the
Requirements for the Degree of Doctor of Philosophy in Engineering Systems
Abstract
Universities are major consumers and disposers of many materials, but their specific flows are not well characterized. Both energy and material consumption drive a university’s
environmental impact. Many universities collect data about their energy consumption (from fuel usage or utility bills) and assess some resulting environmental impacts. However, very little effort has been focused on understanding purchasing, materials handling, and the resulting environmental impacts. To date, there have been few material flow analyses of universities; most analyses concern cities or countries. This paper describes a method for conducting a material flow analysis (MFA) of a university, and it offers the strategies used to obtain first-order characterization and quantification of the flows of the Massachusetts Institute of Technology (MIT).
This case study demonstrates that an MFA of a university requires the use of a portfolio of diverse methods that deliver different outcomes, which then must be pieced together. Inflows and stocks are characterized using financial data, and waste flows are quantified by mass data. Flows are characterized using a combination of product/commodity descriptors and materials. Material purchases are characterized by product category, temporal variation, purchasing unit/entity, and level of decentralization. The top five purchase categories (by spend) in descending order are: (1) laboratory supplies; (2) hardware purchases/maintenance; (3) laboratory equipment; (4) chemicals, reagents & gases; (5) office furniture. The study also reports the largest stocks of durable goods by quantity and dollar value, as well as the average residence time, or lifetime, of different products. The results also catalogue the quantity and disposal/recycling destinations of different waste streams, including municipal solid waste, single-stream recycling, hazardous waste, medical waste, and radioactive waste.
To estimate the embodied GHG emissions from purchases, spend data was used with an economic input-output life cycle assessment (EIO-LCA). The product categories with the largest embodied emissions were found to be laboratory supplies, chemicals/gases, office furniture, and electronics. The total embodied greenhouse gas emissions of material goods purchased in FY2016 was found to be roughly 78,800 metric tons of CO2-eq. This is significant compared to Scope 1 and 2 emissions. Emissions from waste management were estimated using waste
4 generation figures and EPA’s WARM model; the results indicate that the greenhouse gas impact from waste is much smaller than that from procurement.
This study also reports the findings from sixteen in-person interviews conducted with MIT community members that make purchases. Among other findings, the interviews revealed that purchasers currently have a high level of individual agency and freedom. Purchasers also reported that they would like easily accessible information and guidelines for how to purchase sustainably, as well as formalized incentives for buying more sustainably and conserving materials.
Currently, the purchasing process is carried out independently of any consideration of the materials’ end of life (a linear system, rather than having circularity for sustainability). University entities are autonomous in their purchasing, with some using different systems, which makes complicates the tracking material consumption. This work provides several recommendations for making MFAs easier to perform at the university-level and for reducing the materials and carbon footprint of a research universities. Some key recommendations include: centralizing data collection and storage on procurement and waste; requiring more detailed product-level data from vendors; and creating web-based interdepartmental sharing programs for material goods.
5
Acknowledgements
Foremost, I would like to thank my doctoral committee. I am grateful to my thesis supervisor,
John Fernández, for providing guidance throughout the PhD process, sharing his expertise, and
emphasizing his confidence in my abilities. I am thankful to Julie Newman, who served as both a committee member, as well as my supervisor while I worked at MIT’s Office of Sustainability (MITOS) – Julie is a great desk neighbor and mentor. I am also grateful to Timothy Gutowski, my third committee member. Tim is an excellent teacher, asks important questions, and made sure I focused on the big picture. A chance meeting with Tim at a conference in 2012 is actually what inspired me to apply to MIT.
This project would not have been possible without the study participants, who volunteered to participate in interviews about purchasing; thank you for your time and insight. I would also like to thank the dozens of MIT community members that volunteered in the waste audits I
organized – thanks for being willing to dig through trash for the sake of science.
My research has been made possible by funding from the National Science Foundation (Graduate Research Fellowship), MIT’s Environmental Solutions Initiative, and MIT’s Office of Sustainability, among other sources.
I am extremely grateful to the individuals that have served as co-researchers, contributors and/or subject matter experts along the way. Thank you to Ricardo Lopez, who worked with me as an undergraduate research assistant through MIT’s UROP program. Ricardo used his computer science expertise to enhance this project’s data analysis. I am also thankful to all of the MITOS staff that served as colleagues, friends, and lunch buddies. Thank you Brian
Goldberg, Susy Jones, Rebecca Fowler, Derek Wietsma, and Steve Lanou. Also, thank you to Cristina Logg, with whom I worked closely as a MITOS Fellow.
I am appreciative of the input and data provided by MIT staff from a variety of departments on campus. Thank you to Ruth Davis and Jarrod Jones (Facilities), Erin George and Michael
McCarthy (VPF Property Office), Cecilia Talamantes and Gilles Simler (VPF Office of
Procurement), Naihm Kelly and Pam Greenley (formerly EHS).
I am thankful to have had additional support from other MIT community members including:
Blanche Staton, Thalia Rubio, Xiaolu Hsi, Barbara DeLabarre, Beth Milnes, and members of MIT’s Student Art Association/ Ceramic Studio.
Additionally, I am grateful to my MIT ESD/IDSS peers that provided support, advice, and comic relief – thank you to Henry, Maia, Marco, Magdalena, and Florian.
Of course, I thank my family, friends, and boyfriend for loving and supporting me throughout the entire process! Thank you to Mom, Dad, Ben, Josh, Zach, Emily, Angela, Emma, and José,
to name a few. I wouldn’t have been able to persevere through this long process without you
6
Table of Contents
Abstract ... 3 Acknowledgements ... 5 Table of Contents ... 6 Summary of Tables ... 10 Summary of Figures ... 12 Chapter 1: Introduction ... 14 Chapter 1 Abstract ... 14Topic and Context ... 14
Literature Review ... 16
Material and Product Types ... 16
MFA at the National Level ... 18
MFA at the City and Sub-city Level ... 18
University-Level MFA ... 18
Previous Research on MIT ... 23
Research Questions and Objectives: ... 24
Overview of the Structure ... 25
Chapter 2: Methods for conducting an MFA at a technical university ... 26
Chapter 2 Abstract ... 26
Introduction to Methods ... 26
Boundary and Scope ... 26
Defining Inflows, Stocks, and Outflows ... 28
The General Approach ... 29
Gathered Data Sources ... 32
Qualitative Data Collection: Interviews ... 33
Inflows ... 34
Centralized vs. Decentralized Sources of Purchase Records ... 34
Overview of Procurement Data ... 35
About the Full FY2016 spend records from Procurement ... 37
Stocks ... 41
Outflows ... 43
7
Waste Audit Results ... 50
Incorporation of Waste Audit Data into the MFA ... 52
Creation of a Material Taxonomy ... 52
Chapter 3: Methods for Processing Electronic Catalog (ECAT) Purchase Record Data for use in the MFA ... 56
Chapter 3 Abstract ... 56
Description of the Electronic Catalog Purchase Record Data ... 56
Overview of Processing Methods ... 58
Distinguishing Products from Services ... 58
Improving the Specificity of Product Categorization ... 60
ECAT’s Product Categorization Prior to Processing ... 60
Method for Classifying Unspecified Purchases ... 64
Attempt to Assign ECAT Records Material Categories and Product Weights ... 67
Assigning Material Categories ... 67
Assigning Weights/Masses ... 67
Learnings from Data Processing ... 68
Chapter 4: MIT Material Flow Results ... 69
Chapter 4 Abstract ... 69
Inflows ... 69
Overview of Inflows ... 69
Mass Estimates for a Selection of Purchased Commodities ... 69
Analysis by Product Category ... 72
Temporal Variation of Purchasing ... 78
Purchases by University Organizational Unit ... 80
Level of (De)Centralization ... 83
Expenditure per Capita and by School ... 85
Stocks ... 87
Characteristics and Quantities of Stocked Products ... 87
Analysis of the Campus Lifetime of Stocks ... 89
Outflows ... 93
Quantity of Waste Generated by Category ... 94
Processing Methods/Destinations of Waste ... 95
8
Temporal Variation of Municipal Solid Waste Generation ... 97
Composition of Trash and Recycling (based on Waste audits) ... 100
Revised Waste Quantities (based on Waste Audits) ... 101
Chapter 5: Estimating Greenhouse Gas Emissions from Inflows and Outflows ... 104
Chapter 5 Abstract ... 104
Introduction ... 104
Estimating the Embodied Greenhouse Gas Emissions from Purchases ... 105
Method for estimating embodied greenhouse gas emissions from purchased material goods ... 105
Results ... 109
Problems/Limitations ... 110
Estimating the Greenhouse Gas Emissions from Waste Flows ... 111
Method for Estimating Greenhouse Gas Emissions from Waste Flows ... 111
Results ... 112
Discussion about Global Warming Impacts ... 114
Chapter 6: Organizational and Behavioral Factors Impacting Purchasing ... 115
Chapter 6 Abstract ... 115 Interview Methods ... 115 Interview Findings ... 116 Logistics of purchasing ... 116 Major Considerations ... 117 Freedom ... 118
Personal vs. University Purchases ... 118
Relating Purchasing to Disposal ... 118
Importance of Sustainability ... 120
Potential for Reduction in Purchasing ... 120
Opinions on Sustainable Materials Management Initiatives ... 121
Conclusions from the Interviews ... 124
Chapter 7: Discussion and Conclusions ... 126
Chapter 7 Abstract ... 126
Revisiting the Research Objectives ... 126
Methodological Learnings and Contributions ... 127
9
Recommendations and Opportunities for Improvement ... 130
Recommendations for Data Collection and Management ... 130
Recommendations for Organizational Policies and Materials Management Strategies .... 131
Future Research ... 132
Conclusions ... 133
Measuring Impact ... 133
Perspective of the Researcher ... 134
The Way Forward ... 135
References ... 137
Appendices ... 138
1. Material Taxonomy ... 139
2. Purchase Records ... 152
3. Property Data – Stock Analysis ... 155
4. Waste Audits ... 158
5. Greenhouse Gas Estimates from Purchased Goods ... 167
10
Summary of Tables
Table 1: Summary of reviewed literature addressing material flow analysis and/or Scope 3
analysis of university campuses. ... 21
Table 2: Summary of the data sets collected for the development of a materials flow analysis for the university. ... 33
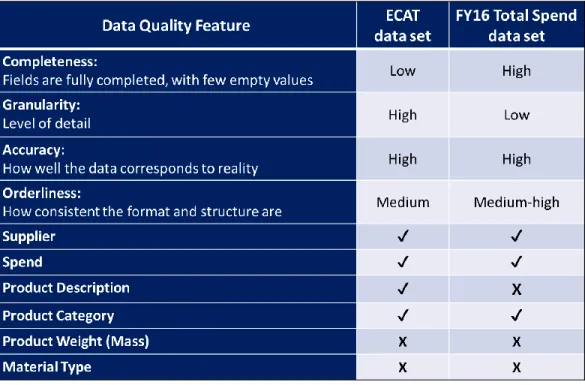
Table 3: Qualitative differences between the two primary data sets used to analyze material inflows: ECAT and FY16 Total Spend. ... 37
Table 4: Estimated spend (in dollars) by MIT on material goods and services in Fiscal Year 2016. ... 37
Table 5: All FY16 purchased material goods listed by purchase channel. ... 38
Table 6: Description of the main purchasing channels used to buy material goods for MIT. ... 39
Table 7: List of material categories used in the waste audits of this study, as well as the corresponding appropriate destination for such material on this particular university's campus. ... 46
Table 8: Sorting rules used to segregate materials into waste audit categories. ... 47
Table 9: Description of the five waste audits conducted at MIT. ... 49
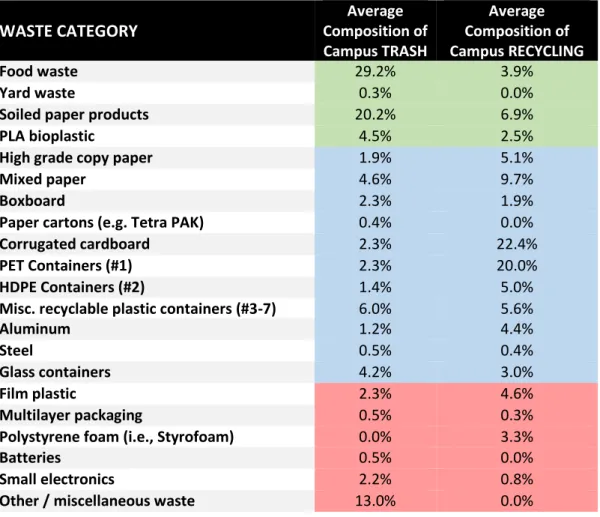
Table 10: Average composition (by weight) of the waste in MIT’s single stream recycling bins, based on the campus waste audits. Green = compostable, blue = recyclable in single stream recycling, and red = disposable or recyclable using specialty recycling services. ... 50
Table 11: A summary of the data fields and contents of the ECAT data set. ... 57
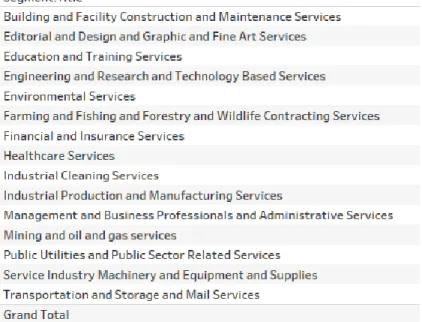
Table 12: Instances of ECAT Segment categories containing the word “service.” ... 59
Table 13: The hierarchal structure of the UNSPSC system. ... 60
Table 14: A sampling of pairings of Product Descriptions with UNSPSC Commodities that served as the basis for hard-coded classification rules. ... 66
Table 15: Mass flow estimates for a sampling of commodities purchased by the university. .... 71
Table 16: A list of the commodities with the highest total spend in ECAT in FY16. ... 73
Table 17: Per-capita expenditure on material goods for the MIT population. ... 85
Table 18: Expenditure on material goods shown by MIT School and calculated per capita student and faculty. ... 86
Table 19: Use status of products purchased 2009 and 2016. ... 87
Table 20: Stock in the form of "active" tagged products that. This is a partial list or sampling that reflects the products that have the highest aggregate dollar value (listed in descending order). ... 88
Table 21: Disposition types and their descriptions for products tagged by the Property Office. 89 Table 22: Forms of disposal of products disposed of between FY2009-FY2016. ... 89
Table 23: The average lifetime (time period while registered as "active") of a sample of commonly purchased, and later deactivated, products. ... 92
Table 24: Generation of hazardous waste by major hazardous waste category. ... 97
Table 25: The composition (by weight) of the waste in MIT’s single stream recycling bins, based on the campus waste audits. Green = compostable, blue = recyclable in single stream recycling, and red = disposable or recyclable using specialty recycling services. (This is the same as Table 10, duplicated here for convenience). ... 100
11 Table 26: Waste flows (in MT) by highly-specific categories. These figures are based on a
combination of institute data and empirical waste audits. ... 102 Table 27: Sample of data and calculations used to estimate GHG emissions from purchases using a modified version of the USEEIO model. ... 107 Table 28: The Global Warming Potential of MIT’s waste management listed by waste stream. ... 113
12
Summary of Figures
Figure 1: A graphical representation of the boundary and scope of the MFA performed in this study. The contents within the black rectangle are included within the study, and the elements outside of the black rectangle are excluded. ... 28 Figure 2: The general approach of data collection for this MFA involved three parallel types of activities: (1) Defining the boundary and scope, (2) Obtaining and aggregating data form university entities, and (3) Collecting primary data to supplement the exisiting data. After that, the disparate data sets were aggregated and used with a set of analytical methods to create an MFA and systems-level analysis of the university. ... 30 Figure 3: Schematic diagram showing the intertwined relationship between researchers,
operations, and MIT's Office of Sustainability. ... 32 Figure 4: A visual representation of MIT’s spend on purchasing. The full rectangle shows the total FY2016 spend, which is divided into material goods (18.4%) and services (81.6%). The division between these two is represented by a wavy line, representing the uncertainty
involved in discerning products and services with the limited level of detail available in the data. The focus of this study is on the material goods, which is further broken down into spend
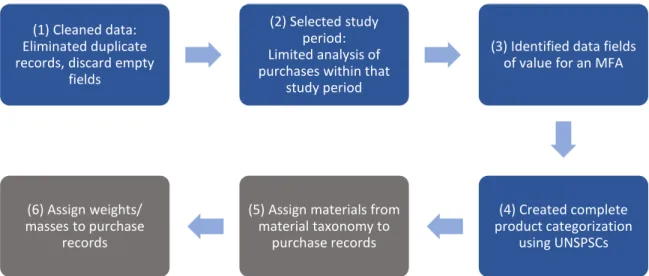
methods, such as purchase orders, ECAT, credit card... 36 Figure 5: Two photos of a waste audit conducted outdoors on MIT's campus. ... 45 Figure 6: Average composition of MIT’s trash bin contents, based on the campus waste audits. ... 51 Figure 7: Average composition of MIT’s recycling bin contents, based on the campus waste audits. ... 51 Figure 8: A flow diagram of the general process used in this study to process and analyze the ECAT purchase records. The blue rectangles are completed actions and the grey rectangles are actions that were attempted but that were not fully completed due to data limitations. ... 58 Figure 9: A hierarchical visualization of the United Nations Standard Products and Service Code (UNSPSC) classification system, showing a small sample of categories. ... 61 Figure 10: The statistics of ECAT purchase records categorized by UNSPSC levels. Note the number of null (empty) values. ... 62 Figure 11: A Sankey diagram showing a sampling of FY2016 ECAT data by UNSPSC Segment, Family, Class, and Commodity. Only the highest-spend categories are included in this figure, for the purpose of readability. All empty values are indicated by “Null.” ... 63 Figure 12: The top categories of spend on material goods in FY16, presented by percentage of total spend. The largest spend categories are Laboratory Supplies, Information Technology Hardware (i.e., HW Purchase/Maintenance), and Laboratory Equipment. ... 72 Figure 13: The classification of FY16 ECAT purchasing of laboratory equipment and supplies by specific commodities (e.g., pipette tips, petri dishes, etc.). The width of the stripe is
proportional to the expenditure ($). ... 74 Figure 14: The classification of FY16 ECAT purchasing of chemicals, biochemical, and gases by specific commodities (e.g., enzymes, antibodies, etc.). The width of the stripe is proportional to the expenditure ($). ... 75
13 Figure 15: The classification of FY16 ECAT purchasing of Information Technology and
Telecommunications Products by specific commodities (e.g., notebook computers, hard drives,
servers, etc.). The width of the stripe is proportional to the expenditure ($). ... 76
Figure 16: The classification of FY16 ECAT purchasing of Furniture and Furnishings by specific commodities (e.g., task seating, tables, etc.). The width of the stripe is proportional to the expenditure ($). ... 77
Figure 17: Spend on material goods via the Electronic Catalog for each fiscal year (2010-2016). ... 78
Figure 18: Monthly variation in purchasing of the top eight product subcategories for FY16 (total university spend). ... 79
Figure 19: Weekly spend on material goods for all of MIT during FY2016. ... 80
Figure 20: MIT’s organizational units with the highest expenditure on material goods. The most prominent product categories are shown for each organizational unit (delineated by color). ... 80
Figure 21: A Sankey diagram showing the relative quantity of purchased goods (in ECAT FY16) by MIT purchasing unit. ... 82
Figure 22: The number of distinct buyers per product category plotted in relation to the expenditure within that product category. ... 84
Figure 23: Campus waste generation in metric tons for FY16 shown by material type ... 94
Figure 24: Waste or materials processing destination of MIT’s outflows. ... 95
Figure 25: Photo of lab-packed bottles. Photo source: MIT EHS. ... 96
Figure 26: Quantity of municipal solid waste generated annually by MIT between FY 2010-2018. ... 98
Figure 27: Average generation of MIT’s MSW by month. ... 99
Figure 28: A Sankey diagram showing general waste categories, specific waste flow categories, and the processing method. ... 103
Figure 29: The Global Warming Potential (in MT CO2-eq) and FY16 spend by purchase category for the most carbon-intensive product categories. GWP is shown in dark blue, and spend in dollar is shown in green. ... 109
Figure 30: Comparison of GHG emissions from purchased material goods (part of Scope 3) to Scope 1 and 2 emissions. ... 110
Figure 31: The Global Warming Potential of MIT’s waste management, presented by waste processing type. The bars in orange represent the tons of waste, and the bars in blue represent the MT of CO2-eq. ... 114
Figure 32: A system diagram of a university campus that more closely resembles a circular economy of materials management. ... 136
14
Chapter 1: Introduction
Chapter 1 Abstract
This chapter introduces the thesis and provides context for the research. The motivation for this research is explained and the relevant background literature is reviewed. Characterizing and quantifying material flows and the related environmental impacts of the consumption and disposal of those materials is important for identifying opportunities for impact reduction efforts. Prior to this study, no systematic analysis had been conducted to determine the profile of materials consumed by a technical university. With the knowledge gaps in mind, the research questions and objectives of this dissertation project are articulated. This research aims to establish a method for conducting a material flow analysis of a university or similar organization and to apply this method to the case of MIT.
Topic and Context
According to the World Resources Institute (WRI), global consumption of natural resources in 2050 is expected to be three times the level it was in the year 2000 (World Resources Institute, 2017). Excessive material consumption, especially in wealthier countries, is problematic for sustainable management of scarce resources, management of waste, human health, and climate change. Typically, the life cycle of material goods includes raw materials extraction, transportation, manufacturing, distribution, use, and disposal/recovery. This life cycle is often linear, meaning that after a product is used, it is thrown away. Studying material consumption must be done at the systems level, given the multi stage processes involved, and given that there is such a high level of complexity in time, space, materials, and energy. Specifically, this thesis uses a systems-thinking lens to examine material consumption at the local level of a university campus.
The United Nations officially resolved to work toward seventeen Sustainable Development goals in 2015 as part of their 2030 Agenda for Sustainable Development (United Nations, 2015). Two of these Sustainable Development goals include “Ensure sustainable consumption and production” (SDG Goal #12) and “Take urgent action to combat climate change and its impacts” (SDG Goal #13). These two goals both relate to the environmental impact of material goods production, consumption, and disposal. Greenhouse gas emissions that contribute to climate change come from directly consuming energy and from consuming materials. Material goods have embodied carbon emissions, which is the carbon dioxide emitted during the processes of mining, manufacturing, distributing, and shipping a material good. Furthermore, the recycling or disposal of products at end-of-life also contributes greenhouse gas emissions, for instance via fuel for transportation or processing of waste.
The UN Sustainability Development goal of “sustainable consumption and production” covers a broad range of industrial and economic activities, including mining, manufacturing, recycling, refurbishing, and disposal. One key method of increasing the sustainability of material
15 maintenance, component replacement, or identifying secondhand markets/users for unwanted goods. Another method for increasing sustainability of consumption is to increase the
circularity of the material flows. Currently, much of the US and the world has adopted a linear approach of material consumption, where individuals and institutions purchase, use, and dispose of the material goods without any cyclical activity. Shifting away from a throw-away culture and toward a circular economy would improve material efficiency. In a circular
economy, there would be a much stronger emphasis on returning, renewing, reusing, as well as reducing material purchases. In fact, reducing material consumption as an individual or
organization is the most impactful method for reducing the greenhouse gas impact of materials management.
Given the global and imminent nature of climate change, more and more cities and institutions are looking to take matters into their own hands by reducing emissions locally. Not only would it be unwise to wait for international climate agreements, but urban areas are responsible for roughly 75% of the global CO2 emissions, and therefore have tremendous potential for reducing global emissions (UNEP-DTIE, 2012). In the process of reducing emissions, it is important for cities to first quantify their baseline emissions via carbon accounting. Yet, most cities,
companies, and universities only report emissions from Scope 1 and Scope 2, which include direct greenhouse gas emissions (GHGE) from production of energy, combustion, or chemical processes, as well as GHGE from imports of electricity/heat/steam (WRI, 2001). Rarely do GHGE reports include Scope 3 emissions, which are all other indirect GHG emissions (including embedded carbon in materials and emissions from waste management). This is because accounting for materials-related emissions is challenging and requires a substantial amount of detailed data collection; specifically, accounting for materials requires carrying out urban metabolism studies and material flow analyses. However, there is increasing recognition that Scope 3 emissions, especially from businesses and industry are important for addressing climate change.
In order to make and measure improvements in material consumption and/or production, one must first know the baseline of the quantity and types of materials currently consumed by the system of interest. For instance, a city government striving to make improvements in this area would need to know its baseline of annually manufactured goods, procured goods, and
disposed material. Quantifying these materials typically requires performing a material flow analysis (MFA). Material flow analysis is the “systematic assessment of the flows and stocks of materials within a system defined in space and time” (Brunner and Rechberger, 2004). It is a valuable tool that can be used to assess the economic impacts and embodied emissions in material consumption. However, a review of the literature reveals that MFAs are usually conducted at the national- or city-level; there are few, if any, urban metabolism studies that have studied sub-city units (such as urban districts, living communities, or university campuses). It should also be noted that interactions with materials at any stage of the product’s life cycle can have human health impacts. For instance, off-gassing from flame retardants embedded in products can be harmful during the use of a product, and incineration as a form of waste management can create poisonous dioxins. Consequently, MFAs can also be helpful for
16 measuring human health impacts, such as toxicity. However, in order for an MFA to be useful for assessing toxicity of materials, it must contain a highly comprehensive accounting of chemicals and materials, which requires knowing a detailed bill of materials. It also requires knowledge of how each type of product is used and disposed of. This type of data was not available for this project, and therefore, this study does not assess human health impacts of materials consumed.
As described by Kennedy et al. (2011), urban metabolism involves systems-level quantification of the inputs, outputs and storage of energy, water, nutrients, materials and wastes for an urban region. As part of this process, it is usually necessary to conduct a material flow analysis, in which flows and stocks of materials are quantified using a combination of systems thinking and mass balance. By quantifying resource consumption of non-renewable resources and other materials, this type of work provides data that is necessary (but not sufficient) for urban
greenhouse gas accounting; life-cycle emissions factors (such as X kg CO2-eq per kg of material consumed) are also needed for GHGE accounting.
Universities are major consumers and disposers of a wide variety of materials, but their specific flows are not well characterized. A university’s environmental impact comes from both energy consumption and material consumption; universities know their energy consumption relatively well, but to quantify the environmental impact of purchasing and materials handling, material flows must be quantified. To date, few or no material flow analyses of universities have been conducted.
Literature Review
Material flow analysis of complex systems involve keeping track of a large diversity of materials and products. This means a large quantity of data on purchasing, stored goods, and disposed materials must be collected and accessed. Furthermore, conducting an MFA requires using a systematic naming convention, in which materials are identified and grouped consistently.
Material and Product Types
Conducting a material flow analysis requires determining the scope of materials included and then grouping materials into categories. Allesch & Brunner (2015) reviewed 83 studies that focused on Material Flow Analysis for waste management and identified the importance of including both an analysis of the level of products as well as of materials. Taking both the products and the materials into account allows for profound decision making on improving resource and waste management.
Existing material taxonomies (or nomenclature systems) were reviewed to provide context on material categorization. These taxonomies were analyzed for their level of specificity, the mix of material types and product types, and adherence to a standard form.
One of the standard frameworks for categorizing material flows by type at the national level (and often also used at the city level) is the classification of materials outlined in the
Economy-17 wide Material Flow Accounts (EW-MFA) handbook (Eurostat, 2018). This handbook, put
together by Eurostat – a statistical office of the European Union – contains the list of materials in its Annex A. It contains eight broad classifications:
1. MF.1 Biomass 2. MF.2 Metal ores
3. MF.3 Non-metallic minerals
4. MF.4 Fossil energy materials/carriers 5. MF.5 Other products
6. MF.6 Waste for final treatment and disposal 7. MF.7 Domestic processed output
8. MF.8 Balancing items
These classes have multiple subclasses of materials, creating a hierarchical taxonomy in which, for instance, MF.1 is Biomass, MF.1.1 is Crops, and MF.1.1.5 is Nuts (Eurostat, 2016). In the new, pared down EW-MFA agreed upon Nov 17, 2016, there are about 130 categories of materials. The older version from 2001 is more extensive, has several hundreds of categories, and drills down to a higher specificity (e.g., Treenuts Almonds) (Eurostat, 2001). The Eurostat EW-MFA taxonomy is tailored for tracking international physical imports and exports, reporting mining and manufacturing, and producing balancing MFAs. According to Annex III of the
Regulation, the EW-MFA is used to “compile different economy-wide material flow indicators for national economies.” The breadth of materials covered in EW-MFA is wide, and includes solids, liquids, and gases.
One notable element of EW-MFA is that it contains all classifications in terms of materials, and includes no products, even for characterizing imports and exports; as stated in the Economy-wide Material Flow Accounts Handbook 2018 Edition, “In EW-MFA, traded products are not classified by product classifications, but are assigned to material classes, groups and sub-groups according to the main material the product is composed of” (Eurostat, 2018). To account for the differences in physical imports/exports that go beyond material type, EW-MFA has another layer of classifications that can be used to indicate the “stage” of manufacturing: raw products, semi-finished products, and finished products.
The material taxonomy presented by Ashby’s textbook was also reviewed (Ashby, 2009). Ashby’s taxonomy has five broad categories:
1. Metals and alloys
2. Polymers and elastomers 3. Ceramic and glasses
4. Hybrids – composites, foams, wood, paper 5. Man-made and natural fibers
There are 61 subcategories across the five categories above, such as copper alloys,
polyethylene, soda-lime glass, and cotton. In contrast to Eurostat, Ashby’s taxonomy comes from a materials science background and the field of materials selection for specific design and manufacturing performance goals. Ashby’s taxonomy is much narrower and oriented for
18 technical materials (solids only); foods, along with many other categories of materials, are not included.
MFA at the National Level
Material flow analysis was originally developed as a tool to be applied at the national level. The method was first defined in The Weight of Nations (Matthews, Amann, & Bringezu, 2000). The Weight of Nations was the product of a collaboration between the World Resources Institute and researchers in Europe and Japan. The goal of the report was to document the materials that flow through national economies and create sets of national physical accounts of
materials, as well as develop indicators of materials flows to complicate economic indicators. MFA is mostly and substantially applied at the national level. As a result, the EURO Stat convention for MFAs are standards were designed for national-level, economy-wide material flow analyses. Typically, when MFA is used to characterize national-level flows, trade data is used. Trade data conveniently provides information on the quantity and value of material goods that enter a country as imports and leave the country as exports. Such national-level MFAs typically focus on mass balance and provide coarse greenhouse gas emission estimates.
MFA at the City and Sub-city Level
Numerous urban metabolism case studies have been conducted for cities around the world, such as Hong Kong, Cape Town, Vienna, Singapore, and Lisbon (Kennedy et al, 2011). One especially interesting study conducted by Rosado et al. (2016) analyzed three cities in Sweden and found that the type and quantity of materials consumed highly depends on the ratio between services and production GDP and the number of large construction projects. The authors used those findings to develop three distinct city consumption profiles: (1) consumer-service, (2) industrial, and (3) transitioning.
An emerging interest in the field of urban metabolism has been the nature of consumption at the sub-city district level (Codoban & Kennedy, 2008). Opportunities that arise include the ease of decision-making and actions at a local level that hold promise for shifting to a more
sustainable state. A review of the literature reveals there are few, if any, urban metabolism studies that have studied sub-city units (such as urban districts, living communities, or university campuses).
University-Level MFA
Interestingly, universities have the potential to be a unit of analysis conducive to useful
knowledge-creation and decision-making similar to that found in the broader urban metabolism literature. Universities have well-defined geographic and political boundaries and tend to keep relatively good institutional-level records of purchase and waste data, which can facilitate materials accounting. Universities, as distinct entities, are largely consumers of resources, with little if any extraction on site. Universities contain a large variety of activities and “industries” that involve consumption of a diversity of material goods; contained within the campus are
19 offices, classrooms, laboratories, a medical center, restaurants, various types of housing, and more. Universities also store resources at a variety of time scales (from days to decades). Universities remove wastes from their spatial extent and disperse those materials far and wide. In their publically viewable reports, most university and corporate campuses only report the quantity of waste generated, namely reporting the mass going to landfill, recycling, composting, or hazardous processing. I have only found three case studies of universities that have
attempted to do partial material flow analyses of their campuses.
The University of British Columbia did in-depth studies of the quantity and composition of waste generated at the university for the purpose of identifying ways to reduce solid waste generation in higher education (Smyth, Fredeen, & Booth, 2010). Smyth et al. found that the campus generated between 1.2-2.2 metric tons of municipal solid waste per week; they also called attention to three material types that provide large opportunities for increased recycling and reduction: (1) paper + paper products, (2) disposable drink containers, and (3) compostable organics.
The University of Michigan also has studied its waste composition in detail – they have quantified the percentage of compostable material in the waste stream of many different campus building types - administrative, classroom, research, residence hall, and student union (Graham Sustainability Institute and the UM Office of Campus Sustainability, 2011). The University of Michigan also made a first attempt at conducting a campus-wide MFA; they quantified the university’s expenditure in 10 different purchase categories, such as laboratory supplies, food and beverage, medical expenses, and plant operation and maintenance. They used these expenditure values with economic-input output LCA to estimate environmental impacts in terms of human health (Disability-Adjusted Life Year), kg CO2-eq and MJ of
resources. One noticeable weakness of the work (or difference from my study) is that it did not distinguish between goods and services, which most likely resulted in an overestimation of the materials footprint. As an example, their analysis included travel spend, tax preparation and banking.
One research project applied a systems approach to understanding material flows on a university campus, using the case study of Furman University, a small liberal arts university in South Carolina (Dripps, Gay, & Purvis, 2017). Dripps et al. applied a campus metabolism approach to map inflows, transformations, and material outflows of four resource categories: water, energy, food, and materials. However, the project description available focused on methodology, and did not report results.
Only one prior research project sought to quantify the masses of materials purchased by a university. Tessa Bouzidi of Wageningen University (WUR) wrote her master’s thesis on the material consumption of WUR, a Dutch university with a strong agriculture focus. In the thesis, Bouzidi created a “product flow analysis for the university, with the focus of helping the campus transition towards a circular economy (Bouzidi, 2019). Bouzidi’s research aimed to identify the 2017 product flows for Wageningen University in terms of mass, costs, and environmental
20 pressure (CO2-eq and MJ). She utilized purchase records from an online system called ProQme, as well as waste data collected from waste contractors. Because the purchase records did not contain mass values for products, Bouzidi obtained most product weights manually, weighing the products that occurred most in each product subcategory (a total of 138 subcategories). The largest product categories (by mass) were found to be labware, plants, animals/feed, and vehicles. The largest waste streams were found to be mixed trash, paper waste, hazardous waste, and swill waste.
A publication from 2000 reported the greenhouse gas emissions associated with universities, viewed as an industry sector. Rosenblum et al. (2000) used Carnegie Mellon’s EIO-LCA tool to analyze four service industries, one of which was “colleges and universities.” This paper highlighted certain findings that already existed in EIO-LCA data. The paper reports that the global warming potential of spending one million dollars in the “industry” of colleges and universities is equivalent to 300 metric tons CO2-eq; and, the total emission output from the sector of colleges and universities in the US is 13 million metric tons CO2-eq. According to Rosenblum et al., “Colleges and universities are a relatively small sector with small direct impacts, except for emissions presumably associated with laboratory work.” The authors also identified the largest supply chain sectors enters colleges and universities for environmental outputs; based on toxic releases, the largest sectors are: primary nonferrous metals, industrial inorganic and organic chemicals, paper and paperboard mills, pulp mills, and miscellaneous plastic products.
Larsen et al. (2013) analyzed the carbon footprint of the Norwegian University of Technology and Science (NTNU). Larsen at al. applied an Environmental Extended Input-Output model to calculate the carbon footprint of NTNU using financial spend data. They found that 30% of the NTNU’s carbon footprint comes from non-building materials: 11% comes from “consumables” and 19% comes from equipment, such as lab equipment, machinery, computers, etc. The authors normalized the carbon footprint per student and found it to be 4.6 tons CO2-eq per student, on average; however, the carbon footprint of a student in social science was 0.58 tons CO2-eq, versus 10.8 tons CO2-eq for a student in medicine. Larsen et al. were able to calculate these values by department due to the standardized structure of financial accounting used by the university. When the carbon footprint was normalized by dollars spent, the carbon
intensities were fairly similar across different departments.
Although it is rare for universities to report Scope 3 emissions, the University of Cambridge has assessed Scope 3 emissions for fiscal year 2013. Woodhouse and Couling (2014) published a report that estimates Scope 3 emissions of University of Cambridge, which includes emissions from waste collection and management and procurement of goods and services. Their analysis estimated total Scope 3 emissions to be 170,000 tons CO2-eq. Of this, waste accounted for 5,179 tons CO2-eq and Procurement accounted for 125,943 tons CO2-eq (35,018 tons CO2-eq for Construction, and 90,026 tons CO2-eq of “Other”). When compared with Scope 1 and Scope 2 emissions, Cambridge found that 36% of total university emissions come from procurement of non-construction materials and services. This proportion is similar to the findings of Larsen et al. It should be noted that this figure does not separate out the impact of material goods from
21 procured services. One weakness of the report is that it does not provide any information on how the authors calculated the emissions figures.
A summary of the literature reviewed above, which address MFA and/or Scope 3 analysis of university campuses is provided in Table 1.
Table 1: Summary of reviewed literature addressing material flow analysis and/or Scope 3
analysis of university campuses.
Reference Year University Research Scope Importance Or Relevant Findings
Smyth, Fredeen, & Booth 2010 University of British Columbia (Canada) In-depth studies of quantity and composition of waste generated at the university
Found that the campus generated between 1.2-2.2 MT of MSW per week.
Found that three streams provide large opportunities for increased recycling and reduction: (1) paper + paper products, (2) disposable drink containers, and (3) compostable organics. Graham Sustain-ability Institute & Office of Campus Sustai-nability 2011 University of Michigan (USA) Studied waste composition in detail. Quantified the % of compostable material in waste stream of diff. campus building types: administrative, classroom, research, residence hall, + student union.
Made first attempt at conducting a campus-wide MFA; quantified the university’s expenditure in 10 diff. purchase categories, such as lab supplies, food and beverage, medical expenses, and plant operation and maintenance
Used these expenditure values with EIO-LCA to estimate environmental impacts in terms of human health (Disability-Adjusted Life Year), kg CO2-eq and MJ of resources.Study did not distinguish between goods and services, which most likely resulted in an overestimation of the materials footprint.
Dripps, Gay, & Purvis 2017 Furman University (USA) Applied a systems approach to understand material flows on campus.
Applied a campus metabolism approach to map inflows, transformations, and material outflows of four resource categories: water, energy, food, and materials. The project description available only contained methods, and did not report results.
Bouzidi 2019 Wageningen University (The Netherlands) Created product flow analysis for the university. Aimed to identify the 2017 product flows for the university in terms of mass, costs, and environmental pressure (CO2-eq and MJ).
Utilized purchase records from an online system called ProQme, as well as waste data collected from waste contractors.
Manually weighed the products that occurred most in each product subcategory (a total of 138
subcategories).
The largest product categories (by mass) were found to be labware, plants, animals/feed, and vehicles. The largest waste streams were found to be mixed trash, paper waste, hazardous waste, and swill waste.
22 Rosenblum, Horvath, & Hendrickson 2000 Carnegie Mellon (USA) Used Carnegie Mellon’s EIO-LCA tool to analyze four service industries, one of which was “colleges and universities.”
Reported GWP of spending $1 million in the “industry” of colleges and universities is equivalent to 300 MT CO2-eq.
Found that colleges/universities are a relatively small sector with small direct impacts, except for emissions from laboratory work.
Identified the largest supply chain sectors entering colleges/universities for environmental output. Based on toxic releases, the largest sectors are: primary nonferrous metals, industrial inorganic and organic chemicals, paper and paperboard mills, pulp mills, and misc. plastic products.
Larsen, Pettersen, Solli, & Hertwich 2013 Norwegian University of Technology and Science, NTNU (Norway) Analyzed carbon footprint of the university. Larsen at al. applied an Environmental Extended Input-Output model to calculate the carbon footprint of NTNU using financial spend data.
Found that 30% of the NTNU’s carbon footprint comes from non-building materials: 11% comes from
“consumables” and 19% comes from equipment, such as lab equipment, machinery, computers, etc.
Normalized the carbon footprint per student and found it to be 4.6 MT CO2-eq per student, on average; 0.58 MT CO2-eq for a social science student, versus 10.8 MT CO2-eq for a student in medicine.
When the carbon footprint was normalized by dollars spent, the carbon intensities were similar across different departments. Woodhouse & Couling 2014 University of Cambridge (UK) Assessed Scope 3 emissions for FY 2013, including emissions from waste collection + management and procurement of goods + services
Estimated total Scope 3 emissions to be 170,000 MT CO2-eq. Of this, waste accounted for 5,179 MT CO2-eq and Procurement accounted for 125,943 MT CO2-eq (35,018 MT CO2-eq for Construction, and 90,026 MT CO2-eq of “Other”).
When compared with Scope 1 and Scope 2 emissions, 36% of total university emissions come from
procurement of non-construction materials and services.
Abbreviations for Table 1:
EIO-LCA = Economic Input-Output Life Cycle Assessment FY = Fiscal Year
GWP = Global Warming Potential MJ = Mega Joules
MSW = Municipal Solid Waste MT = Metric Tons
An analysis of the literature reveals that there are four major knowledge gaps.
(1) All previous comprehensive urban metabolism studies use cases of cities. It remains to be seen if urban metabolism modeling can be applied effectively to a university context. (2) Most MFAs utilize economic and trade data to estimate flows.
23 (3) Most universities have little knowledge of the “big picture” of their material
consumption profile and there is no established methods for gaining this knowledge. Only with this knowledge can universities characterizes and measure Scope 3 materials-related emissions.
(4) There is no standard material/product taxonomy for characterizing material flows into and out of universities.
Previous Research on MIT
Prior to this project, Prof. John Fernandez and Dr. Julie Newman worked with a small group of MIT students on first developing the idea of an MFA for a university campus: Trygve Wastvedt, Rene Miller, and Rena Yang initiated the project in Spring 2014, and Chaewon Ahn and Jeff Treviño continued the project in June-July 2014. The origins of those projects began in an Industrial Ecology course (MIT course ESD.123) taught by Elsa Olivetti. These initial projects laid down a framework of looking at material flows of different velocities, and first initiated the conversation with the Office of Procurement. Wastvedt et al. and Ahn et al.’s framework separated consumption of materials into “Nondurable,” “Durable,” and “Semi-permanent” materials. Ahn et al. further separated flows into the four categories based on consumption “velocities:”
V0: Material flows are consumed continuously and remain in the system for a short
period of time (water, electricity, natural gas)
V1: Material flows are consumed discretely per day and remain in the system for around
1 year or less (paper, food, office supplies)
V2: Material flows are consumed discretely each 1 - 4 years and remain in the system
for 3-10 years (equipment)
V3: Material flows are consumed discretely whenever a building is built and remains for
over 10 years (construction materials)
The student work by Wastvedt et al. and Ahn et al. demonstrated four lessons that are useful to this dissertation project. First, it provided proof of concept that a material flow analysis of a university campus is possible, in the sense that the data needed to do an MFA exists in various forms and many places. Second, their work showed that MIT’s purchasing did not diminish during the summer, but rather there was a fairly constant level of purchasing through the summer. This may also be true for other research universities that maintain strong activity throughout the summer months; perhaps this is different for liberal arts universities, which may have a greater flux in population over the summer. The third lesson from previous students’ work was that purchasing at MIT is complicated – it occurs in so many different parts of the university that it is difficult to understand how it works. This complexity of the system requires a PhD project to understand it. Lastly, since MIT has fairly good control over purchasing, a potential decision to alter purchasing and purchasing behavior is theoretically possible.
24
Research Questions and Objectives:
The following are the principal research questions driving the research of this dissertation:
Q1: How does one carry out a material flow analysis of an urban university campus? Q2: What are the major material flows into and out of a university campus?
Q3: What opportunities exist for increasing efficiency of material consumption and
lessening the university’s environmental impact from purchasing and disposal of material goods?
In order to answer these questions, the author designed an in-depth case study of MIT’s
materials consumption. As stated above, MIT serves as a valuable case study for many reasons. First, it is a university that consumes and disposes of a diversity of materials (chemicals, lab equipment, electronics, paper, food, etc.). In addition, MIT has its own power plant, medical clinic, and nuclear research reactor, which distinguish it from other smaller campuses. MIT is also a well-recognized institution with a large budget, and therefore is likely a large consumer of material goods.
Furthermore, MIT believes such a study is important; MIT’s Office of Sustainability has invested money and resources into this research and will likely make use of the research findings. MIT’s administration may also find the outcomes of this study useful for targeting emissions
reductions. Given that MIT has committed to reducing its GHG emissions by 32% by 2030, the university will need to make substantial changes in energy and/or material consumption. MIT began upgrading its Central Utilities Plant in 2017, and is in the process of replacing its old turbine with two new gas-powered ones (MIT, 2019). Consequently, it can be expected that MIT will continue to use natural gas for at least the next 15 years (MIT, 2017). Therefore, MIT has even greater reason to identify opportunities to reduce GHGE via a reduction in its materials footprint.
To direct the case study of MIT, the following research objectives were established:
O1: Characterize the materials flow profile of the campus, revealing consumption
patterns for various material groups
O2: Quantify the material inflows, stocks, and outflows in terms of dollar value or mass O3: Identify the university processes/activities that have the largest material cost O4: Characterize the organizational structure (including the degree of centralization) of
25
O5: Recommend institutional opportunities to increase materials sustainability via
institutional policy, organizational changes, or new programs
Overview of the Structure
This thesis contains seven chapters, including this one. At the beginning of each chapter, there is a short abstract, or summary of the chapter’s content. Chapter 2 describes the methods for conducting an MFA at a technical university. Chapter 3 is also a methodologically-focused chapter, specifically focusing on the methods associated with data processing purchase records for an MFA. Chapter 4 provides the results of the MFA. Chapter 5 contains the methods for and results of the greenhouse gas estimate of inflows and outflows. Chapter 6 discusses the
organizational and behavioral factors that influence purchasing and purchasers at MIT through analysis of interviews conducted by the author. Lastly, Chapter 7 provides a discussion of results, recommendations, and conclusions.
26
Chapter 2: Methods for conducting an MFA at
a technical university
Chapter 2 Abstract
Chapter 2 documents the many-faceted processes involved in conducting an MFA of a university campus, using MIT as a case study. This chapter establishes a method for doing a first-order characterization/quantification of the material flows. The objective was to track all major material inflows to, stocks within, and outflows from the university’s campus, excluding construction materials, fuel, and water. In this chapter, the boundary and scope of the study are established, and the methods for gathering and analyzing various data sources are
described. The chosen year of study was MIT’s Fiscal Year 2016 (FY16). Procurement purchase records were used to understand inflows, minor property/assets data were used to
characterize stocks, and waste handlers’ data in combination with primary data (waste audits) were used to estimate outflows. The results of the waste audits are also reported in this chapter. Material flows were characterized using a combination of product and material categories, and a new, university-specific material taxonomy was created. This case study demonstrates that an MFA of a university requires the use of a portfolio of diverse methods, which deliver different outcomes that then must be pieced together.
Introduction to Methods
This chapter documents the many-faceted processes involved in conducting an MFA of a university campus. The authors used MIT as a case/test study. MIT is a technical, research university located in Cambridge, Massachusetts, USA. The methodological lessons learned are likely applicable to other university campuses, and perhaps beyond to other institutions or sub-city units. This case study demonstrates that an MFA of a university requires the use of a variety of methods that provide different results, which then must be integrated to construct the system analysis. In order for this to be done successfully for an MFA, data needs to be gathered in a systematic and economical way. A number of challenges were encountered during this undertaking. Some of these challenges were resolved, and others are further analyzed in the Discussion chapter. Some challenges can only be resolved with more data.
Boundary and Scope
Multiple factors might be used to determine the scope and boundaries in a university-level MFA: (1) geographic boundaries, (2) activity sectors and missions (research, education, and operations), (3) fiscal responsibility for materials, (4) governance over material decision-making, and (5) types of materials.
For this analysis, the physical bounds of the system are relatively clear, given that the campus has defined geographic boundaries. In this case, the area of study was limited to MIT’s
27 campus includes 190 buildings that comprise roughly 13 million square feet. Other MIT-owned or associated properties at separate locations (Lincoln Laboratories and the Haystack
Observatory) were excluded. On-campus dormitories and housing communities (fraternities and sororities) were included, but off-campus housing was excluded.
To track what materials were purchased and handled by the Institute, the geographic boundary was used in conjunction with the administrative, organizational structure of MIT. The campus serves a population of roughly 22,500 students, faculty, researchers and staff. The Institute has several levels of organization and serves educational, research, administrative, and operational purposes. Administratively, the university has five schools, the sum of which contain 31
academic departments. There are also over 400 other entities that span research labs, centers, operational units, and administrative organizations. Knowledge of these subdivisions, along with an understanding of their political and monetary control over materials, was used to determine the MFA system boundaries. This helped ensure that all major activities and populations consuming materials were included in the analysis.
The materials and products included in the scope of the MFA are highly diverse, ranging from lab supplies to electronics, to food. However, some major streams, namely tap water and sewer water, fuels, and building materials were excluded. This scope is illustrated by Figure 1. When determining the scope of an MFA for a university campus, there are strong implications surrounding the inclusion of building materials from construction and renovation. Campuses often expand rapidly and frequently renovate, and therefore their materials consumption profile may be dominated by building materials, if such materials are included. The lifetimes of building materials and common consumable goods (food, office supplies, furniture etc.) are so different that separating the two allows for a logical divide in terms of data collection and recommendations for decision making. Lifetimes of buildings are much longer, and the magnitude of masses is much greater than other consumed materials. In order to focus the research on consumable material goods, a choice was made in this study to exclude building materials. Water (for drinking, bathing, heating, etc.) and fuel were also excluded from the scope.
28
Figure 1: A graphical representation of the boundary and scope of the MFA performed in this
study. The contents within the black rectangle are included within the study, and the elements outside of the black rectangle are excluded.
Defining Inflows, Stocks, and Outflows
The objective of this MFA was to track all major material inflows to, stocks within, and outflows from the University’s campus, excluding construction materials, fuel and water. Materials were counted as inflows if they were purchased by an MIT organization/entity located on the main campus or a contracted campus vendor (e.g., vendor operating the MIT dining hall). Here, the fiscal responsibility was clearly traceable to MIT whereby the Institute made the purchase directly or indirectly via a larger contract.
Material flows were tracked and quantified at the annual scale (according to the fiscal year). The year of study was chosen to maximize the quantity and quality of data available, while being as current as possible. This MFA is for Fiscal Year 2016, also known as FY16, which covers the dates of July 1, 2015 through June 30, 2016.
A given material’s lifetime was used to distinguish flows from stocks. Materials residing on campus for a year or longer were defined as stocks. All rapidly-consumed materials purchased and disposed of within a given fiscal year (e.g., food, disposable cutlery, and printer paper) were considered to be both inflows and outflows for that same year.
Outflows were defined as the materials the university is responsible for removing from the campus as waste, recycling, reuse, or donation. In most cases, the collection of these flows is done by university staff or hired contractors. Any material once classified as an inflow or stock
29 that is removed from campus was treated as an outflow. It should be noted that a small
portion of outflow materials qualifies as an originally private purchase that becomes the material responsibility of the university. An example of this is the packaging and food waste from packed lunches, brought to campus by students and staff.
The General Approach
Early on, it became clear that conducting an MFA at MIT was a large undertaking that involved a diversity of data collection strategies, data sources, and methods of analysis.Given that a major question of this study was, “how does one conduct an MFA for a university?” the method used in this project involved experimental components and some trial and error. The general
approach taken to perform this MFA is shown in Figure 2. The general approach of data collection for this MFA involved three parallel types of activities:
(1) Defining the boundary and scope
(2) Obtaining and aggregating data from university entities (3) Collecting primary data to supplement the exisiting data
Subsequently, the disparate data sets were aggregated and used with a set of analytical
methods to create an MFA and systems-level analysis of the university. Specifically, this analysis involved the following four tasks:
(1) Process and integrate disparate data sets from multiple sources
(2) Assign materials and products categories from the appropriate taxonomy (3) Normalize units to enable comparison and summation of material flows
30
Figure 2: The general approach of data collection for this MFA involved three parallel types of
activities: (1) Defining the boundary and scope, (2) Obtaining and aggregating data form university entities, and (3) Collecting primary data to supplement the exisiting data. After that, the disparate data sets were aggregated and used with a set of analytical methods to create an MFA and systems-level analysis of the university.
Define boundary and
scope
Determine the geographic,
administrative, and financial boundary of the system of study Determine what
material goods would be included in and excluded from the scope of analysis
Select a material and
product taxonomy for
characterizing material flows
Obtain and aggregate
data from campus
entities
Obtain purchase records from the Office of
Procurement
Obtain waste generation data from Dept. of
Facilities
Obtain hazardous, medical, radiocative waste data from EHS Obtain records on tagged property from
Property Office
Obtain additional MFA data from other MIT
entities
Collect primary data to
supplement existing
data
Conduct waste audits
to determine
composition of trash and recycling
Conduct in-person interviews with MIT
purchasers of material goods
(1) Process and integrate disparate data sets from multiple sources
(2) Assign materials and products categories from the appropriate taxonomy (3) Normalize units to enable comparison and summation of material flows
(4) Quantify material inflows, outflows, and stocks to best-possible approximation
General Approach for Conducting an MFA of the University
31 In practice, conducting many of the above-mentioned activities was challenging. Some of the primary challenges included:
The system is complex because there are multiple ways to purchase goods for/at MIT Unexpectedly high level of effort and delays involved in establishing contact with MIT
staff and obtaining data from several different offices and departments Messy and incomplete data sets that were difficult to process
Clear presence of data, but unclear ownership of and policies for sharing that data (i.e., lack of data governance)
University concern about security and sharing institutional data with a student researcher
Necessity to establish trust with university operational entities to enable data sharing with the student researcher
In order to overcome these challenges, the author used the following strategies, among others: 1. Form connections with various operational and administrative entities within the
university that are involved in the collection and management of institutional data. 2. Develop a working partnership with the Office of Sustainability.
3. Gain publicity within the university about the project. Elicit excitement and exposure to the project to higher-up financial administrators, who eventually would be more willing to approve the sharing of data with the researcher.
More detail about these challenges and specific recommendations for avoiding and/or overcoming them are discussed in Chapter 7.
32 To overcome the above challenges, one tactic that this author used was to directly work and collaborate with strategically powerful university actors. This helped the author, a student researcher, establish trust and connections with the right people. Specifically, the author gained credibility through a combination of working with the Director of MIT’s Environmental Solutions Initiative (ESI), MIT’s Office of Sustainability (MITOS), and by establishing relationships with various operational entities. With the Directors of MIT’s ESI and MITOS on the doctoral committee, this research truly demonstrated a collaboration between academics, operational departments, and the university’s Office of Sustainability. Figure 3 symbolizes this intertwined relationship between these three different actors at the University, all of whom rarely come together for the purposes of applied research. One finding from research is that the
establishment of relationships with university administrators and operational staff can be just as important as establishing relationships with academics. Collaboration between these actors is necessary for accomplishing interdisciplinary work within such a complex system of separated research university departments/groups.
Figure 3: Schematic diagram showing the intertwined relationship between researchers,
operations, and MIT's Office of Sustainability.
Gathered Data Sources
Gathering data for this MFA required the acquisition of several disparate data sets, managed by different MIT departments and groups. (2) Obtaining and aggregating data form university entities, and (3) Collecting primary data to supplement the existing data
Operations (Facilities, Procurement, EHS, etc.) Office of Sustainability Researchers (Students, Faculty, Research Scientists)