HAL Id: hal-02498135
https://hal.archives-ouvertes.fr/hal-02498135
Submitted on 23 Mar 2020HAL is a multi-disciplinary open access archive for the deposit and dissemination of sci-entific research documents, whether they are pub-lished or not. The documents may come from teaching and research institutions in France or abroad, or from public or private research centers.
L’archive ouverte pluridisciplinaire HAL, est destinée au dépôt et à la diffusion de documents scientifiques de niveau recherche, publiés ou non, émanant des établissements d’enseignement et de recherche français ou étrangers, des laboratoires publics ou privés.
Phase behavior of aqueous solutions of ethaline deep
eutectic solvent
Aicha Jani, Thibaut Sohier, Denis Morineau
To cite this version:
Aicha Jani, Thibaut Sohier, Denis Morineau. Phase behavior of aqueous solutions of etha-line deep eutectic solvent. Journal of Molecular Liquids, Elsevier, 2020, 304, pp.112701. �10.1016/j.molliq.2020.112701�. �hal-02498135�
Journal Pre-proof
Phase Behavior of Aqueous Solutions of Ethaline
Deep Eutectic Solvent
Aicha Jani,† Thibaut Sohier,† Denis Morineau†*
†Institute of Physics of Rennes, CNRS-University of Rennes 1, UMR 6251, F-35042 Rennes, France
ABSTRACT: We have established a detailed phase diagram of a prototypical DES as a function of the hydration level. Two distinct thermal phase behaviors are observed depending on the water content with respect to a cross-over composition Wg’ = 30%. For W < Wg’, the formation of ice is not observed under the experimental conditions used in this study, and the solution falls in the category of glassforming systems. Fully vitreous states could also be obtained between 30% and 50%, but they are metastable with respect to water crystallization. For W > Wg’, ice crystallization occurs but the residual DES solution remains amorphous (liquid or glassy). In the latter case, whatever the initial water fraction, this transformation finally ends at the fixed composition Wg’ corresponding to 6 to 10 water molecules per choline ion for the two studied DESs. We infer that the residual liquid water molecules forming this maximally freeze-concentrated solution are strongly interacting with DES molecular units. This situation is also known as the "water-in-DES" case. Conversely, ice crystallization concerns free water molecules, provided that W > Wg’, also known as the "DES-in-water" case. This entire phase behavior is explained in the context of maximally freeze-concentrated solutions and attributed to the concomitant effects of ice freezing depression, glassforming ability of weakly hydrated DES
Journal Pre-proof
(W < Wg’) and water structure distortion. This study also highlights the potential of DESs for their uses in freeze-drying processes and biopreservative applications.
Corresponding Author : * E-mail: [email protected]
KEYWORDS Deep Eutectic Solvents, Ethaline, Maximally Freeze-Concentrated Solution, Differential Scanning Calorimetry
Journal Pre-proof
1.
INTRODUCTION
For the last decade, deep eutectic solvents (DESs) have been the matter of tremendous interest. They are presented as promising alternative to classical solvents, combining many benefits of ionic liquids, while being more affordable and usually less toxic. There include high solvating and extracting properties and low volatility. Prototypical DESs can also exhibit specific nanostructures, which are maintained during freezing or the addition of water, making them resilient to dissociation into clusters of the H-bonded molecules [1, 2]. As such, the introduction of DESs in more sustainable industrial processes has been considered in many different fields such as extraction, (bio)synthesis, catalysis, electrochemistry, carbon dioxide capture [3-5].
The notion of DESs has been introduced in the pioneering work of Abbott et al. [6, 7]. Originally, they were obtained by mixing a hydrogen bond acceptor or an organic salt (generally a quaternary ammonium) with a hydrogen bond donor (e.g. acid, alcohol). The mixing of the two or more solids forming the DES, exhibits a large melting point depression associated to the existence of an eutectic point [8, 9]. For practical application, it is expected that the eutectic point lies below room temperature, insuring that the binary mixture is liquid in normal condition. Non-ideal mixing effects, which could arise from the specific H-bonded association of the DES compounds is generally accepted to explain the exceptional lowering of the melting point of certain DESs well below room temperature, as well as their remarkable solvent properties.
Recently the notion of DES has been considered in a more loose way in the literature, including liquid mixtures formed by H-bonded systems that do not necessarily present non-ideality. Even more, the experimental determination of the eutectic point remains unsolved for many of them.
Journal Pre-proof
As underlined in ref. 9, it demonstrates the need for a stricter definition and consequently a deeper thermodynamic characterization of DESs.
An even more complex situation can be encountered when DES is used as ingredient in the preparation of multicomponent systems. A first step in this direction concerns the addition of water to DES, which is proposed to circumvent some limitations, such as viscosity, while keeping its functional properties [10]. The integrity of DES could be destroyed in biphasic aqueous systems, while its local arrangement could be preserved in single-phase aqueous DES mixtures up to a moderate degree of hydration [1, 11]. The physical properties of water-ionic liquids and water-DES mixtures, including excess properties, viscosity, acoustic, structural and optical properties have been studied around ambient temperature and above [1, 12-19].
In the present work, we investigated the phase behavior of aqueous mixtures of a prototypical DES (Ethylene Glycol/Choline Chloride) system from mild hydration levels to complete dilution and temperatures ranging from -150 to 50°C. We have established a detailed phase diagram resolving the transitions between equilibrium phases as well as metastable glassy states. Interestingly, the phase behavior highlights a cross-over in the thermodynamic behavior at a hydration level Wg’~30% where the structure of DES is usually disrupted. The nature of this specific composition, which is recovered on cooling in the fluid phase whatever the initial DES composition, is discussed in the frame of maximally freeze-concentrated solutions. While this concept has been commonly used in relation to freeze-drying processes, its application to DES aqueous solutions is original.
2.
METHODS
Journal Pre-proof
2.1. Samples. Choline chloride (>99%) and ethylene glycol (anhydrous, 99.8%) were purchased from Sigma-Aldrich. Two DES were prepared by weighting and adding ethylene glycol and choline chloride in a molar ratio of 2:1 and 3:1, which is in the region of maximum freezing depression [20, 21].The DES were mixed by mechanical agitation at about 60°C for 30 min until a clear homogeneous liquid phase was obtained and served as stock solutions. Two series of 10 working solutions were prepared by pipetting and addition of deionized water.
2.2. DSC Experiments. The differential scanning calorimetry (DSC) measurements were performed with a Q-20 TA Instrument equipped with a liquid nitrogen cooling system. The melting transition of an indium sample was used for calibration of temperature and heat flux. The samples were loaded in sealed aluminum hermetic pans and their masses, typically 6 mg were measured with a microbalance. In general, the temperature was ramped linearly on cooling and heating in the temperature range from -150°C to 50°C (scanning rate of 10 °C.min-1). Quenched samples were obtained by cooling the sample from 50°C down to -150°C at the fastest speed achieved with this DSC furnace, which was varying from -60 °C.min-1 around room temperature to -20 °C.min-1 on approaching the lowest temperature limit -150°C.
Journal Pre-proof
3.
RESULTS AND DISCUSSION
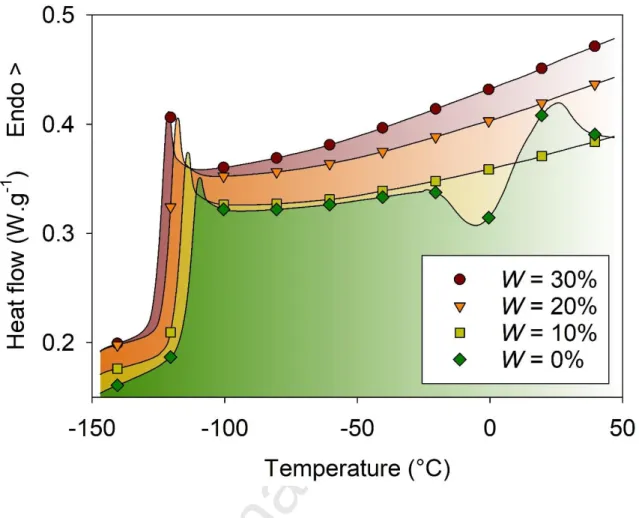
For the smallest values of the water mass fractions W=0-30%, no obvious crystallization was observed when cycling the solution in the temperature range from -150°C to 50°C at 10 °C.min-1 except for a small exothermic peak at -25°C on heating the pure DES. For all samples, the occurrence of a glass transition was indicated by a jump of the heat capacity, as shown in Fig. 1. The value of Tg decreases gradually from -116 to -125°C when the water fraction increases. This indicates an acceleration of the structural relaxation associated to the glassy dynamics. Obviously, the addition of water reduces the viscosity of the DES solution, as observed for other aqueous solutions [22]. This plasticizing effect may arise from the enhancement of the mobility of the solute molecules, when they are surrendered by the more dynamic and smaller sized water molecules. Additional effects could also be invoked, such as the reduction of the electrostatic interactions between ionic species as well as a disruption of the H-bond interactions within the DES supramolecular structures.
Journal Pre-proof
Figure 1. Thermograms measured during heating from -150°C to 50°C at 10 °C.min-1 after a preceding cooling ramp at the same rate, for the smallest values of the water mass fraction in aqueous solutions of Ethaline (2:1) DES mixtures, W=0, 10, 20, 30%. The signature of the glass transition of the whole solution is indicated by a jump of the heat capacity at Tg.
For intermediate values of the water mass fractions W=40% and 50%, different behaviors were observed depending on the cooling rate. The phenomenon is illustrated for W=50% in Fig. 2 and is discussed hereafter. For a moderate rate of 10°C.min-1, the solution crystallized during cooling, as indicated by the exothermic signal around Tc=-56°C. However, crystallization could be avoided if a faster cooling rate of about 60°C.min-1 was applied. In the latter case, the entire
Journal Pre-proof
solution was obviously quenched in a vitreous state. Both vitreous and crystallized solutions were subsequently heated up from -150°C to 30°C following the same heating ramp of 10°C.min-1. The quenched solution presented a glass transition at Tg, followed by a crystallization as indicated by an exothermic peak at about -120°C in Fig. 2. On further heating, the thermogram presented a very broad endothermic peak, which extended from Tm’=-96°C to
Tm=-31°C. Differently, the solution, which was allowed to crystallize during a slower cooling
ramp only presented a glass transition and a broad melting peak, without any additional crystallization on heating. Moreover, the glass transition temperature Tg’ was significantly higher than Tg, which implies that after crystallization occurred, the remaining unfrozen solution had a different composition from the whole initial solution. In both cases however, the broad melting peak was comparable in shape and intensity, which suggests that the crystallization occurring on slow cooling or the cold crystallization on heating after a thermal quench eventually led to a comparable fraction of ice and composition of the remaining liquid solution.
A similar behavior was also observed for W=40% (not shown), which also allowed studying the glass transition of a fully vitrified solution Tg and a mixture of glassy solution coexisting with ice Tg’ as well. Apart from the slightly different values of the temperatures of transitions, some differences in the thermal behavior were also observed with respect to W=50%. Indeed, on slow cooling at 10°C.min-1 crystallization did not occur, but rather during the subsequent heating above Tg (at Tc=77°C). Once crystallization was observed, the sample was cycled back to -150°C in order to later study Tg’ during a second heating branch at 10°C.min-1.
Journal Pre-proof
Figure 2. Thermograms measured for aqueous solution of Ethaline (2:1) DES mixture W=50%.
Heat flux measured on cooling from 30°C to -150°C at 10 °C.min-1 (medium dash). Heat flux measured on heating from 30°C to -150°C at 10 °C.min-1 after a thermal quench (solid line) and after a slow cooling at the same rate (short dash). The glass transition of the whole quenched solution is indicated by a jump at Tg, while the glass transition of the freeze-concentrated solution stands at Tg’.
Finally, a third behavior was observed for the largest values of the water mass fraction W=60, 70, 80, 87%, as shown in Fig. 3. In this case, crystallization could not be avoided even when applying thermal quench. The thermograms measured during heating present a glass transition at
Journal Pre-proof
about the same temperature Tg’ = -123°C and a broad endothermic peak, which intensity increased with the amount of water. The ice melting process associated to this broad peak was always initiated at about the same temperature Tm’=-95 ± 2°C for all the water compositions where crystallization occurred (i.e. W=40-87%), while the final melting occurred at temperatures increasing from Tm=-49°C to -3°C when W increased.
Figure 3. Thermograms measured during heating from -150°C to 30°C at 10 °C.min-1 after a preceding cooling ramp at the same rate, for the largest values of the water mass fraction in aqueous solutions of Ethaline (2:1) DES mixtures, W=60, 70, 80, 87%. The glass transition of
Journal Pre-proof
the freeze-concentrated solution is indicated by a jump at Tg’ (cf. magnified view in inset), while the melting of the frozen ice appears as a broad endothermic peak that extends from Tm’ to Tm.
In order to better characterize the nature of the unfrozen phase that co-exist with ice, we applied two methods. First, we calculated the melting enthalpy ( ) by integration of the melting peak on a temperature range encompassing the region from Tm’ to Tm, as a function of the composition W. A linear variation was observed, as presented in Fig. 4(a) where the melting enthalpy was normalized with respect to its value for W=100%, i.e. ( ) ( )
( ).
Assuming that the melting enthalpy of ice is not affected by the coexistence with the unfreezable DES solution and neglecting the melting point depression effects, ( ) can be considered as a measure of the mass fraction of frozen water. By extrapolation of ( ) to vanishing values, we could concluded that the formation of ice was incomplete and that the unfreezable water content in the DES solution was Wg’ = 30%.
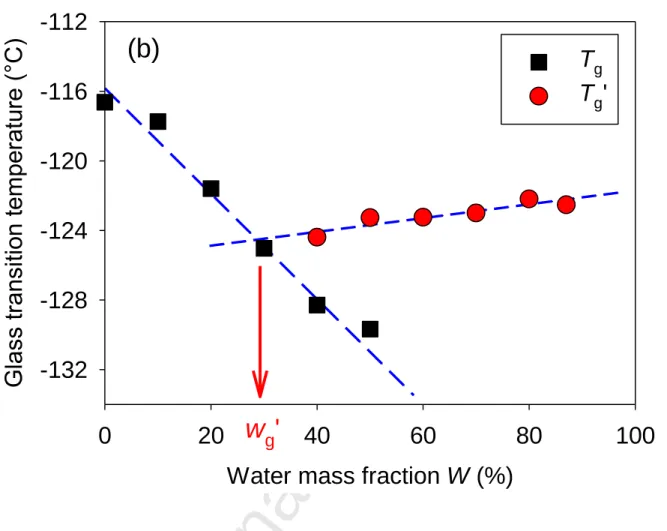
The second approach is presented in Fig. 4(b), where the glass transition temperature of the whole aqueous solution (Tg) or only the unfrozen part coexisting with ice (Tg’) is plotted as a function of the water content W. We observed that the glass transition temperature of the solution readily decreased from Tg = -116.6°C to -129.7°C for increasing values of water (W= 0-50%). This systematic acceleration of the relaxation dynamics of the DES with the addition of water was already discussed in the previous part. At variance, once ice had crystallized, the glass transition temperature of the unfrozen solution (Tg’) presented a much weaker dependence, slightly increasing from Tg’ = -124.4°C to -122.5°C for increasing values of water (W= 40-90%). This indicates that after the crystallization of ice, it remains an unfrozen glassforming aqueous solution of DES with an almost fixed composition. The latter could be estimated by using the
Journal Pre-proof
measured characteristic dependence of Tg with W as a calibration curve, and determining the unfrozen water content as the composition where Tg is equal to Tg’. In order to account for the minor variation of Tg’, we applied a linear extrapolated, as presented in Fig. 4(b). This second independent method gave a same determination of the water composition of the unfrozen solution Wg’ = 30%.
Journal Pre-proof
Water mass fraction W (%)
0
20
40
60
80
100
No
rm
a
liz
e
d
M
e
lt
in
g
e
n
th
a
lp
y
0.0
0.2
0.4
0.6
0.8
1.0
Fr
o
z
e
n
W
a
te
r Fr
a
ct
io
n
Unfrozen Water
w
g'
(a)
Journal Pre-proof
Journal Pre-proof
Figure 4. Water mass fraction in aqueous solutions of Ethaline (2:1) DES mixtures as a function
of (a) the normalized melting enthalpy of the freezable water and (b) the glass transition of the unfrozen solution Tg in the absence of ice (squares) and Tg’ when coexisting with ice (circle). For W=40 and 50%, Tg corresponds to the fully vitrified solution, which is metastable with respect to
the case when ice coexists with a more concentrated glassy solution (Tg’).
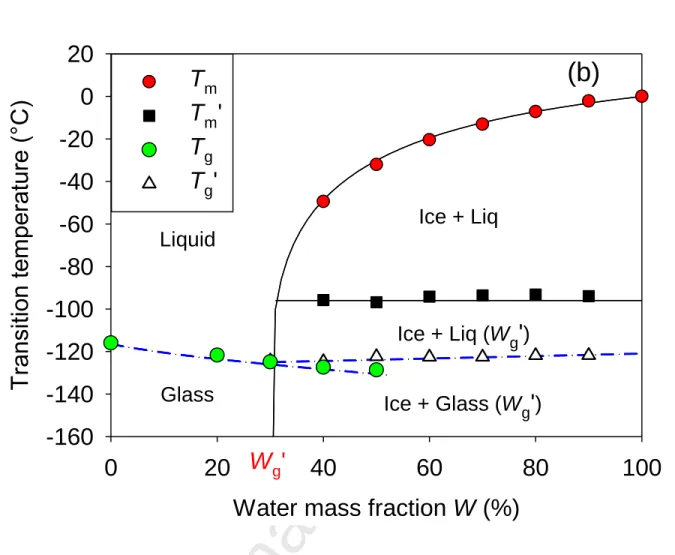
The resulting phase behaviors were determined as presented in Fig. 5(a) and 5(b). It should be stressed that the studied systems are actually a ternary mixture (Ethylene Glycol/Choline Chloride/Water), considering that the DES compound, which is classically named Ethaline in the
Water mass fraction W (%)
0
20
40
60
80
100
G
la
ss
tra
nsi
tio
n t
em
pe
ra
tu
re
(°
C
)
-132
-128
-124
-120
-116
-112
T
gT
g'
w
g'
(b)
Journal Pre-proof
Journal Pre-proof
literature, is already a binary liquid. With this important caution in mind, a pseudo-binary phase diagram could be determined along the line of constant Ethylene Glycol/Choline Chloride relative mole ratio. This representation is of most interest for practical use, when the water content is the main varying parameter in order to optimize the solvent properties or during industrial processing. It can be also argued that the absence of any phase separation or liquid-liquid transition, apart from ice crystallization, makes this representation particularly sensible and scientifically sound.
Water mass fraction W (%)
0
20
40
60
80
100
T
ra
nsi
tio
n t
em
pe
ra
tu
re
(°
C
)
-160
-140
-120
-100
-80
-60
-40
-20
0
20
T
mT
g'
T
gT
m'
Ice + Liq
Liquid
Ice + Liq (W
g')
Ice + Glass (W
g')
Glass
W
g'
(a)
Journal Pre-proof
Journal Pre-proof
Figure 5. Phase diagram of aqueous solutions of Ethaline DES mixtures as a function of the
water mass fraction W for two molar compositions of Ethaline (a) Ethylene Glycol/Choline Chloride in a 2:1 mole ratio and (b) Ethylene Glycol/Choline Chloride in a 3:1 mole ratio.
Water mass fraction W (%)
0
20
40
60
80
100
T
ra
nsi
tio
n t
em
pe
ra
tu
re
(°
C
)
-160
-140
-120
-100
-80
-60
-40
-20
0
20
T
m'
T
mT
g'
T
gIce + Liq
Liquid
Ice + Liq (W
g'
)
Ice + Glass (W
g'
)
Glass
(b)
W
g'
Journal Pre-proof
Journal Pre-proof
Water mole fraction x
0.0
0.2
0.4
0.6
0.8
1.0
T
ra
nsi
tio
n t
em
pe
ra
tu
re
(°C
)
-160
-140
-120
-100
-80
-60
-40
-20
0
20
T
m'
T
g'
T
gT
mIce + Liq
Liquid
Ice + Liq (x
g')
Ice + Glass (x
g')
Glass
x
g'
(a)
Journal Pre-proof
Journal Pre-proof
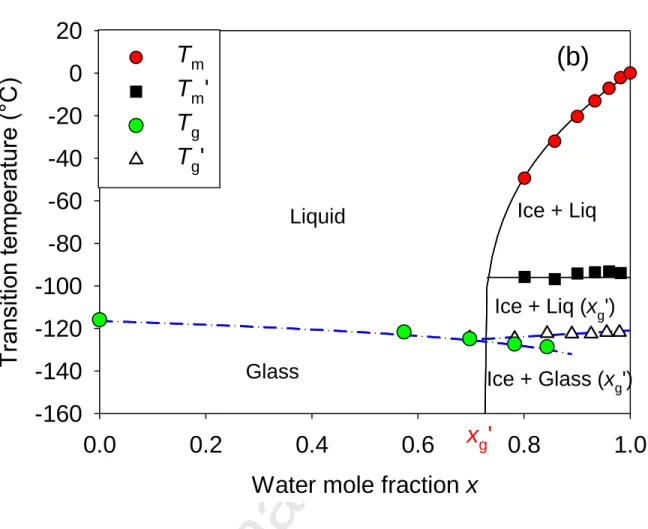
Figure 6. Phase diagram of aqueous solutions of Ethaline DES mixtures as a function of the
water mole fraction x for two molar compositions of Ethaline (a) Ethylene Glycol/Choline Chloride in a 2:1 mole ratio and (b) Ethylene Glycol/Choline Chloride in a 3:1 mole ratio.
The phase diagrams corresponding to the two studied Ethaline compositions, comprising Ethylene Glycol/Choline Chloride in a 2:1 and 3:1 mole ratio, are presented in Fig. 5(a) and 5(b), respectively. It should be stressed however that they do not differ significantly. Hence, the same discussion and conclusions hold for both systems. To understand the stoichiometric proportions that may be driving the molecular level interactions, the phase diagrams as a function of the
Water mole fraction x
0.0
0.2
0.4
0.6
0.8
1.0
T
ra
nsi
tio
n t
em
pe
ra
tu
re
(°C
)
-160
-140
-120
-100
-80
-60
-40
-20
0
20
T
m'
T
g'
T
gT
mIce + Liq
Liquid
Ice + Liq (x
g')
Ice + Glass (x
g')
Glass
x
g'
(b)
Journal Pre-proof
Journal Pre-proof
water mole fraction x are also represented in Fig. 6(a) and 6(b). The variation of the melting transition with the composition W (40-90%), could be compared to the behavior usually observed for binary systems that exhibit an eutectic point, where the later determines the fixed temperature TE at which melting starts. Obviously, this scenario does not apply in the present situation, since no crystallization was observed in the DES-rich region (W=0-30%). Moreover, the observation of a glass transition at Tg’ for W=40-90% indicates that, apart from ice, the remaining solution did not crystallize.
Interestingly, the observed phenomenon is in perfect qualitative agreement with the thermal behavior of solute/water binary solutions comprising amorphous cryoprotectants (including polyols, carbohydrates, polymers and proteins). [22-26]. However, it has been hardly addressed for DES in the literature [27]. According to the numerous studies on their phase diagrams, the crystallization of water to ice induces a residual liquid phase, which composition is enriched in solutes. As such, it is denoted the maximally freeze-concentrated solution. Interestingly, its water composition is barely dependent on the initial composition of the solution and for the present system it corresponds to a water mass fraction Wg’=30%. It is therefore straightforward that for W > Wg’, provided that ice crystallization occurred, this composition determined the value of its glass transition Tg’ and fixed the chemical potential of the solution, and so the temperature Tm’ corresponding to the onset of ice melting [28].
The water molar fraction of the maximally freeze-concentrated solution can be calculated from the mass fraction Wg’=30%. The ternary composition of the maximally freeze concentrated solution are Water/Ethylene Glycol/Choline Chloride (6:2:1) and (10:3:1) for the two studied ethaline aqueous solutions, and later referred as ethaline(2:1)-6w and ethaline(3:1)-10w.
Journal Pre-proof
This study raises questions about the mechanisms that control the composition of the maximally freeze concentrated DES solution. From a thermodynamic or structural point of view, it may be considered that the unfrozen water molecules retained in the DES system during ice formation are involved in the formation of stable structures. Recent Brillouin studies have indicated the existence of a crossover in the sound propagation velocity in different DES for an aqueous dilution around W=30% [17, 18]. Along with NMR data, this result has been interpreted as the transitioning of the liquid structure from a H2O-based to a DES-based H-bonded network. FTIR and NMR studies of choline chloride/glycol water solutions have also indicated that the interactions between DES components were initially maintained during water addition, and weaken gradually up to W=50% [29]. For water-reline (reline being the DES mixture formed with choline chloride and urea) both neutron scattering experiments and simulated X-ray scattering structure functions demonstrated that the DES structure was qualitatively retained up to the hydration value of W=41% (i.e. reline-10w) [1, 15]. Up to this composition, it appeared that water molecules are systematically involved in the solvation of choline ions, and higher level of water are needed to induce the transition from water-in-DES to aqueous solution of DES components. The formation of strong water-DES interaction was further supported by a FTIR and Raman vibrational spectroscopy study of water-glyceline (glyceline being the DES mixture formed with choline chloride and glycerol), which indicated that a maximum association is reached for 0.9 mole fraction of water/DES (i.e. glyceline-9w) [19].
In the frame of the present study, it is of special interest to notice that the ongoing crystallization of ice that occurs during cooling of a DES aqueous solution gradually increases the solute concentration of the co-existing liquid phase. Starting from an initially dilute range (eg. W >50%), the aqueous DES solution evolves from the “DES-in-water” to “water-in-DES” situation,
Journal Pre-proof
according to the designation introduced by ref. [18]. This transformation is eventually arrested when Wg’=30% (i.e. 6w to 10w), which is precisely in the range where the structural transitions have been observed in water-DES mixtures. It is therefore likely that the water molecules remaining in the maximally freeze-concentrated DES solution are actually sequestrated in a structure, which is dominated by the DES interactions and stops further water crystallization.
However, it does not imply that the phenomenon is fully driven by thermodynamics. If so, it would mean that the chemical potential of the entrapped water molecules at Wg’, which participate in the hydration of DES compounds and most likely to the solvation of choline cations, is equal to that of ice even at the lowest studied temperature [1]. Studies of maximally freeze-concentrated solution of alcohols, carbohydrates and biological materials of interest for cryobiological, pharmaceutical or food applications have emphasized the importance of dynamical effects and metastability [23-26, 28]. In fact, the formation of ice increases the solute concentration of the unfrozen phase. According to the liquidus line, it implies that the temperature of the system should be further decreased in order to enlarge the fraction of ice formed. However the lowering of the temperature and the increase in the solute concentration concomitantly raises the viscosity of the unfrozen part. Therefore, ice formation becomes extremely slow on approaching Tm’ as the viscosity reaches the typical value of 107 Pa.s, and it is completely stopped in the glassy state at temperature below Tg’. For water-ethaline aqueous solution, we determined that the region of maximally freeze-concentrated solution extends on a temperature range of 27°C between Tm’ and Tg’. This is larger than reported for most commonly studied polyols and carbohydrates for freeze-drying application, which are rather in the range 5 to 15 °C [23]. Although standing beyond the scope of the present article, a possible interpretation of the broader range between Tm’ and Tg’ is related to the specific nature of DES, which is a
Journal Pre-proof
multicomponent system comprising strong interactions (ionic, H-bonds) and favored structures, such as solvated units discussed before that further reduces the crystallization dynamics. Whenever the water mobility is fast enough, it is also likely that the remaining water involved in the solvated units is sufficiently much distorted from bulk water, due to interactions with the DES molecules that it will be unable to crystallize.
Because of this tendency to form strong H-bonds, it would be of great interest to further study how they distort the water network and participate to the solvation shell of active pharmaceutical agents and biomolecules, which commonly are considered as interesting features of bioprotectant agents [30, 31]. Furthermore, one might speculate that controlling the stability of the maximally freeze concentrated solution on an extended temperature could reduce the risks of devitrification and cold crystallization in a temperature range near and above Tg’, the occurrence of which is usually deleterious to the stability of solvated proteins and is considered as a critical parameter for the design of optimal freeze-drying processes for cryopreservation [32, 33]. Finally, it is worth mentioning the proximity of Tg’= -124°C is significantly lower than for usual freeze-concentrated and freeze-dried materials, which can be associated to the low value of Tg of the pure DES itself [23, 34]. As a result, it also lies close to the temperature (Tgwater=-137°C), which has been considered as the glass transition temperature of pure water, although the exact location of the liquid-to-glass transition of bulk water has be questioned recently and it is still the matter of exciting discussion [35].
CONCLUSIONS
Journal Pre-proof
The phase behavior of aqueous solutions of the deep eutectic solvent ethaline was studied by calorimetry from -150 to 50°C. The fraction of water was varied extensively W=0-90% from composition where the DES structure dominates to the diluted regime of aqueous dispersion of the DES components. The former case is characterized by the absence of crystallization and the formation of a glassy DES solution on cooling. In this case, water acts as a plasticizer but the phase behavior of the pure DES is retained. The latter case is characterized by the crystallization of ice, which phase separates from a maximally freeze-concentrated DES solution. In this situation, whatever the initial composition is, the composition of the unfrozen liquid is constant Wg’=30%, which corresponds to the ternary compositions Water/Ethylene Glycol/Choline Chloride (6:2:1) and (10:3:1) for the two studied systems, also referred as ethaline(2:1)-6w and ethaline(3:1)-10w. Interestingly, this phenomenon drives the transition of the DES aqueous mixture from the “DES-in-water” to “water-in-DES” regime. We infer that the value of the maximally freeze-concentration, which lies in the region where a cross-over in the structure of DES was reported for many systems, is determined by the extreme slowdown of ice formation as the viscosity of the unfrozen solution increases on approaching the glass transition of the maximally freeze-concentrated DES solution Tg’= -124°C as well as strong interactions between the remaining water molecules and the solvated DES units.
The formation of maximally freeze-concentrated solution has been extensively studied for polyols, proteins and carbohydrates, which are relevant to cryobiology and freeze-drying processes but similar studies on DES are scarce in the literature. Beyond the fundamental interest of a better understanding of the low-temperature behavior of hydrated DES, we hope that this study could also be helpful for developing innovative processes based on the freeze-drying of DES solutions for materials design, cryoprotectant and pharmaceutic applications.
Journal Pre-proof
ACKNOWLEDGMENTS
Support from Rennes Metropole and Europe (FEDER Fund – CPER PRINT2TAN), and the ANR (Project NanoLiquids N° ANR-18-CE92-0011-01) is expressly acknowledged. This work is part of the PhD thesis of A.J. who benefits from a grant from the French Ministry of Higher Education, Research, and Innovation. The authors are grateful to the CNRS – network SolVATE (GDR 2035) for financial support and fruitful discussions.
REFERENCES
1. Hammond, O.; Bowron, D.; Edler, K., The Effect of Water upon Deep Eutectic Solvent Nanostructure: An Unusual Transition from Ionic Mixture to Aqueous Solution. Angewandte Chemie-International Edition 2017, 56 (33), 9782-9785.
2. Hammond, O.; Bowron, D.; Jackson, A.; Arnold, T.; Sanchez-Fernandez, A.; Tsapatsaris, N.; Sakai, V.; Edler, K., Resilience of Malic Acid Natural Deep Eutectic Solvent Nanostructure to Solidification and Hydration. Journal of Physical Chemistry B 2017, 121 (31), 7473-7483.
3. Zhang, Q.; Vigier, K.; Royer, S.; Jerome, F., Deep eutectic solvents: syntheses, properties and applications. Chemical Society Reviews 2012, 41 (21), 7108-7146.
4. Smith, E.; Abbott, A.; Ryder, K., Deep Eutectic Solvents (DESs) and Their Applications. Chemical Reviews 2014, 114 (21), 11060-11082.
Journal Pre-proof
5. Ge, X.; Gu, C.; Wang, X.; Tu, J., Deep eutectic solvents (DESs)-derived advanced functional materials for energy and environmental applications: challenges, opportunities, and future vision. Journal of Materials Chemistry a 2017, 5 (18), 8209-8229.
6. Abbott, A.; Capper, G.; Davies, D.; Rasheed, R.; Tambyrajah, V., Novel solvent properties of choline chloride/urea mixtures. Chemical Communications 2003, (1), 70-71. 7. Abbott, A.; Boothby, D.; Capper, G.; Davies, D.; Rasheed, R., Deep eutectic solvents formed between choline chloride and carboxylic acids: Versatile alternatives to ionic liquids. Journal of the American Chemical Society 2004, 126 (29), 9142-9147.
8. Kollau, L.; Vis, M.; van den Bruinhorst, A.; Esteves, A.; Tuinier, R., Quantification of the liquid window of deep eutectic solvents. Chemical Communications 2018, 54 (95), 13351-13354.
9. Martins, M.; Pinho, S.; Coutinho, J., Insights into the Nature of Eutectic and Deep Eutectic Mixtures. Journal of Solution Chemistry 2019, 48 (7), 962-982.
10. Dai, Y.; Witkamp, G.; Verpoorte, R.; Choi, Y., Tailoring properties of natural deep eutectic solvents with water to facilitate their applications. Food Chemistry 2015, 187, 14-19. 11. Passos, H.; Tavares, D.; Ferreira, A.; Freire, M.; Coutinho, J., Are Aqueous Biphasic Systems Composed of Deep Eutectic Solvents Ternary or Quaternary Systems? Acs Sustainable Chemistry & Engineering 2016, 4 (5), 2881-2886.
12. Yadav, A.; Trivedi, S.; Rai, R.; Pandey, S., Densities and dynamic viscosities of
(choline chloride plus glycerol) deep eutectic solvent and its aqueous mixtures in the temperature range (283.15-363.15) K. Fluid Phase Equilibria 2014, 367, 135-142.
Journal Pre-proof
13. Meng, X.; Ballerat-Busserolles, K.; Husson, P.; Andanson, J., Impact of water on the melting temperature of urea plus choline chloride deep eutectic solvent. New Journal of Chemistry 2016, 40 (5), 4492-4499.
14. Ma, C.; Laaksonen, A.; Liu, C.; Lu, X.; Ji, X., The peculiar effect of water on ionic liquids and deep eutectic solvents. Chemical Society Reviews 2018, 47 (23), 8685-8720.
15. Kumari, P.; Shobhna; Kaur, S.; Kashyap, H., Influence of Hydration on the Structure of Reline Deep Eutectic Solvent: A Molecular Dynamics Study. Acs Omega 2018, 3 (11), 15246-15255.
16. Lapena, D.; Lomba, L.; Artal, M.; Lafuente, C.; Giner, B., Thermophysical characterization of the deep eutectic solvent choline chloride:ethylene glycol and one of its mixtures with water. Fluid Phase Equilibria 2019, 492, 1-9.
17. Posada, E.; Roldan-Ruiz, M.; Rioboo, R.; Gutierrez, M.; Ferrer, M.; del Monte, F., Nanophase separation in aqueous dilutions of a ternary DES as revealed by Brillouin and NMR spectroscopy. Journal of Molecular Liquids 2019, 276, 196-203.
18. Roldan-Ruiz, M.; Jimenez-Rioboo, R.; Gutierrez, M.; Ferrer, M.; del Monte, F., Brillouin and NMR spectroscopic studies of aqueous dilutions of malicine: Determining the dilution range for transition from a "water-in-DES" system to a "DES-in-water" one. Journal of Molecular Liquids 2019, 284, 175-181.
19. Ahmadi, R.; Hemmateenejad, B.; Safavi, A.; Shojaeifard, Z.; Shahsavar, A.; Mohajeri, A.; Dokoohaki, M. H.; Zolghadr, A. R., Deep eutectic-water binary solvent associations
investigated by vibrational spectroscopy and chemometrics. Physical Chemistry Chemical Physics 2018, 20 (27), 18463-18473.
Journal Pre-proof
20. Shahbaz, K.; Mjalli Farouq, S.; Hashim, M.; ALNashef, I. M., Using Deep Eutectic Solvents for the Removal of Glycerol from Palm Oil-Based Biodiesel. Journal of Applied Sciences 2010, 10, 3349-3354.
21. Lopez-Porfiri, P.; Brennecke, J.; Gonzalez-Miquel, M., Excess Molar Enthalpies of Deep Eutectic Solvents (DESs) Composed of Quaternary Ammonium Salts and Glycerol or Ethylene Glycol. Journal of Chemical and Engineering Data 2016, 61 (12), 4245-4251.
22. Elamin, K.; Sjostrom, J.; Jansson, H.; Swenson, J., Calorimetric and relaxation properties of xylitol-water mixtures. Journal of Chemical Physics 2012, 136 (10).
23. Roos, Y. H., Frozen state transitions in relation to freeze drying. Journal of Thermal Analysis 1997, 48 (3), 535-544.
24. Jahn, D. A.; Wong, J.; Bachler, J.; Loerting, T.; Giovambattista, N., Glass
polymorphism in glycerol-water mixtures: I. A computer simulation study. Physical Chemistry Chemical Physics 2016, 18 (16), 11042-11057.
25. Bachler, J.; Fuentes-Landete, V.; Jahn, D. A.; Wong, J.; Giovambattista, N.; Loerting, T., Glass polymorphism in glycerol-water mixtures: II. Experimental studies. Physical Chemistry Chemical Physics 2016, 18 (16), 11058-11068.
26. Weng, L. D.; Li, W. Z.; Zuo, J. G., Two applications of the thermogram of the
alcohol/water binary system with compositions of cryobiological interests. Cryobiology 2011, 62 (3), 210-217.
27. Gutierrez, M. C.; Ferrer, M. L.; Mateo, C. R.; del Monte, F., Freeze-Drying of Aqueous Solutions of Deep Eutectic Solvents: A Suitable Approach to Deep Eutectic Suspensions of Self-Assembled Structures. Langmuir 2009, 25 (10), 5509-5515.
Journal Pre-proof
28. Schawe, J., A quantitative DSC analysis of the metastable phase behavior of the sucrose-water system. Thermochimica Acta 2006, 451 (1-2), 115-125.
29. Gabriele, F.; Chiarini, M.; Germani, R.; Tiecco, M.; Spreti, N., Effect of water addition on choline chloride/glycol deep eutectic solvents: Characterization of their structural and
physicochemical properties. Journal of Molecular Liquids 2019, 291.
30. Arakawa, T.; Timasheff, S., Stabilization of protein-structure by sugars. Biochemistry 1982, 21 (25), 6536-6544.
31. Hedoux, A.; Willart, J.; Ionov, R.; Affouard, F.; Guinet, Y.; Paccou, L.; Lerbret, A.; Descamps, M., Analysis of sugar bioprotective mechanisms on the thermal denaturation of lysozyme from Raman scattering and differential scanning calorimetry investigations. Journal of Physical Chemistry B 2006, 110 (45), 22886-22893.
32. Fahy, G.; Macfarlane, D.; Angell, C., Vitrification as an approach to cryopreservation. Cryobiology 1983, 20 (6), 699-699.
33. Tang, X.; Pikal, M., Design of freeze-drying processes for pharmaceuticals: Practical advice. Pharmaceutical Research 2004, 21 (2), 191-200.
34. Debenedetti, P., Supercooled and glassy water. Journal of Physics-Condensed Matter 2003, 15 (45), R1669-R1726.
35. Swenson, J., Possible relations between supercooled and glassy confined water and amorphous bulk ice. Physical Chemistry Chemical Physics 2018, 20 (48), 30095-30103.
Journal Pre-proof
Author Statemen
Sample CRediT author statement
Thibaut Sohier: Investigation, Writing - Review & Editing Aicha Jani: Investigation, Writing - Review & Editing
Denis Morineau: Conceptualization, Investigation, Writing - Original Draft, Supervision, Funding acquisition
Journal Pre-proof
Declaration of interests☒ The authors declare that they have no known competing financial interests or personal relationships that could have appeared to influence the work reported in this paper.
☐The authors declare the following financial interests/personal relationships which may be considered as potential competing interests:
Journal Pre-proof
Highlights
The phase diagram of aqueous solutions of a Deep Eutectic Solvent is presented. For low hydration, Ethaline solutions form a glass, which is plasticized by water. For high hydration, Ice coexists with a maximally freeze-concentrated solution. The crossover composition stands at the “DES-in-water” to “water-in-DES” border. Ice freezing temperature depression and glassforming ability of DES are concomitant.