HAL Id: hal-01571966
https://hal-lara.archives-ouvertes.fr/hal-01571966
Submitted on 4 Aug 2017HAL is a multi-disciplinary open access
archive for the deposit and dissemination of
sci-L’archive ouverte pluridisciplinaire HAL, est destinée au dépôt et à la diffusion de documents
To cite this version:
Jennifer Zeitlin, Ashna Mohangoo. European perinatal Heath report. [Research Report] Institut national de la santé et de la recherche médicale(INSERM). 2008, 280 p., graphiques, tableaux, 44 références bibliographiques. �hal-01571966�
EUROPEAN PERINATAL HEALTH REPORT
by the EURO-PERISTAT project
in collaboration with
SCPE, EUROCAT & EURONEOSTAT
Data from 2004
EURO-PERISTAT Project, with SCPE, EUROCAT, EURONEOSTAT. European Perinatal Health Report. 2008. Available: www.europeristat.com
TABLE OF CONTENTS
Abbreviations and acronyms 8
1
EXECUTIVE SUMMARY: HEALTH AND CARE OF PREGNANT WOMEN AND BABIES IN EUROPE
9
2
SURVEILLANCE OF PERINATAL HEALTH IN EUROPE
17
2.1 Why monitor perinatal health in Europe? 18
2.2 Perinatal health indicators for Europe: The EURO-PERISTAT project 19
2.3 Other European perinatal health projects 21
2.4 Conclusions: advantages of building information systems at the European level 23
3
DATA SOURCES FOR PERINATAL HEALTH MONITORING IN EUROPE
27
3.1 EURO-PERISTAT data collection 28
3.2 Data sources 28
3.3 Data availability 32
3.4 Questions complicating international comparisons 33
3.5 Conclusions and recommendations for improving health reporting 35
4
CHARACTERISTICS OF CHILDBEARING WOMEN
41
4.1 Multiple births 43
4.2 Maternal age 46
4.3 Parity 49
4.4 Smoking during pregnancy 51
4.5 Mother’s educational level 53
4.6 Mother’s country of origin 57
5
THE CARE OF WOMEN AND BABIES DURING PREGNANCY AND THE POSTPARTUM PERIOD
61
5.1 Mode of delivery 63
5.2 Pregnancies following infertility management 68
5.3 First antenatal visit 71
5.4 Mode of onset of labour 74
5.5 Place of birth 77
5.6 Breast feeding at birth 80
5.7 Very preterm births delivered in units without a NICU 83
5.8 Positive outcomes of pregnancy: birth without obstetric intervention 86
5.9 State of the perineum 89
6
MOTHERS' HEALTH: MORTALITY AND MORBIDITY ASSOCIATED WITH CHILDBEARING
93
6.1 Maternal mortality ratios 95
6.2 Causes of maternal death 101
7
BABIES’ HEALTH: MORTALITY AND MORBIDITY DURING PREGNANCY AND IN THE
FIRST YEAR OF LIFE
109
7.1 Fetal mortality rate 111
7.2 Neonatal mortality rate 117
7.3 Infant mortality rate 122
7.4 Birthweight distribution 125
7.5 Gestational age distribution 129
7.6 Five-minute Apgar score 133
7.7 Deaths due to congenital anomalies 136
8
CEREBRAL PALSY, SCPE NETWORK
141
8.1 Methods and achievements of the SCPE network 142
8.2 CP prevalence rates and EURO-PERISTAT perinatal indicators 146
8.3 Trends among children at higher risk of CP 153
8.4 Conclusion 159
9
CONGENITAL ANOMALIES: EUROCAT
163
9.1 Introduction 164
9.2 Epidemiologic surveillance of congenital anomalies 164
9.3 Population coverage by EUROCAT and EURO-PERISTAT 165
9.4 Prevalence of congenital anomalies in Europe 168
9.5 Termination of pregnancy for fetal anomaly 173
9.6 Fetal and neonatal mortality associated with congenital anomaly 175
9.7 Infant survivors 179
9.8 Data developments 179
9.9 The Future 179
10 VERY LOW BIRTHWEIGHT AND GESTATIONAL AGE BABIES IN EUROPE: EURONEOSTAT
183
10.1 Introduction 184
10.2 Data collection and analysis 186
10.3 Results 187
10.4 Health services provided to VLBW/VLGA newborn infants. 193
10.5 Comments 194
APPENDICES
APPENDIX A1: CONTRIBUTORS TO THE EURO-PERISTAT PROJECT
204
APPENDIX A2: CONTRIBUTORS FROM EUROCAT, SCPE, AND EURONEOSTAT
208
APPENDIX B: DATA TABLES ON EURO-PERISTAT CORE AND RECOMMENDED INDICATORS
211
APPENDIX C: DATA SOURCES FOR EURO-PERISTAT CORE AND RECOMMENDED INDICATORS
267
LIST OF APPENDIX TABLES
279
AUTHORS AND ACKNOWLEDGEMENTS
REPORT COORDINATORS
Jennifer Zeitlin (INSERM, France)
Ashna Mohangoo (TNO Quality of Life, the Netherlands).
WRITING COMMITTEE FOR CHAPTERS 1 TO 7
Sophie Alexander Henrique Barros Béatrice Blondel Marie-Hélène Bouvier-Colle Simone Buitendijk Christine Cans Sophia Correia Mika Gissler Alison Macfarlane* Ashna Mohangoo* Živa Novak-Antolic Jennifer Zeitlin* Wei Hong Zhang Meagan Zimbeck
* Editorial Supervision
AUTHORS OF CHAPTER 8 ON CEREBRAL PALSY AND SCPE
Christine Cans, Jenny Kurinczuk, Marie-Ange Mermet, Sylvie Rey, Geraldine Surman, Torstein Vik on behalf of the SCPE collaborative group (Appendix A2)
AUTHORS OF CHAPTER 9 ON CONGENITAL ANOMALIES AND EUROCAT
Helen Dolk, Maria Loane, Lorentz Irgens and a EUROCAT Working Group (Appendix A2).
AUTHORS OF CHAPTER 10 ON THE CARE AND OUTCOME OF VERY LOW BIRTH WEIGHT BABIES AND
EURONEOSTAT
Adolf Valls-i-Soler, José I Pijoán, Marina Cuttini, Javier de la Cruz, Carmen R Pallás, Michael Weindling, Henry L Halliday, Carlo Corchia, Mikko Hallman, Virgilio Carnielli, Olivier Claris, Helmut Hummler Diego Rada and Agueda Azpeitia, on behalf of the EuroNeoStat Consortium (Appendix A2).
EURO-PERISTAT STEERING COMMITTEE
Jennifer Zeitlin (Scientific Coordinator) Gérard Bréart (Project Leader)
Meagan Zimbeck (Project Coordinator) Sophie Alexander
Henrique Barros István Berbik
55
EURO-PERISTAT SCIENTIFIC COMMITTEE (CONTACT INFORMATION IN APPENDIX A1)
Austria: Christian Vutuc Belgium: Sophie Alexander Cyprus: Pavlos Pavlou Czech Republic: Petr Velebil Denmark: Jens Langhoff Roos Estonia: Luule Sakkeus Finland: Mika Gissler France: Béatrice Blondel
France: (SCPE leader) Christine Cans Germany: Nicholas Lack
Greece: Aris Antlaklis Hungary: István Berbik Ireland: Sheelagh Bonham Ireland: (SCPE partner) Pat Beirn Italy: Marina Cuttini
Latvia: Jautrite Karaskevica Lithuania: Aldona Gaizauskiene
Lithuania: (SCPE partner) Audrone Prasauskiene Luxembourg: Yolande Wagener
Malta: Miriam Gatt Netherlands: Jan Nijhuis Norway: Lorentz Irgens
Poland: Katarzyna Szamotulska Portugal: Henrique Barros Slovak Republic: Ján Cap Slovenia: Živa Novak-Antolic Spain: Francisco Bolúmar Sweden: Gunilla Lindmark
United Kingdom: Alison Macfarlane
DATA PROVIDERS AND OTHER CONTRIBUTORS (LISTED IN APPENDIX A1)
This report would not have been possible without the time and effort of data providers who produced data for this report and reviewed and commented on the tables and manuscript.
DATA COLLECTION
TNO Quality of Life in the Netherlands was responsible for data collection, management, and analysis.
Data analysis: Ashna Mohangoo
Data collection and management: Sabine Anthony, Ashna Mohangoo and Ab Rijpstra
PROJECT COORDINATION
The EURO-PERISTAT project was coordinated by Assistance Publique-Hôpitaux de Paris (AP-HP), Paris.
FINANCING
The EURO-PERISTAT project is cofinanced by the Public Health Programme of the European Commission's Directorate General of Public Health and Consumer Protection, which also provides funding for SCPE, EUROCAT, and EURONEOSTAT.
Editing support was provided by JoAnn Cahn. ˆ
LIST OF TABLES
Table 2.1 EURO-PERISTAT indicators (C=core, R=recommended, F=further development) 20
Table 3.1 Lower limits for registration of stillbirths and live births 40
Table 4.1 Estimates of proportion of women smoking during pregnancy in routine
data sources and according to period for which data are collected 53
Table 4.2 Data collected on mothers’ national origin and proportion of women with
live or stillbirths who were of foreign origin defined by country of birth
(or foreign nationality or ethnicity or lack of permanent residence status) 59
Table 5.1 Percentage of pregnant women by timing of first antenatal visit 73
Table 5.2 Existence of “level of care” classifications for maternity units and percent of
very preterm babies born in the most specialised units 83
Table 6.1 Maternal mortality ratio (numbers and ratios per 100 000 live births) in
2003-2004 98
Table 6.2 Maternal mortality ratios by mode of delivery. 100
Table 6.3 Distribution of maternal deaths according to obstetric causes (in %)
by country, in 2003-2004 103
Table 6.4 Severe maternal morbidity rates 107
Table 8.1 Live births in areas covered by SCPE network registries 146
Table 8.2 Specific neonatal mortality rate by BW group per 1000 live births, 1990-1998 147
Table 8.3 Multiple birth rates and percentages of very low and low birth weights
among multiple births 1990-1998 148
Table 8.4 Distribution of maternal age in birth years 1997-1998 149
Table 8.5 Distribution of births by size of maternity unit (recommended indicator) in
1997-1998 149
Table 8.6 Registries with data from SCPE database for 1990-1998 150
Table 8.7 Other registries and population based surveys with data on children with CP 150
Table 8.8 CP prevalence rates per 1000 live births by birthweight groups 151
Table 8.9 Prevalence rate of children with bilateral spastic CP subtype 152
Table 8.10 Associated impairments in children with CP born 1990-1998 153
Table 8.11 Description of SCPE data on children with cerebral palsy included in Platt et al. 153
Table 9.1 Coverage of the European population by EUROCAT registries and/or
EURO-PERISTAT data sources, 2004 165
Table 9.2 Prevalence per 1000 births of EUROCAT congenital anomaly
subgroups 2004, all EUROCAT full member registries combined 168
Table 9.3 Comparison of EURO-PERISTAT and EUROCAT livebirth and total
prevalence rates per 1000 births for anencephaly, spina bifida, cleft lip
and/or palate, and Down Syndrome, 2004 171
Table 9.4 Rate of terminations of pregnancy for fetal anomaly following
prenatal diagnosis (TOPFA) and perinatal deaths per 1000 births by
country, 2004, EUROCAT full member registries 174
Table 9.5 Perinatal mortality associated with congenital anomalies in EUROCAT
full member registries combined, 2004, by type of anomaly 176
Table 9.6 Fetal death, early neonatal, perinatal and neonatal mortality associated with
congenital anomalies per country, 2004, EUROCAT and EURO-PERISTAT data 178
LIST OF FIGURES
Figure 3.1 Percentage of countries providing core indicators 38
Figure 3.2 Percentage of countries providing recommended and further indicators 39
Figure 4.1 Multiple birth rates per 1000 women with live or stillbirths, by number of
fetuses 45
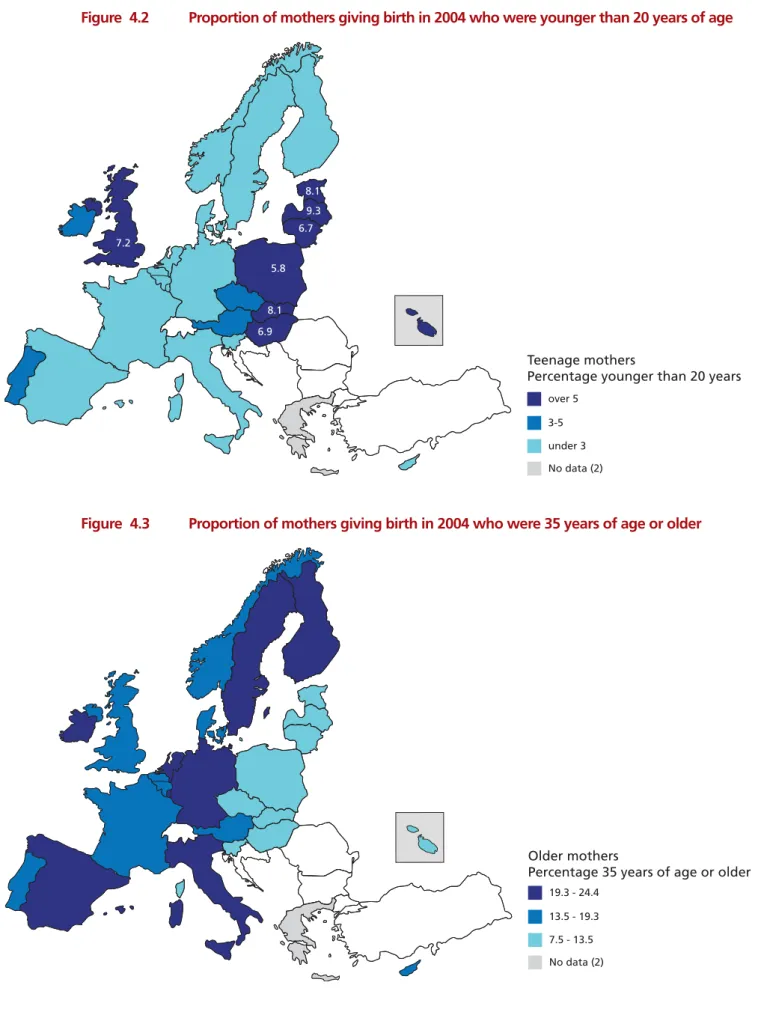
Figure 4.2 Proportion of mothers giving birth in 2004 who were younger than
20 years of age 48
Figure 4.3 Proportion of mothers giving birth in 2004 who were 35 years of age or older 48
Figure 4.4 Distribution of parity 50
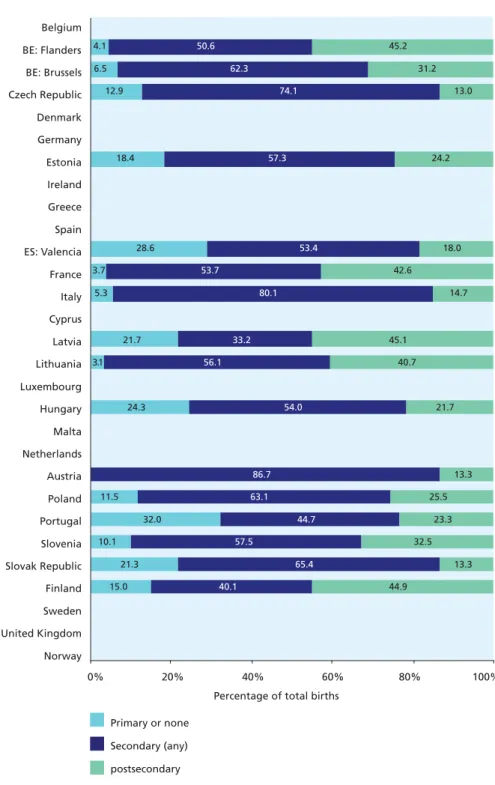
Figure 4.5 Distribution of mother's education 56
Figure 5.1 Percentage of births by mode of delivery 66
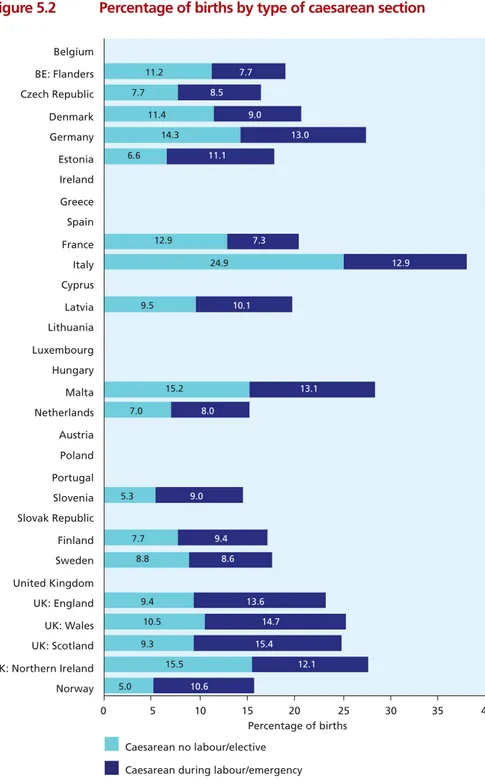
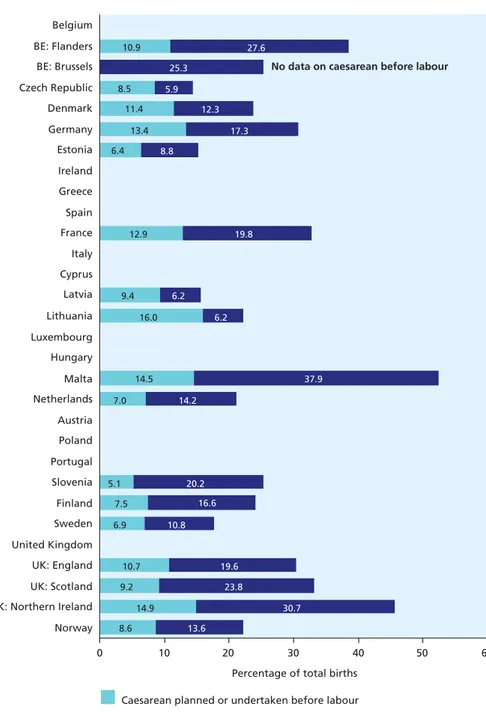
Figure 5.2 Percentage of births by type of caesarean section 67
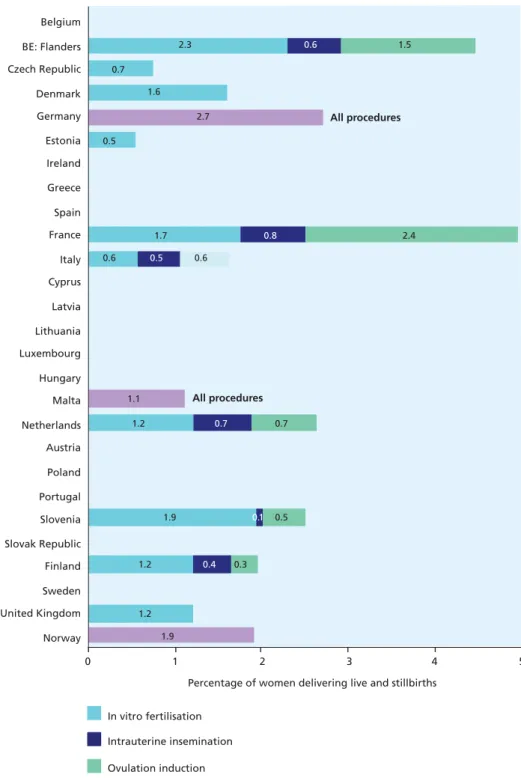
Figure 5.3 Percentage of women with live and stillbirths following assisted pregnancy
procedures 70
Figure 5.4 Inductions of labour and caesarean deliveries before labour 76
Figure 5.5 Percentage of births in maternity units with fewer than 500 deliveries
per year. 79
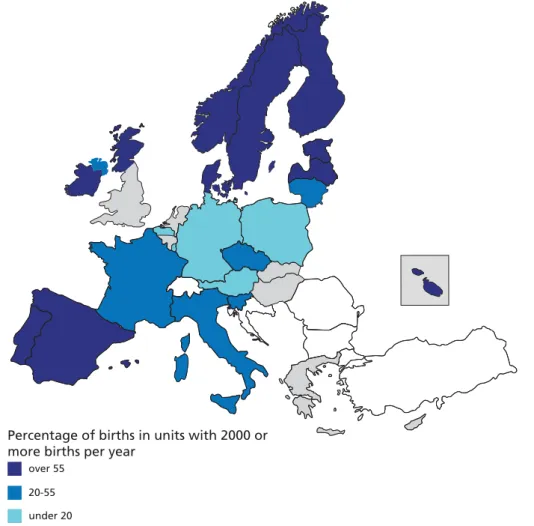
Figure 5.6 Percentage of births in maternity units with 2000 or more deliveries
per year 80
Figure 5.7 Distribution of exclusive and mixed breast feeding for the first 48 hours. 82
Figure 5.8 Births without obstetric intervention, options 2 and 3 88
Figure 5.9 Episiotomy rates 91
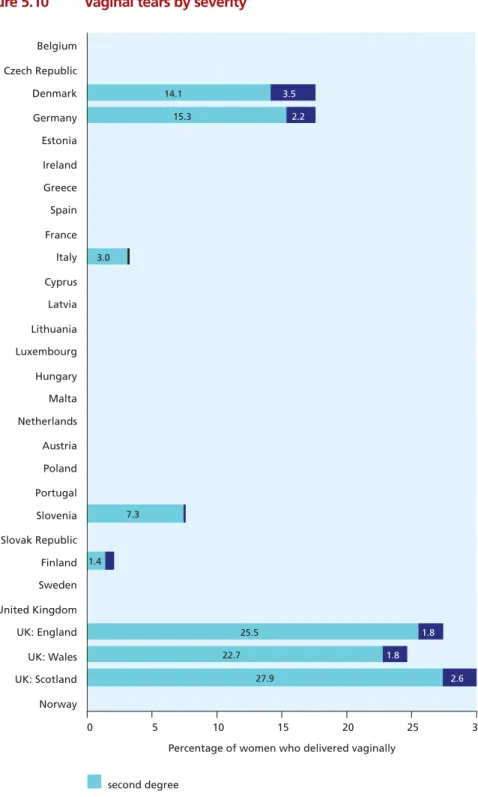
Figure 5.10 Vaginal tears by severity 92
Figure 6.1 Map of maternal mortality ratios in European Union member states 99
Figure 6.2 Maternal mortality ratios in Europe by maternal age 99
Figure 6.3 Profile of obstetric causes of maternal deaths by European countries 104
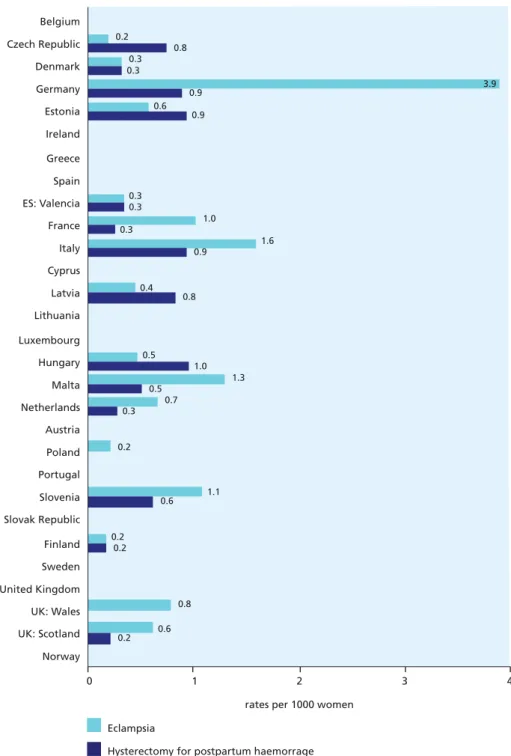
Figure 6.4 Maternal morbidity ratios for eclampsia and hysterectomy for postpartum
haemorrhage 108
Figure 7.1 Fetal mortality rate per 1000 total births 114
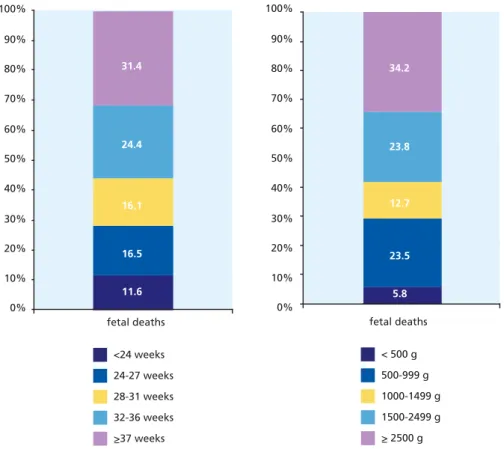
Figure 7.2 Percentage of fetal deaths by gestational age and birthweight group in
all countries contributing data 115
Figure 7.3 Fetal mortality rate per 1000 singleton and multiple births. 116
Figure 7.4 Early and late neonatal mortality per 1000 live births 119
Figure 7.5 Neonatal mortality rate (with and without neonatal deaths less than
500 grams) 120
Figure 7.6 Neonatal mortality rates per 1000 live singleton and multiple births 121
Figure 7.7 Infant mortality per 1000 live births 124
Figure 7.8 Birth weight under 1500 g and 1500-2499 g among live births 127
Figure 7.9 Low birth weight (<2500 g) among live births 128
Figure 7.10 Percentage of live births with a gestational age <32 weeks and
between 32-36 weeks 131
Figure 7.11 Preterm (before 37 weeks of gestation) live births in Europe in 2004 132
Figure 7.12 Percentage of live births with an Apgar score at 5 minutes less than 4 and
between 4 and 6 135
Figure 7.13 Percentage of early neonatal deaths due to congenital anomalies 138
Figure 7.14 Percentage of fetal deaths due to congenital anomalies 139
Figure 8.1 Live births before 32 weeks or with a birth weight under 1500 g 148
Figure 8.2 Birthweight distribution in children with CP 151
Figure 8.3 Distribution of children with CP by CP subtype 152
Figure 8.4 CP rates in VLBW children, 1000-1499 g and <1000 g in Platt et al 154
Figure 8.5 Prevalence of walking in all centers except C02, C03, C09, and C11,
children born 1976-1996. 155
Figure 8.6 Walking ability and CP subtypes - Children born 1976-1996 156
Figure 8.7 Prevalence of cerebral palsy by Z score of weight for gestation:
effect of different growth standards. 158
Figure 10.1 Standardised neonatal mortality rates (SNMR) by gestational age and
birth weight. 195
Figure 10.2 Variability of the rates of caesarean sections and prenatal corticosteroid
administration (complete and partial) 195
Figure 10.3 . Variability of the rates of endotracheal intubation, cardiac compression, epinephrine administration during resuscitation at birth and of surfactant
administration during the first hour of life 196
Figure 10.4 Variability of the rates of conventional ventilation and n-CPAP after
leaving the delivery room 196
Figure 10.5 Variability of the rates of pneumothorax and nosocomial infection 197
Figure 10.6 Variability of the rates of bronchopulmonary dysplasia and retinopathy
of prematurity 197
Figure 10.7 Variability of the rates of intraventricular haemorrhage and cystic
periventricular leukomalacia of prematurity 198
ABBREVIATIONS AND ACRONYMS
ART Assisted reproductive techniques
CLD Chronic lung disease
CMV Conventional mechanical ventilation
CP Cerebral palsy
ESPR European Society for Paediatric Research
EU European Union
ICD-10 International Classification of Diseases, 10th revision
ICU Intensive care unit
IVF In vitro fertilisation
IVH Intraventicular haemorrhage
MMR Maternity mortality ratio
n-CPAP Continuous positive airway pressure
NEC Necrotising enterocolitis
NICU Neonatal intensive care unit
NMR Neonatal mortality rate
PDA Symptomatic patent ductus arteriosus
PIVH Periventricular intraventricular haemorrhage
1
Health and care of pregnant women
and babies in Europe
1
EXECUTIVE SUMMARY: HEALTH AND CARE OF PREGNANT
WOMEN AND BABIES IN EUROPE
I. MONITORING PERINATAL HEALTH IN EUROPE
Promoting healthy pregnancy and safe childbirth is a goal of all European health care systems. Despite significant improvements in recent decades, mothers and their babies are still at risk during the perinatal period, which covers pregnancy, delivery, and the postpartum. Babies born too early are more likely to die than those born at term. They are also more likely to have neurological and developmental disorders that carry long-term consequences for their quality of life, their families, and for health and social services. The same is true for babies born with severe congenital
anomalies. Many of them have important medical, social, and educational needs. Stillbirths have not decreased to the same extent as neonatal deaths, and their causes remain largely unknown. Maternal deaths are rare but tragic events, particularly because a significant proportion of these deaths are associated with substandard care.
In recent years research has also found connections between perinatal health and chronic diseases of adulthood. Babies born too small as a consequence of fetal growth restriction are more likely than others to develop diabetes and metabolic syndrome as adults. Other implications for adult health of adverse events during pregnancy are currently being explored. These relations make the monitoring of perinatal health outcomes more important than ever.
To improve outcomes, we need the right tools to assess perinatal health problems and their causes. We also need to monitor the impact of policy initiatives over time. This report is a first step towards providing Europe with such a tool, based on indicators recommended by the EURO-PERISTAT project. It brings together for the first time statistical information on the characteristics, health, and health care of pregnant women and their newborn babies in 25 member states of the European Union and Norway.
This report also includes key data and analyses from three other European projects that monitor perinatal health: Surveillance of Cerebral Palsy in Europe (SCPE), European Surveillance of Congenital Anomalies (EUROCAT), and the European Information System to Monitor Short and Long-Term Morbidity to Improve Quality of Care and Patient Safety for Very-Low-Birth-Weight Infants (EURONEOSTAT). Good quality reporting on congenital anomalies and cerebral palsy
requires careful standardisation of diagnostic criteria and rigorous protocols for the identification of cases. Registries, most often at a regional level, are the best method for obtaining valid and
comparable data on these health problems. EUROCAT, which began epidemiological surveillance of congenital anomalies in 1979, now includes registries that cover over 30% of Europe’s births in 19 countries. SCPE, begun in 1998, brings together cerebral palsy registries in 16 European countries to provide analysis on a European level. EURONEOSTAT is a newer initiative to create a network of neonatal intensive care units within Europe and to provide hospital-based data on very low birthweight babies, weighing less than 1500 g.
the data sources used for perinatal health monitoring. We then report the results for each EURO-PERISTAT indicator in four separate chapters: characteristics of childbearing women, the care of women and babies during pregnancy and the postpartum period, fetal and infant health, and maternal health. We explain why each indicator is important for monitoring perinatal health as well as the methodological issues that should be kept in mind in interpreting them. Chapters 8, 9, and 10 describe the indicators and data from the three other participating projects. The second part presents appendices with detailed reference data tables on all of the EURO-PERISTAT indicators. Most but not all of these data relate to births in 2004. Because cerebral palsy is best diagnosed at the age of 4 or 5, the SCPE data covers births from previous years and also covers several years; because EURONEOSTAT is a relatively new project, its data relate mainly to 2006.
Some of the differences in the indicators arise from differences in definitions, data quality, coverage by data collection systems, and completeness of recording. In what follows, we have tried to allow for these, but care should be taken in drawing conclusions from the differences observed. In addition, some of the indicators describe relatively rare events and are thus based on a small number of cases, especially in smaller countries. We have not made any formal attempt to test differences statistically. In most cases, the data needed for statistical comparisons are presented in the tables in the appendices for use by readers.
Key findings in this report and its recommendations for improving health reporting in the future are summarised below.
II. HIGHLIGHTS OF HEALTH AND HEALTH CARE IN EUROPE IN 2004
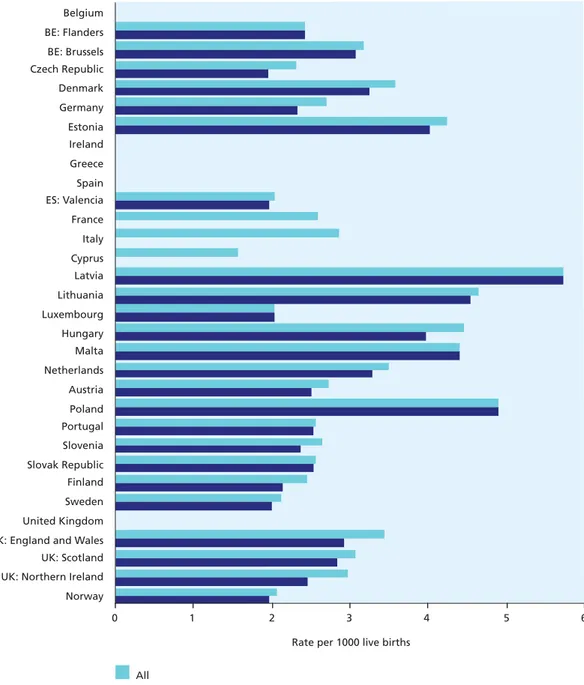
Fetal and neonatal mortality rates differ widely between European countries.
With a standardised definition including all births of at least 28 completed weeks of gestation, the fetal mortality rate in 2004 ranged from around 2.0 per 1000 births in the Slovak Republic and Finland to 4.9 in Latvia and France. The Netherlands and Scotland also had rates of over 4.0 per 1000, while Flanders (Belgium), Germany, Spain, Luxembourg, Austria, the Czech Republic, and Norway had rates under 3.0. When all stillbirths at 22 or more completed weeks of gestation were included, the range was much wider, from 2.6 to 9.1 per 1000 total births, but some of this variation was clearly due to differences in criteria for including fetal deaths in routine data collection systems and in completeness of ascertainment.
Neonatal mortality, that is, the rate of deaths from 0 to 27 days after live birth, ranged from around 2 per 1000 live births in Cyprus, Sweden, and Norway to 4.6 in Lithuania and 5.7 in Latvia. Countries with neonatal mortality rates over 4.0 per 1000 included Estonia, Hungary, Malta, and Poland. A majority of the European countries had rates under 3.5 per 1000, lower than those in other industrialised countries. For example, for 2004 the OECD Health Database reports a rate of 4.5 per 1000 live births in the USA, 4.0 in Canada, and 3.5 in Australia.
Differences in legislation and practices about pregnancy termination contribute to some of the observed variation in fetal and neonatal mortality.
The percentage of neonatal deaths attributed to congenital anomalies ranged from 20 to 40. This percentage was higher in Malta and Ireland, where terminations are illegal, than in other countries. Malta and Ireland also had higher overall rates of neonatal death. In contrast, where terminations of pregnancies after prenatal diagnosis of severe congenital anomalies can be undertaken at or after 22 weeks of gestation, and when these are recorded as fetal deaths, fetal mortality rates will
be higher. This is the case in France where terminations of pregnancy are a principal explanation for the very high fetal death rate (9.1 per 1000 total births).
The incidence of low birth weight ranges from 5 to 9% of all births and shows a marked geographical pattern.
The percentage of babies weighing less than 2500 g ranged from 4.2-4.3% of live births in Estonia, Finland, and Sweden to 8.5% in Greece, 8.3% in Hungary, and 7.4% in Spain. A geographical pattern characterised the incidence of low birth weight in Europe, with lower rates in the more northerly countries. Babies may have a low birth weight because of preterm birth or intrauterine growth restriction or for both these reasons. Some of the variation between countries could be due to physiological differences in body size. Very low birthweight babies, weighing less than 1500 g and therefore at the highest risk, accounted for 0.7 to 1.3% of all live births.
Preterm birth rates vary widely among European countries, ranging from 5.5 to 11.4%.
The percentage of live births before 37 completed weeks of gestation was highest in Austria (11.4), followed by Germany (8.9) and lowest in Finland (5.6), Latvia (5.7), Lithuania (5.3), and Ireland (5.5). Some of the variation between countries may be due to differences in the way that gestation is determined, and these differences should be explored. The variation in very preterm births, before 32 weeks of gestation, was less pronounced, and rates for most countries fell within a range of 0.9 to 1.1%.
An estimated 120 000 fetuses and babies had a major congenital anomaly in the EU-25 countries in 2004.
The overall incidence of major congenital anomalies diagnosed during pregnancy, at birth or in early infancy was 24 per 1000 births in 2004 according to EUROCAT data. This incidence has not decreased in recent decades, and there is a need to improve primary prevention policies reducing environmental risk factors in the pre and periconceptional period. Four fifths of cases were live births, the vast majority of whom survived the neonatal period, and may have special medical, educational or social needs. The largest group of congenital anomalies is congenital heart disease. An overall 0.93 perinatal deaths per 1000 births in 2004 were associated with congenital anomaly. The rate of termination of pregnancy for fetal anomaly (TOPFA) varies widely between countries from none (Ireland, Malta) to 10.7 per 1000 births (France), reflecting differences in prenatal screening policy and uptake, and differences in TOPFA laws, practices, and cultural attitudes. The live birth rate of certain anomalies such as spina bifida and Down Syndrome is inversely related to the TOPFA rate in the country.
Cerebral palsy registries make it possible to assess the longer term consequences of perinatal complications for the most common motor impairment in childhood.
Higher survival rates among very low birthweight babies and rising multiple birth rates have increased the proportion of children with cerebral palsy who are born from multiple pregnancies or who are of very low birth weight. For example, between 1980 and 1998 the proportion of very low birthweight babies with cerebral palsy who came from multiple births rose from around 17% to 24%. These increases in the population at risk of developing cerebral palsy have been offset by the decline in the overall prevalence of cerebral palsy among very low birthweight babies, which fell from 60.6 per 1000 live births in 1980 to 39.5 per 1000 in 1996. The significant decline, however, was
Maternal deaths are rare, but the data from some countries suggest that underascertainment is still a problem. Measuring the health of pregnant women during and after pregnancy remains a challenge.
The maternal mortality ratio (MMR) is defined as all deaths from the first trimester of pregnancy until 42 days post partum, from direct and indirect obstetric causes per 100 000 live births. It ranged between 2 and 10 per 100 000 live births for the majority of countries contributing data to this report. Ratios exceeded 10 in Estonia, Latvia, Slovenia, and Scotland (UK). The differences should be interpreted with caution as only six of these ratios are based on more than 20 deaths in the two year period 2003-04.
Maternal deaths are sentinel events pointing to the dysfunction of the health system, but they are hard to enumerate accurately since the pregnancy is not always noted on the death certificate. It is difficult to interpret the meaning of the variations in maternal mortality rates in Europe, because some of the countries with higher mortality may have systems to ascertain and count maternal death more thoroughly. Very low rates may simply indicate failure to ascertain maternal deaths. Given the low incidence of maternal deaths, it is essential to develop indicators of maternal
morbidity. EURO-PERISTAT found that data on severe morbidity associated with childbirth were not readily available from routine systems. Although many countries have hospital discharge data which could be used for this purpose, the diagnostic coding used was not sufficiently reliable. A European initiative is needed to improve the recording of severe maternal morbidity
The demographic characteristics of childbearing women differ greatly across Europe.
The differences in the distribution of demographic characteristics are important for interpreting differences in outcome because maternal age, parity, and multiple pregnancy are associated with risks of preterm birth, low birth weight, and fetal and neonatal mortality.
Adverse outcomes are more common among women older than 35 and among teenaged mothers. Similarly, specific medical complications, such as pregnancy induced hypertension and prolonged labour, occur more often among women giving birth for the first time. Teenaged mothers accounted for less than 2% of women giving birth in Denmark, Slovenia, the Netherlands, and Sweden and more than 7% in the UK, Estonia, the Slovak Republic, and Latvia. Fewer than 10% of the women delivering babies in the Slovak Republic, the Czech Republic, or Poland were aged 35 years or older, compared with 22% in Germany, 23% in Spain, and 24% in Italy and Ireland. The percentage of women giving birth for the first time ranged from 39% in Wales (UK) and 40% in Ireland to 56% in Spain.
Multiple births are much more likely than singleton births to be born before term and have higher rates of congenital anomalies and developmental disorders. Multiple birth rates ranged from 11 to 12 per 1000 women delivering a live or stillbirth in Poland, the Slovak Republic, and Estonia to 23.1 in Denmark, 25.0 in Cyprus, and 20.4 in the Netherlands. Some of the variation in multiple birth rates may be due to differences in the use of assisted reproductive techniques, which accounted for up to 5% of all births; only six countries could provide complete data on this indicator.
The wide diversity of practices in Europe raises questions about the appropriate level of intervention during childbirth.
Countries separated by only a few hundred kilometres have very different approaches to the management of pregnancy and childbirth. For example:
• Rates of caesarean section ranged from 14% in the Netherlands and 15% in Slovenia to 33% in
Portugal and 38% in Italy.
• Instrumental delivery rates ranged from less than 3% of all deliveries in the Czech Republic and the Slovak Republic, and Slovenia to more than 12% in Ireland, Portugal and in the Valencia region of Spain.
• Labour was induced in less than 9% of all deliveries in Lithuania, Estonia, and the Czech Republic and more than 30% in Northern Ireland (UK) and Malta.
• Episiotomy rates ranged from 9.7% of vaginal deliveries in Denmark, 14.2% in Wales (UK), and
16.2% in England (UK) to 82% in Valencia (Spain), 63% in Flanders (Belgium), and 52% in Italy. Not only do health care professionals in some countries intervene more than those in others in the natural process of childbirth, but there are also substantial differences in the types of intervention used. Greater use of intervention may be associated with higher rates of preterm birth or low birth weight or with characteristics of health care systems. These differences raise questions that should be explored in the future.
Diversity within Europe provides opportunities to learn from the differences in cultural and organisational models for maternity and neonatal care.
The long-standing debate about the risks and benefits of childbirth according to the size of maternity units has not ended. In some countries, deliveries still take place in smaller maternity units, with fewer than 500 deliveries per year. These units deliver 19% or more of all births in Cyprus, Latvia, Lithuania, Estonia, and Germany. Elsewhere these types of structures no longer exist or account for only a small percentage of births, less than 3% in Denmark, Sweden, Ireland, Portugal, and Scotland (UK). In countries in both the north and south of Europe, births are
concentrated primarily in very large maternity units. Very large units have been criticised for being impersonal and in some cases have been shown to use more interventions during delivery. Home births are rare almost everywhere, with the prominent exception of the Netherlands, which maintains its unique model of maternity care, with 30% of births taking place at home. In the UK, where home births are offered as an option to women with low risk pregnancies, this percentage ranged from under 1% in Northern Ireland to 3.1% in Wales.
Countries also differ in the models for care adopted for very preterm babies, those born before 32 weeks of gestation. These babies have lower mortality and morbidity when they are delivered in maternity units that have on-site neonatal intensive care. While many European countries have specified the types of specialised units where these babies should be delivered, these specifications and their classifications differ, and the percentage of very preterm babies born in units designated as most specialised ranges very widely – from 26 to 96%.
Behaviours promoting fetal and neonatal health differ in Europe
Smoking during pregnancy can harm the developing fetus and has longer-term consequences for health. Eleven countries could not provide information on the proportion of women who smoked
underlying patterns of smoking and the impact of smoking cessation programmes in the overall population and among pregnant women.
Breast feeding provides benefits to babies, including giving them nutritional advantages and improving their resistance to infections. In Europe, rates of breast feeding at birth ranged from under 46% in Ireland and 62% in France to almost 100% in the Czech Republic, Latvia, Slovenia, and Sweden. Only half of all countries could provide these data, however. Breast feeding during the first 48 hours after birth is an important indicator because its success often depends on the support, information, and assistance of health care professionals during pregnancy and the immediate postpartum period.
While some countries have better health outcomes overall than others, rankings vary by indicator.
No country tops every list. Understanding the reasons for the differences in health indicators between the countries of Europe can provide insight into ways to improve perinatal health. The ranking of a country on a particular indicator can generate hypotheses about the reasons, and these can be further tested in more formalised research on a national and European level.
III. HEALTH INFORMATION SYSTEMS: LESSONS AND RECOMMENDATIONS
Routine perinatal health reporting is a realistic goal in Europe, but there are important gaps, notably maternal and child morbidity and social risk factors.
The breadth of information included in this report shows that routine reporting on a wide range of perinatal health indicators is possible in Europe. Data to construct the EURO-PERISTAT core
indicators are available in almost all countries, and all indicators are available in at least one country. The goal of providing good quality data in a timely manner is realistic. This report also highlights the role of morbidity registries for monitoring child health information (eg, congenital anomalies, cerebral palsy) as well as of data collected in neonatal intensive care units for assessing care for very low birthweight infants.
Problems persist, however, and significant effort is necessary before all European countries can contribute the full set of EURO-PERISTAT indicators. More work is necessary to obtain good quality data for the surveillance of maternal morbidity, care during pregnancy, and the associations between social factors and health outcomes.
The differences in approaches to health information systems in Europe can provide new ideas for all countries.
Some countries, including many of the newer EU member states and the Nordic countries, have more developed perinatal health information systems than others, but improvements are possible everywhere. Each country has something to learn from its neighbours. Investments at a national level are essential to achieve our goal of effective health reporting at a European level.
European collaboration improves the quality of health indicators, but harmonisation at the European level is still necessary in some key areas.
Although many hours were spent standardising definitions in order to produce comparable indicators for this report, work is needed at a national level before this goal can be fully achieved. For instance, the fetal mortality rate, an important indicator of pregnancy outcome and care, is difficult to compare between countries because of differences in legislation and in the ways that early fetal deaths and terminations of pregnancy are recorded in statistical systems. Another
example is information on the timing of the start of antenatal care. It is often impossible to know if the first contact with a health care provider is actually recorded. These uncertainties can be resolved by collective action at a European level.
Priority areas for change and development
Focussing on the following steps would improve Europe’s capacity to report on the health of mothers and babies:
1. Include in routine birth and death data collection systems the information necessary to compute EURO-PERISTAT core and recommended indicators. Data should be recorded on individual births to make it possible to construct standardised indicators.
2. Standardise criteria for inclusion of births and deaths in statistical reporting and enhance statutory civil registration systems with voluntary notification where necessary so that all births, including pregnancy terminations, from at least 22 completed weeks of gestation onwards can be included routinely.
3. Enable linkage between systems for recording data about births and deaths, including linkage between civil registration, medical birth registers, hospital discharge systems, and specialised registries. It is important to link information about deaths in the first year of life to data about pregnancy and birth. Linking data sources can also improve the quality of individual systems. 4. Achieve complete ascertainment of direct and indirect maternal deaths and standardise coding
of the causes of death. Audits and confidential enquiries are a well proven method for improving reporting and for identifying aspects of health services that require improvement. 5. Develop methods for using routine systems such as hospital discharge data and medical birth
registers to measure severe maternal and neonatal morbidity.
6. Harmonise definitions and protocols to improve data from routine sources about the social characteristics of pregnant women and their care during pregnancy.
7. Develop a common protocol for a European perinatal survey to be used by countries that do not have on-going routine systems for key data items. This approach is an effective way to obtain high quality data about perinatal practices and selected outcomes.
IV. THE FUTURE
This report presents primarily data from a single year and thus gives a static cross-sectional picture in time. The full value of having common and comparable indicators will only be realised when this exercise becomes continuous and assessment of progress is possible. Formalising links with data providers and statistical offices is also necessary to ensure that all available data on a national level can be provided in a timely manner.
Bringing together data from civil registration, medical birth registers, other registers, hospital discharge systems, and European surveys presents exciting research possibilities. This common framework could be used to develop epidemiological surveillance in perinatal heath and to provide opportunities for collaboration among health researchers in Europe who wish to undertake more focussed studies to gain knowledge about the specific causes of adverse perinatal outcomes, interventions for prevention and treatment, and the potential for improving perinatal health by improving the socioeconomic circumstances of parents and babies.
SURVEILLANCE OF PERINATAL
2
SURVEILLANCE OF PERINATAL HEALTH IN EUROPE
2.1
WHY MONITOR PERINATAL HEALTH IN EUROPE?
Perinatal health in Europe has improved dramatically in recent decades. In 1975, neonatal mortality ranged from 7 to 27 per 1000 live births in the countries that now make up the European Union (EU); by 2005 it had declined to and ranged 8 per 1000 live births.1Likewise, maternal deaths from
childbirth have become increasingly rare. These across-the-board improvements in perinatal health reflect technological advances in obstetrical and neonatal care, the development of maternity and child health services, and improved standards of living across Europe.
Continuing Risks to Mothers and Babies
Despite this good news, pregnancy and childbirth still involve risk. Mothers in Europe still die in childbirth – approximately 5 to 15 women per 100 000 live births. Alarmingly, around half of these cases are associated with substandard care and are potentially avoidable. Despite the decline in infant mortality, there is still a significant burden of death and disability. Around 25 000 babies are stillborn every year in the EU, and another 25 000 die before their first birthday. More than 40 000 of the survivors (approximately 8 per 1000) have severe sensory or motor impairments2and a
further 90 000 have major congenital anomalies.3Impairments that stem from the perinatal period,
because they affect the youngest members of society, carry a disproportionate (and long-term) burden for children, their families, and social services.
Inequality in Perinatal Health
It is also important to note that these risks and burdens are not distributed equally. Large perinatal health inequalities exist between the countries of Europe, and within each country, poverty and low social status are associated with poor pregnancy outcomes.4These inequalities in perinatal health
carry long-term consequences as studies increasingly show that a healthy pregnancy and infancy reduces the risk of adult illnesses, such as hypertension and diabetes.5Monitoring perinatal health is
an important component in understanding and addressing health inequalities among adults.
Changing Technology = New Risks
Another reason to monitor perinatal health is that continuing medical innovations continue to create new risks and raise ethical issues. While babies born alive at 25 and 26 weeks of gestation now have a 50% chance of survival,6,7survivors have high impairment rates.8,9Medical procedures
have made it possible for more and more couples to conceive, but those same procedures increase multiple births (twinning), which are associated with preterm delivery, and other adverse pregnancy outcomes.10,11European policy makers and health professionals are struggling with the challenges
of how to optimise the use of new technologies while minimising their negative effects, and how to do this without over-medicalising pregnancy and childbirth for the large majority of women who have uncomplicated pregnancies. To meet these challenges, they need accurate and timely
information about health outcomes and services.
Better Statistics for Better Health
4. How many women have babies after procedures for infertility? 5. How much antenatal care do women receive?
6. What are the rates of obstetrical interventions for low-risk pregnant women?
Additional problems with the data in existing international databases relate to their quality and comparability. As perinatal and maternal mortality have decreased, the absolute differences in rates between countries have declined. Differences between countries often result from differences in the registration of deaths rather than actual mortality levels. It is well known that improving health information systems increases reported mortality rates because more deaths are detected. As a result, many health professionals and policy makers have not given much credence to the data reported in international databases. But without better statistics, those who are working toward better perinatal health have no way of monitoring their progress. To monitor trends over time, compare outcomes between countries, and develop benchmarks to improve performance, valid and reliable indicators of perinatal health are needed.
2.2
PERINATAL HEALTH INDICATORS FOR EUROPE: THE EURO-PERISTAT PROJECT
The EURO-PERISTAT project’s goal has been to develop valid and reliable indicators that can be used for monitoring and evaluating perinatal health in the EU.12The project began in 1999 as part of the
Health Monitoring Programme (PERISTAT) and has continued into a third phase, with the ultimate aim of producing a European Perinatal Health Report and establishing a sustainable system for reporting perinatal health indicators.
This project has enlisted the assistance of perinatal health professionals (clinicians, epidemiologists, and statisticians) from EU member states and Norway and has consulted with members of other networks, such as EUROCAT, to help develop and test a recommended indicator list. In our first phase, we developed a set of indicators with members from the then 15 member states.12This
indicator set was developed by a procedure that began with an extensive review of existing perinatal health indicators. The resulting list was used as the basis of a DELPHI consensus process, a formalised method in which a panel of experts respond to a successive series of questionnaires with the aim of achieving a consensus on key principles or proposals. Our first panel in 2002 was
composed of clinicians, epidemiologists, and statisticians from the then 15 member states. We also invited the Surveillance of Cerebral Palsy in Europe (SCPE) Network to assist with the indicator on cerebral palsy. A second DELPHI process was also conducted in 2002, with a panel of midwives to ensure that their perspectives on perinatal health were represented. Finally, a third DELPHI process was conducted in 2006 with a panel of 2 participants (clinicians, epidemiologists, and statisticians) from each of the ten new member states.
The result of this multi-stage formal method is that we were able to achieve consensus on a list of 10 core and 24 recommended indicators of perinatal health. The EURO-PERISTAT indicators (presented in Table 2.1) are grouped into four themes: fetal, neonatal, and child health, maternal health, population characteristics and risk factors, and health services. We defined core indicators – those that are essential to monitoring perinatal health – and recommended indicators – those considered desirable for a more complete picture of perinatal health across the member states. We also identified indicators for further development – those that represent important aspects of perinatal health but require further work before they can be implemented within the member
19 19
states. A study using data for the year 2000 was conducted to assess the feasibility of the EURO-PERISTAT indicators; the results were published in a special issue of the European Journal of Obstetrics, Gynecology and Reproductive Biology13,14and used for detailed analyses of health
indicators in Europe.15,16
Table 2.1 EURO-PERISTAT indicators (C=core, R=recommended, F=further development)
FETAL, NEONATAL, AND CHILD HEALTH
C: Fetal mortality rate by gestational age, birth weight, plurality C: Neonatal mortality rate by gestational age, birth weight, plurality C: Infant mortality rate by gestational age, birth weight, plurality C: Birth weight distribution by vital status, gestational age, plurality C: Gestational age distribution by vital status, plurality
R: Prevalence of selected congenital anomalies R: Distribution of Apgar score at 5 minutes
R: Causes of perinatal deaths due to congenital anomalies R: Prevalence of cerebral palsy
F: Prevalence of hypoxic-ischemic encephalopathy F: Prevalence of late induced abortions
F: Severe neonatal morbidity among babies at high risk
MATERNAL HEALTH
C: Maternal mortality ratio by age, mode of delivery R: Maternal mortality ratio by cause of death
R: Prevalence of severe maternal morbidity F: Prevalence of trauma to the perineum F: Prevalence of faecal incontinence F: Postpartum depression
POPULATION CHARACTERISTICS/RISK FACTORS
C: Multiple birth rate by number of fetusesC: Distribution of maternal age C: Distribution of parity
R: Percentage of women who smoke during pregnancy R: Distribution of mother’s education
F: Distribution of mother’s country of origin
HEALTH CARE SERVICES
C: Mode of delivery by parity, plurality, presentation, previous caesarean section R: Percentage of all pregnancies following fertility treatment
R: Distribution of timing of first antenatal visit R: Distribution of births by mode of onset of labour
R: Distribution of place of birth (according to number of annual deliveries in the maternity unit) R: Percentage of infants breast fed at birth
R: Percentage of very preterm babies delivered in units without a neonatal intensive care unit (NICU) F: Positive outcomes of pregnancy (births without medical intervention)
2.3
OTHER EUROPEAN PERINATAL HEALTH PROJECTS
To enhance our understanding of mothers' and babies' health, EURO-PERISTAT has sought to build links with other research projects and networks that are adding to our knowledge about perinatal health. The following European initiatives have collaborated on producing this European Perinatal Health Report.
SCPE
In 1998, European Commission funding helped to establish a collaborative network of CP registers and population-based surveys. The reasons for this collaborative effort were: (1) the need for standardisation and harmonisation of the definition, inclusion/exclusion criteria, and characteristics used to describe children with CP, and (2) the need for large numbers to be able to analyse distinct subgroups of CP and, in particular, their trends over time. The Surveillance of Cerebral Palsy in Europe (SCPE) network started with 14 centres from eight countries and now includes 22 centres from 16 countries.
The SCPE network achieved a European agreement on the definition, inclusion criteria, and classification of CP, and a “minimum data set or minimum description” of a child with CP, ie, a common language that made it possible to construct a reliable database throughout Europe. The SCPE harmonisation work highlighted interesting characteristics and trends in some subgroups of CP that needed large numbers for any analysis. Application of the common criteria for CP cases and pooling data from several centres allowed SCPE to show a four-fold increased risk of CP in multiple births, mainly explained by gestational age distribution,18a decreasing trend in infection as
the cause of post-neonatal CP cases,19 an optimal birth weight associated with a lower risk of CP,20
and a decreasing CP prevalence rate in children with a birth weight between 1000 and 1500 g.21
EUROCAT
EUROCAT is a collaborative network of population-based registries for the epidemiologic surveillance of congenital anomalies in Europe. EUROCAT started in 1979 and was the first European public health surveillance network.22 It was initially funded as an EC BIOMED concerted
action and since 2000 has been funded by the DGSanco Rare Diseases Programme and then the Public Health Programme. EUROCAT is a World Health Organisation (WHO) Collaborating Centre for the Epidemiologic Surveillance of Congenital Anomalies. In 2008, it includes 32 full member registries, 6 associate member registries, and 11 affiliate member registries operating in 20 European countries. Full and associate member registries regularly transmitting data cover more than 25% of all births in Europe (see Chapter 9).
The objectives of EUROCAT are:
1. To provide essential epidemiologic information on congenital anomalies in Europe
2. To co-ordinate the establishment of new registries throughout Europe that collect comparable and standardised data
3. To co-ordinate the detection of and response to clusters and early warning of teratogenic exposures
4. To evaluate the effectiveness of primary prevention 5. To assess the impact of developments in prenatal screening
6. To provide an information and resource centre and a collaborative research network to address the causes and prevention of congenital anomalies and the treatment, care, and outcome of affected children.
21 21
Cases with one or more congenital anomalies are ascertained among live births, stillbirths and fetal deaths from 20 weeks of gestation, and terminations of pregnancy for fetal anomaly following prenatal diagnosis (at any gestational age). The methodology of each registry is described at http://www.eurocat.ulster.ac.uk/memberreg/memberreg.html. Each registry annually transmits a standard anonymised data to the EUROCAT Central Registry, using the EUROCAT Data
Management Program (EDMP) software. This software's incorporation of validation routines, reporting functions, and statistical software for detecting trends and clusters underpins the successful fulfillment of EUROCAT’s first three objectives. Prevalence rates of 95 subgroups of congenital anomalies, updated twice a year, are freely available at
http://www.eurocat.ulster.ac.uk/pubdata/tables.html. An annual statistical monitoring report details time trends and clusters detected in each registry and the results of investigations into their causes. In recent years, EUROCAT has played an important role in: a) pointing out the lack of success in Europe in preventing neural tube defects due to the lack of success in raising periconceptional folate status;23,24 b) surveying the differences in prenatal screening policy and laws and practices
regarding termination of pregnancy between European countries;25, 26c) describing the differences
in prenatal detection rates of a range of congenital anomalies between countries;25,27d)
documenting the extent to which the rate of Down Syndrome among live births has been influenced by the trend toward increasing maternal age in all countries and counteracted by the trend toward increasing prenatal detection and termination rates in some countries;28e) developing
pharmacovigilance (adverse drug effect reporting systems) for the teratogenic effects of drugs taken during pregnancy;29and f) documenting the increase in prevalence of gastroschisis, an
abdominal wall anomaly, across Europe.30A complete list of publications on these and other topics
can be found at http://www.eurocat.ulster.ac.uk/pubdata/Publist.html.
EURONEOSTAT
EuroNeoStat is a project funded by the European Commission intended to reduce neonatal morbidity and mortality, to improve both the safety of very-high-risk preterm babies and their health status at 2 years, and to detect any inequalities that might exist within and between countries. Our ultimate aim is for any infant to have the same chance of intact survival no matter where he or she happens to be born.
To achieve those goals we developed a European Information System to assess and improve the quality of the health care received by very preterm (before 32 weeks of gestation) and very low birthweight infants (VLBW, birth weight <1.501 g). We designed, collected, and validated a standardised set of indicators specific for birth weight and gestational age and related to prenatal events, neonatal interventions, and long-term outcome at two years of age to assess the quality of care received in participating NICUs.
The main achievements of the EuroNeoStat project are:
1) Collection of data from more than 3000 VLBW infants a year from 60 NICUs, data that can now be used to perform standardised comparisons of results between these institutions and with others, to identify areas where care can be improved, and to monitor the success of these quality improvement efforts;
3) Insights obtained from the observed clinical variability into better ways to deliver care and to promote wide-scale consensus in policies and strategies for care of these high-risk infants; 4) Dissemination among neonatologists of the concept that gestational age rather than birth
weight should be used to assess care;
5) Development of a consensual minimal follow-up dataset to assess the health status of surviving infants at 24 months of corrected age;
6) Assessment of the value of perinatal indicators for predicting the gestational age-specific health status of survivors at 24 months of corrected age; and up-to-date information technology tools; 7) Development of an e-platform that uses up-to-date information technology tools to record,
transfer, validate, standardise, and compare the data collected and up-to-date Internet-based technologies to facilitate incoming data and the outflow of standardised comparative results. We believe that the EuroNeoStat project has achieved its planned objectives and has provided benchmarks for the neonatal care of very high-risk infants in European NICUs. Several areas require further development to improve the care process for them, in particular, the
implementation of quality improvement initiatives to prevent hospital-acquired infections and adverse events and a further assessment of neurological development at an older age.
2.4
CONCLUSIONS: ADVANTAGES OF BUILDING INFORMATION SYSTEMS AT THE EUROPEAN
LEVEL
This report is the first of what we hope will be a series of regular reports on perinatal health in the EU. Our aim is to provide data that can be used as a point of comparison for individual countries. Because this report reveals the strengths and weaknesses of perinatal health information systems in each member state, countries can use their neighbours' experiences to expand their information systems to cover the entire spectrum of EURO-PERISTAT indicators. For those indicators for which there are reliable data, this report makes it possible to benchmark performance in providing effective health services and promoting the health of mothers and their newborns. Beyond outcomes, these data also underline the varied approaches to care provision in the countries of Europe and raise interesting questions about ways to optimise the care and health of women and babies. By pooling European experiences, data, and expertise, we aim in the future to develop research capacity and to produce evidence to support policy decisions about these important questions. Regular reporting on the EURO-PERISTAT indicators is a first step in this direction.
23 23
REFERENCES
1. EUROSTAT.
http://epp.eurostat.ec.europa.eu/extraction/evalight/EVAlight.jsp?A=1&language=en&root=/the me3/demo/demo_minfind 2006;accessed January 2008.
2. Cans C, Guillem P, Fauconnier J, Rambaud P, Jouk PS. Disabilities and trends over time in a French county, 1980-91. Arch Dis Child. 2003;88(2):114-7.
3. see below, chapter 9.
4. Kramer MS, Seguin L, Lydon J, Goulet L. Socio-economic disparities in pregnancy outcome: why do the poor fare so poorly? Paediatr Perinat Epidemiol. 2000; 14(3): 194-210.
5. Barker, D. In utero programming of chronic disease. Clin Science. 998; 95: 115-128.
6. Effer SB, Moutquin JM, Farine D, Saigal S, Nimrod C, Kelly E, et al. Neonatal survival rates in 860 singleton live births at 24 and 25 weeks gestational age. A Canadian multicentre study. BJOG. 2002;109(7):740-5.
7. Draper ES, Manktelow B, Field DJ, James D. Prediction of survival for preterm births by weight and gestational age: retrospective population based study. BMJ. 1999;319(7217):1093-7. 8. Wood NS, Marlow N, Costeloe K, Gibson AT, Wilkinson AR. Neurologic and developmental
disability after extremely preterm birth. EPICure Study Group. N Engl J Med. 2000;343(6):378-84. 9. Doyle LW. Outcome at 5 years of age of children 23 to 27 weeks' gestation: refining the
prognosis. Pediatrics. 2001;108(1):134-41.
10. Hansen M, Kurinczuk JJ, Bower C, Webb S. The risk of major birth defects after intracytoplasmic sperm injection and in vitro fertilization. N Engl J Med. 2002;346(10):725-30.
11. Jackson RA, Gibson KA, Wu YW, Croughan MS. Perinatal outcomes in singletons following in vitro fertilization: a meta-analysis. Obstet Gynecol. 2004;103(3):551-63.
12. Zeitlin J, Wildman K, Bréart G, Alexander S, Barros H, Blondel B, et al. Selecting an indicator set for monitoring and evaluating perinatal health in Europe: criteria, methods and results from the PERISTAT project. Eur J Obstet Gynecol Reprod Biol. 2003;111 Suppl 1:S5-S14.
13. Lack N, Zeitlin J, Krebs L, Kunzel W, Alexander S. Methodological difficulties in the comparison of indicators of perinatal health across Europe. Eur J Obstet Gynecol Reprod Biol. 2003;111 Suppl 1:S33-44.
14. Macfarlane A, Gissler M, Bolumar F, Rasmussen S. The availability of perinatal health indicators in Europe. Eur J Obstet Gynecol Reprod Biol. 2003;111 Suppl 1:S15-32.
15. Buitendijk S, Zeitlin J, Cuttini M, Langhoff-Roos J, Bottu J. Indicators of fetal and infant health outcomes. Eur J Obstet Gynecol Reprod Biol. 2003;111 Suppl 1:S66-77.
16. Blondel B, Macfarlane A, Gissler M, Bréart G, Zeitlin J. Preterm birth and multiple pregnancy in European countries participating in the PERISTAT project. BJOG. 2006;113(5):528-35.
17. Zeitlin J, Blondel B, Alexander S, Bréart G. Variation in rates of postterm birth in Europe: reality or artefact? BJOG. 2007;114(9):1097-103.
18. Topp M, Huusom LD, Langhoff-Roos J, Delhumeau C, Hutton JL, Dolk H. Multiple birth and cerebral palsy in Europe: a multicenter study. Acta Obstet Gynecol Scand. 2004; 83:548-53. 19. Cans C, Surman G, McManus V, Coghlan D, Hensey O, Johnson A. Cerebral palsy registries.
21. Platt MJ, Cans C, Johnson A, Surman G, Topp M, Torrioli MG, et al. Trends in cerebral palsy among infants of very low birthweight (<1500 g) or born prematurely (<32 weeks) in 16 European centres: a database study. Lancet. 2007; 369:43-50.
22. Weatherall J (1985). "The Beginnings of EUROCAT". Louvain-la-Neuve, Cabay. Available at http://www.eurocat.ulster.ac.uk/pubdata/Publist.html.
23. Busby A, Abramsky L, Dolk H, Armstrong B and a EUROCAT Folic Acid Working Group. Preventing neural tube defects in Europe: population based study". BMJ. 2000;330: 574-575. 24. EUROCAT (2005a), "EUROCAT Special Report: Prevention of neural tube defects by
periconceptional folic acid supplementation in Europe". EUROCAT Central Registry, University of Ulster. [www.eurocat.ulster.ac.uk/pubdata/Folic-Acid.html]
25. Boyd PA, de Vigan C, Khsohnood B, Loane M, Garne E, Dolk H and the EUROCAT Working Group. Survey of prenatal screening policies in Europe for structure malformations and chromosome anomalies, and their impact on detection and termination rates for neural tube defects and Down's syndrome. BJOG. 2008; 115 :689-696.
26. EUROCAT (2005b). "EUROCAT Special Report: Prenatal screening policies in Europe". EUROCAT Central Registry, University of Ulster.
[www.eurocat.ulster.ac.uk/pdf/Special-Report-Prenatal-Diagnosis.pdf]
27. Garne E, Loane M, Dolk H, de Vigan C, Scarano G, Tucker D, Stoll C et al. Prenatal diagnosis of congenital malformations in Europe. Ultrasound Obstet Gynecol. 2006; 25:6-11.
28. Dolk H, Loane M, Garne E, de Walle, H, Queisser-LuftA, de Vigan C, Addor M-C, Gener B, Haeusler M, Jordan H, Tucker D, Stoll C, Feijoo M, Lillis D, Bianchi F. Trends and geographic inequalities in the livebirth prevalence of Down syndrome in Europe 1980-1999. Revue Epidem Sante Publique. 2005; 53:2S87-2S95.
29. Dolk H, Jentink J, Loane M, Morris J, de Jong-van den Berg LTW and the EUROCAT Antiepileptic Drug Working Group. Does lamotrigine use in pregnancy increase orofacial cleft risk relative to other malformations. Neurology. 2008;71:714-722.
30. Loane M, Dolk H, Bradbury and a EUROCAT Working Group. Increasing prevalence of gastroschisis in Europe 1980-2002: a phenomenon restricted to younger mothers? Paediatr Perinat Epidemiol. 2007;21:363-369.
3
DATA SOURCES FOR PERINATAL
HEALTH MONITORING IN EUROPE
3
DATA SOURCES FOR PERINATAL HEALTH MONITORING IN
EUROPE
This report presents perinatal health indicators from national and regional perinatal health
information systems in the European member states that participated in the EURO-PERISTAT project and Norway (26 countries) as well as data collected by three other European collaborations on more specific themes: SCPE (for cerebral palsy), EUROCAT (for congenital anomalies) and EURONEOSTAT (for very-low-birthweight infants). Information on data collection and sources for the latter three projects is included in the chapter on each project (8, 9, and 10).
3.1
EURO-PERISTAT DATA COLLECTION
Each country's representative on the EURO-PERISTAT scientific committee was responsible for overseeing the collection of the data from his or her country (see Appendix A1 for list of contributors). In some cases this person nominated another person to be in charge of gathering EURO-PERISTAT indicators1,2at the national level. In others, the national representative contacted
different data providers and compiled the data for the project. This was the case, for example, for the United Kingdom, where many data sources cover populations within only one or two of the four countries (England, Wales, Scotland, and Northern Ireland). The first aim was to gather data at the level of the member state. If these were not available, data for regions or constituent countries were collected, as in Belgium, Spain, and the UK. The second aim was to get population-based data from existing routine data sources – administrative or health registers or statistical systems or routine surveys. Data from ad hoc surveys were not used.
Aggregated data were collected with an Excel-based system in a format that covered all the core and recommended indicators. Some data were collected for the indicators for further development, although we present only four of them in this report. Cerebral palsy data must be collected through data registries and are compiled by members of the SCPE Network. Although the prevalence of cerebral palsy is part of the PERISTAT indicator set, the data were not collected in the EURO-PERISTAT study. We asked for data for 2004 or, if data were not available for 2004, for the latest available year. TNO, the representative from the Netherlands, was responsible for developing the data collection instrument and overseeing the collection process.
Instruments were constructed to include checks to verify data quality, such as verification of totals and minimum or maximum values. When TNO received the completed Excel data collection instruments, the project coordinators looked them over to ensure that the data were filled in correctly. Queries were made to each country at this point. The indicators were then tabulated and sent to the scientific committee members and data providers for a first review. The EURO-PERISTAT project then held a meeting in Warsaw in April of 2008 to discuss the results. This process also made it possible to identify outlying values and consider questions related to indicator definitions. Data providers had a final chance to check all the indicators and endorse the EURO-PERISTAT tables before publication of this report.
Belgium were regional and most data for the UK related to constituent countries . While Belgium has a national system for collecting data on births, this system cannot provide timely data. In the UK, legislation about civil registration ensures some degree of harmonisation of vital statistics, but data about health care vary considerably in their scope and definition between the four constituent countries. Spain also provided data on many of the EURO-PERISTAT indicators from the region of Valencia.
The extent to which scientific committee members obtained data for regions and constituent countries when data were not available on a national level varied between member states. The types of data source used to provide the requested perinatal data are described below. The data source used is given in all data tables in Appendix B, and Appendix C provides more detail on each data source.
3.2.1 CIVIL REGISTRATION BASED ON BIRTH AND DEATH CERTIFICATES, INCLUDING CAUSE-OF-DEATH
REGISTRATION:
These data systems are used in Austria, Belgium (Brussels), Cyprus, the Czech Republic, Estonia, Finland, France, Germany, Ireland, Italy, Latvia, Lithuania, Luxembourg, Malta, the Netherlands, Poland, Portugal, Slovenia, Spain, Sweden, and the UK (which has three separate civil registration systems, one for England and Wales, one for Scotland, and one for Northern Ireland. Data from these systems can be combined to provide UK totals for some indicators based on birth and death registration).
All EU member states have a civil registration system that covers all births and deaths. Registration is obligatory and the data usually cover citizens and permanent residents very well. Non-residents are usually but not universally excluded. Member states used this source to provide the number of live births, stillbirths, infant deaths, and maternal deaths. Some could also provide data about
background characteristics, such as maternal age, parity, plurality (singleton, twin, or triplet or higher order pregnancies) or birth weight. In most countries, the data source includes only a limited number of variables related to perinatal health. Some countries, such as France, conduct regular perinatal surveys to gather the medical information that is not available through routine civil registers.3Civil registration is completed by an obligatory registration of deaths and their causes.
Birth and death certificates were linked together to get more complete data for the infant mortality indicator in two member states (Austria and Ireland), two countries of the UK (England and Wales), and two regions (Brussels in Belgium and Valencia in Spain). In Scotland, death registration data were linked to data derived from hospital records. In other countries that use separate sources to compute mortality rates, problems arise because the inclusion criteria vary by data source. More generally, using denominators and numerators from different sources can cause statistical inconsistencies.
3.2.2 MEDICAL BIRTH REGISTERS (PERINATAL DATABASES):
Flanders in Belgium, the Czech Republic, Denmark, Estonia, Finland, Germany, Hungary, Ireland, Italy, Latvia, Lithuania, Luxembourg, Malta, the Netherlands, Norway, the Slovak Republic, Slovenia, and Sweden.
In Northern Ireland, data came from birth notifications to four population-based child health systems and in Wales, Apgar score data came from its child health system. Beginning in 2005, data from birth notifications to the National Health Service Register in England and Wales have been linked to civil birth registration data.