Publisher’s version / Version de l'éditeur:
Vous avez des questions? Nous pouvons vous aider. Pour communiquer directement avec un auteur, consultez la première page de la revue dans laquelle son article a été publié afin de trouver ses coordonnées. Si vous n’arrivez pas à les repérer, communiquez avec nous à [email protected].
Questions? Contact the NRC Publications Archive team at
[email protected]. If you wish to email the authors directly, please see the first page of the publication for their contact information.
https://publications-cnrc.canada.ca/fra/droits
L’accès à ce site Web et l’utilisation de son contenu sont assujettis aux conditions présentées dans le site LISEZ CES CONDITIONS ATTENTIVEMENT AVANT D’UTILISER CE SITE WEB.
Internal Report (National Research Council of Canada. Institute for Research in Construction), 1995-05-01
READ THESE TERMS AND CONDITIONS CAREFULLY BEFORE USING THIS WEBSITE. https://nrc-publications.canada.ca/eng/copyright
NRC Publications Archive Record / Notice des Archives des publications du CNRC : https://nrc-publications.canada.ca/eng/view/object/?id=10a08387-7cc3-4962-a855-1d8405fb55b5 https://publications-cnrc.canada.ca/fra/voir/objet/?id=10a08387-7cc3-4962-a855-1d8405fb55b5
NRC Publications Archive
Archives des publications du CNRC
For the publisher’s version, please access the DOI link below./ Pour consulter la version de l’éditeur, utilisez le lien DOI ci-dessous.
https://doi.org/10.4224/20375349
Access and use of this website and the material on it are subject to the Terms and Conditions set forth at
Sound Transmission Through Framed Buildings Craik, R. J. M.; Steel, J. A.; Nightingale, T. R. T.
-
--
-- -:Sr Natlonal Research Consell national
'HI I Councll Canada de recherche5 Canada
Wb27 I i 0. 672 . 2 I -
IUcmcmi?c
Sound 7kansmission Thmugh
Framed
Buildings
A report on collaboration between Heriot-Watt University
and National Research Council of Canada
Robert J.M. Craik, John A. Steel and Trevor R.T. Nightingale
IRC Internal Report IRC-IR-672
Sound Transmission Through Framed Buildings IRC-IR-672
CONTENTS
Contents List of symbols List of figures List of tables Acknowledgements Abstract CHAPTER 1: INTRODUCTION 1.1 IntroductionCHAPTER 2: OUTLINE OF THEORY 2.1 Introduction
2.2 Subsystem properties Damping Modal densities Energy
2.3 Coupling loss factors
Wall
to room/cavity coupling Room/cavity to wall couplingNon-resonant transmission between rooms Structure to structure coupling
2.4 Transmission paths
MAPTER 3: SOUND TRANSMISSION THROUGH WALLS
3.1 Introduction
3.2 The test facility and specimen 3.3 The basic model
Material properties Damping.
3.4 Steel fire stop 3.5 Plywood fire stop
Sound Transmission Through Framed Buildings
IRC-IR-672
3.7 Gypsum board f i e stop 3.8 Further results and discussion
CHAPTER 4: SOUND TRANSMISSION TO OTHER ROOMS 4.1 Introduction
4.2 Vertical transmission 4.3 Diagonal transmission
CHAPTER 5: SOUND TRANSMISSION ACROSS
FIRE
STOPS 5.1 Introduction5.2 Waves on the plates
Properties of the waves on the plates Fue stop 5.3 Basic model Normal incidence 5.4 Effects of joists 5.5 Results 5.6 Conclusions
CHAPTER 6: -RATION PROPAGATION ACROSS FLOORS 6.1 Introduction 6.2 Measurements 6.3 -Modal frequenaes 6.4 Predicted transmission 6.5 Predicting attenuation 6.6 Discussion CHAPTER 7: CONCLUSIONS 7.1 Summary of conclusions
7.2 Recommendations for further research Appendix A The test facility
Appendix
B
The PPC program ReferencesSound Transmission -ugh Framed Buildings
IRC-IR-672
LIST OF SYMBOLS USED
total absorption of a room in metric sabins bending stiffness of a plate
bending stiffness of the sire stop longitudinal wave speed in a plate
speed of sound in air (taken to be 350 m/s2) sound pressure level difference
Young's modulus energy
frequency
critical frequency
stiffness of a plate when ribs are present wave number of a wave in a plate
length of the joint between Susbystem 1 and Subsystem 2
= length of a floor bay in the x and y directions respectively
= moment of inertia
= total mass of a building element
= thickness of a plate
= number of modes at frequency f
= sound reduction -1Ologz = surface area
= reverberation time of a cavity or structure
= amplitude of a wave in a plate 1
m2 Nm Nm m/s m/s d B N/m2 Joules l / s l / s Nm 1 /m m N/m m m dimensionless dB m2 S m
Sound Transmission Through Framed Buildings
IRC-IR-672
= near field amplitude of a wave in a plate 1 = roomvolume
= slope of a deformed plate
= displacement of a deformed plate
= poissons ratio
= angle of incidence for a wave = total loss factor
= normal surface velsity = radiation factor
= coupling loss factor from Subsystem 1 to Subsystem 2
= transmission coeffident from Susbystem 1 to Subsystem 2
= surface density of a
building
elementm m3 dimensionless m dimensionless radians dimensionless m/s dimensionless dimensionless dimensionless
Sound Transmission Through Framed Buildings IRC-IR-672
LIST
OF
F'IGURES
Figure 3.1 Figure 3.2 Figure 3.3 Figure 3.4 Figure 3.5 Figure 3.6 Figure 3.7 Figure 3.8 Figure 3.9 Figure 3.10 Figure 3.11Schematic representation of the SEA model and its 9 subsystems used for the calculation of sound transmission
Reverberation time measured in the cavity between the walls 12 and in the floor together with a best fitting cum:
Reverberation times measured on the gypsum board 14
partition wall used both for the gypsum walls and the floors
Predicted airborne level difference for transmission through 15 the wall between rooms 1 and 2 when there is a steel fire stop
together with the two direct transmission paths
Predicted airborne level difference for the basic model and 18 the model with the effective perimeter of the floors and walls
inaeased
Predicted airbome level difference between rooms 1 and 2 showing the contribution of the flanking paths involving the fire stop
Measured and predicted transmission loss from room 1 to 2 for a wall with a steel fire stop
Measured and predicted transmission loss &om room I to 2 for a wall with a plywood fire stop
Predicted airbome level difference from room 1 to 2 showing the contribution of the paths assodated with the plywood fire stop
Measured and predicted transmission loss from room 1 to 2 for a wall with a plywood fire stop and with a floating floor on the receiving room floor
Predicted airbome level difference for transmission from room 1 t o 2 showing the effect of adding the floating floor and the importance of the flanking path
Sound Transmission Through Framed Buifdiogs IRC-IR-672 Figure 3.12 Figure 3.13 Figure 4.1 Figure 5.1 Figure 5.2 Figure 5.3 Figure 5.4 Figure 5.5 Figure 5.6 Figure 5.7 Figure 5.8 Figure 5.9 Figure 5.10 Figure 5.11
Measured and predided transmission loss from room 1 to 2 for a wall with a gypsum board fire stop on the aanking wall Measured and predicted transmission loss from room 1 to 2 for steel, plywood and gypsum board fire stops
Measured and predicted verticat transmission loss between rooms 1 and 3
Measured and predicted diagonal transmission loss between rooms 1 and 4
Fire stop p i t configuration
Structural transmission loss as a function of the stif£ness of the fire stop and the plate stihess
Difference between random and normal incidence for the transmission loss across a fire stop
Definition of joist properties at fire stop joint
Predicted transmission coe£ficients against angle of incidence at 1OOO Hz for transmission from floor 11 with a plywood fire stop (no joists)
Predicted transmission coefEcienk at 1OOO Hz versus angle of incidence for hansmission from floor I1 with a plywood fire stop including the effeds of joisk
Predicted angular average transmission loss for vibration transmission from wall 9 to floor 12 with a plywood fire stop Predicted angular average transmission loss for v i t i o n transmission from wall 9 to floor 12 with a gypsum board fire stop
Predicted angular average transmission loss for vibration transmission from wall 9 to floor 12 with a steel fire stop Measured and predicted struchml vibration level di£ference for transmission from floor 11 to wall 10 with a plywood fire stop
Sound Transmission Through Framed Buildings IRC-IR-672 vii Figure 5.12 Figure 6.1 Figure 6.2 Figure 6.3 Figure 6.4 Figure 6.5 Figure 6.6 Figure 6.7 Figure 6.8 Figure A1 Figure A2 Figure A3 Figure A4 Figure A5
for transmission from floor 11 to floor 12 with a plywood fire stop
Measured and predicted structural vibration level difference for transmission from wall 9 to wall 10 with a plywood fire stop
Measured attenuation across a timber floor past a series of timber joists
Angles at which the modes in a 0.4 x 4.54 m panel are incident on the joist boundary
Transmission coefficient as a fundion of angle for a plate beam-plate model at 125,250,500,1000 and 2000 Hz Transmission coefficient for each mode in the 0.4 x 4.54 m panel section
Band averaged transmission loss for a plate-beam-plate joint Predicted attenuation across the floor using the band
averaged transmission coefficients
Measured and predicted attenuation acmss the first joist Predicted attenuation across the floor where the band averaged transmission coefficients are used for the first joint and the transmission coefficients are assumed to be 1 for all other joints
Schematic diagram of the flanking facility
S o n through the specimen showing construction details Sketch of the section through the specimen showing the sub- systems that were modelled and their identification number Sketch of the joint involving the fire stop at the bottom of the party waU This joint wall was modelled as Joint 1
Sound Transmission Through Framed Buildings
IRC-R-672
Figure A6 Flan section through the party and flanking walls of the 77 upper rooms
Figure A7 Sketch showing the sub-systems used to model the party and 78 Danking walls of the upper rooms
Figure A8 Sketch showing the fire stop in the flanking wall which was 79
modelled as Joint 2
At the bottom of most of the figures is a reference number together with the date of generation. This number refers to the location of the data on the disk For example, 3.6 has the reference FIG24. The data for this figure can be found in a directory on the data disk called FIG24. The data is then held in files FIG24.A, FIG24.B, FIG24.C, etc. The data is stored as
ASCTI
characters and there is a separate file for each curve. The FIG24.BAT file and the FIG24.SET file were used with the GRAPH program to generate the figures.Sound Transmission Through Framed Buildings
IRC-IR-672
LIST OF TABLES
Table 3.1 Summary of material properties 10
Table 3.2 Table 3.3
Measwed reverberation times for each of the rooms
Measured reverberation time of the gypsum board partition wall between rooms 1 and 2 and and the best fitting curve Table 3.4
Table 3.5
Measured and predicted transmission loss between rooms I and 2 with a steel fire stop
Measured and predicted transmission loss for transmission from room 1 to 2 with a plywood fire stop.
Table 3.6 Measured and predicted transmission loss from room 1 to 2 with a plywood fire stop and the floating floor in room 2 Measwed and predicted vertical transmission loss from room 1 to 3
Table 4.1
Table 4.2 Measured and prediaed diagonal transmission loss from room 1 to room 4 with a plywood fire stop
Table 5.1 Predicted angular average transmission loss in dB for bansmission from floor 11 for various fire stop materials (no joists,
Table 5.2 M c t d angular average transmission loss in dB for bansmission from wall 9 for various fire stop materials (no joists)
Table 5.3 Predicted angular average transmission loss in dB for transmission from floor 11 for various fire stop materials using a model that includes the effect of joists
Predicted angular average transmission loss in dB for transmission from wall 9 with various fire stop materials using a model that includes the effect of the joist at the joint Table 5.4
Sound Transmission Through Framed Buildings IRC-IR-672
ACKNOWLEDGEMENTS
This
report is a result of collaboration between Heriot-Watt University and the National Research Council Canada.The initial work on sound transmission across fire stops was undertaken at Heriot-Watt University when T. Nightingale visited Scotland in May 1994.
This
work was developed during a visit by R Craik and J. Steel in October and November 1994.The work was carried out at the Institute for Research in Construction at NRC in Ottawa and was funded by the NRC and by Heriot-Watt University, Edinburgh, Scotland.
Sound Transmission Through Framed Buildings IRC-IR-672
ABSTRACT
This
report looks at sound transmission through walls and floors in a flanking laboratory at NRC Canada.A statistical energy anaIysis (SEA) model was developed to predict sound transmission both for direct transmission through the walls and floors and for flanking transmission either due to a specially introduced fire stop material or from flanking due to the construction of the laboratory.
The theoretical model was able to predict most of the characteristics of transmission and that the direct transmission through a wall is dominated by non-resonant transmission into and out of the cavity below the critical frequency and by resonant transmission into and out of the cavity above the critical frequency.
When a fire stop was placed in the test facility there was a considerable decrease in both the measured and predicted transmission. The dominant path at the higher frequencies was then from the source room into the floor, across the fire stop and finally radiated by the floor. The path can be largely eliminated by the use of a floating floor as was confiied both theoretically and experimentally.
Airborne sound transmission through the floors also gave good agreement betwean the measured and predicted results.
A more detailed study of the flanking transmission associated with the fire stop was undertaken. It was found that the joists at the joint reduced transmission at the higher frequencies and that at very high frequencies provided an almost total block on transmission across the fire stop.
A study of vibration propagation across a timber joist floor was also undertaken. Measurements showed that there was considerable attenuation
Sound Transmission Through Framed Buildings
1RC-IR-672
xii
with distance except at 250 Hz. A further examination of the modal properties of the floor and transmission at a joist showed that there was considerable spatial fdtering and that, as was measured, vibration would only be transmitted at some frequencies.
Sound Transmission Through Framed Buildings IRC-IR-672
1
INTRODUCTION
INTRODUCTION
In order to understand sound transmission through framed buildings, a collaborative study was undertaken between Heriot-Watt Univers;:y, Edinburgh, Scotland and the National Research Coundl Canada, Ottawa, Canada.
The aim of the collaboration was initiallv to develop a theoretical model A
to predict the effect of fire stops on sound transmission through walls. This was extended to include urediction of all transmission paths between rooms in standard construbio&. This included horizontal tra&mission through a wall, vertical transmission through floors, and diagonal transmission where there is no c o r n o n wall and all transmission is flanking transmission.
Sound Transmission Through Framed Buildings
IRC-IlZ-672
OUTLZNE
OF THEORY
21 INTRODUCTION
The basic theory that was used to predict the performance of the structures is Statistical Energy Analysis. This is a powerful framework of analysis ideally suited to this type of problem where determinktic solutions are not possible. This section does not indude the basic theory of SEA but does indude the specific equations that were used to perform the calculations.
The actual calculations were carried out using a program called
PPC.
This runs
batch type programs which are included in Appendix B for reference together with the actual coupling loss factors computed for the basic model.2 2 SUBSYSTEM PROPERTIES
Damping
For each subsystem the reverberation time was measured. These values are discussed in more detail in Chapter 3 where the basic model is described. The total loss factor, q, (often referred to as the system damping) was computed from the reverberation time, T, using the equation
where f is the frequency. Modal densities
The modal density is required for some of the calculations of coupling loss factor.
The modal density of a room was computed from the equation
where V is the room volume, co is the speed of sound, S is the surface area, and L is the perimeter length. At low frequenaes, cavities behave as two dimensional spaces and the modal density is given by
Sound Transmission Tbrougb Framed Buildings
IRC-EM72
Above the f i t cross mode where a
half
wavelength fits into the depth of the cavity, the cavity behaves like a room and equation (2.2) was used.The modal density of walls and floor cladding was determined from
where S is the surface area, h is the thickness of the material, and CL is the longitudinal wave speed.
Although not often used in this report, energy is used in SEA as the representing dynamic response. For a room the energy (in dB re 10-l2 J) is given by
where
L,
is the sound pressure level in dB re 2x10⁵ N/mZ and V is the volume. For walls and floors the energy is given bywhere
rn
is the total mass andv
is the normal surface velocity.2 3 COWLING LOSS FACTORS
Wall to mom/cavity coupling
The coupling loss factor from a wall to a room or to a cavity is computed from
where
a
is the radiation efficiency. The equations used for o were those given by Leppington et a1 (1982) asSound Transmission Through Framed Buildings IRC-IR-672
where 1, and 1, are the plate dimensions (Ixdy), U is the plate perimeter,
6
is the critical frequency andi=(fC/f)-1/2.
These are the same as the &ressions given by Maidanik except that a correction has been made for frequencies below.
f, setting the "g~" term to zero and correcting the values at f,.The value of perimeter length used in the calculations is discussed further in Chapter 3.
The expressions above are for simply supported panels in an infinite baffle. The radiation efficiency was increased by a factor of 4 below the critical frequency to account for radiation into a quarter space and to account for damping of the edges. The correction is x2 for each.
Although these expression are for radiation into free space, it was assumed that the same equations could be used to give radiation into a cavity. Room/cavity to wall coupling
In all cases, the coupling loss factors describing power flow from an acoustic space to a structure can be found using the consistency relationship given by
Thus, if the coupling from a wall to a room is known, then the coupling in the opposite direction can be readily computed.
For large rooms where the modal density can be approximated by the first term of equation (2.2), the coupling loss factor from a room to a plate becomes
Sound Transmission Through Framed Buildings IRC-IR-672
I£
a wall is being excited from a cavity, taking equation (2.3) as the modal density of the cavity gives the CLF from a cavity to a wall asNon-resonant transmission between rooms
When modelling sound transmission through a wall, there wiU be non- resonant transmission modelled as direct transmission between two rooms.
Transmission from one room to another space is given by
and transmission from a cavity to another space is
The transmission coefficient, T, to be used with these equations is more commonly given as a transmission loss, R, defined as lOlog(l/z). This can be found from the mass law using equations such as
= 20log(f p,) - 42 (2.16)
or one of the many variations. However, as this is the dominant transmission path over much of the frequency range, the more accurate equations by Leppington et a1 were used giving the transmission coefficient as
Sound Transmission Through Framed Buildings IRC-IR-672
where U(/,, I,) is a function of shape and can be ignored for normal shaped structures and p2=fC/f as in equation (2.8).
This
equation is the same as the equation by Sewell but has additional terms which inaease the accuracy close to the critical frequency. These terms (the second and third line) can usually be ignored except close to the critical frequency so that the term in the square bracket can be set to zero.The structural coupling was obtained from the equation
where z is the transmission coefficient and LIZ is the common boundary length of the joint.
This
transmission coeffiaent is described in more detail in Chapter 5.2 4 TRANSMISSION PATHS
Although SEA can be used to determine the response of all subsystems by the solution of a series of simultaneous equations this requires specialised software. However, the magnitude of a transmission path can be determined by hand.
If the source and receiving subsystem are both rooms, then the airborne level difference, D, due to transmission along a path 1-2-3-4-
...
n can be given bySound Tmsmission Through Framed Buildings IRC-IR-672
The level difference can be expressed in a normalised form as a Transmission Loss (or Sound Reduction Index), R, as
where
T2
is the reverberation time of the receiving room 2One of the most important paths is non-resonant transmission through the double wall involvine non-resonant transmission into the " cavity of the double wall followed by non-resonant transmission out again Inserting the expressions for the coupling and total loss factors into equation (2.18) gives the Transmission loss for the path as
Sound Transmission Through Framed Buildings
RC-IR-672
3
SOUND
TRANSMISSION
THROUGH WALLS
The work on sound transmission through walls was split into several parts. The first part was concerned with a basic model to predict sound transmission. This SEA model included all the parts of the flanking laboratory that were thought necessary for the prediction of sound transmission both through the walls and through the floors. This section only contains results for the transmission through the walls.
The initial modelling was carried out for the wall where there was a 0.38 mm steel sheet fire stop. This has the lowest stiffness, and transmission via the flanking paths is not important. The results of this section are given first.
The model was then changed to give predictions for the system with a plywood fue stop and a gypsum fue stop on the flanking wall. These results are given next.
Finally, further work was carried out validating some of the initial assumptions. Due to the time constraints, it was not possible to go back over every prediction but the more important implications of this later work are then discussed.
3.2 THE TEST FACILITY AND SPECIMEN
The test facility was the Flanking Laboratory at the NRC. Details of the basic construction and details of the structure tested are given in Appendix A.
3.3 THE BASIC MODEL
The basic SEA model that was used for the calculations can be seen in Figure 3.1. Each of the major components (the rooms, the cavities between the walls, the floors (both walking surface and joists) and the walls (one for each leaf)) is modelled as a separate subsystem. Some variations on this are given in other sections but this model provides a base from which variations can be determined.
Sound Transmission Through Framed Buildings IRC-IR-672 ... ! j i ... : I 2 ... - ... ...
. .
. .
. .
. .
. . Room A (1)1
i lankin Wall Leaf
(a
i, Wall Cavity
(20)
Figure3.1. Schematic representation of the SEA model and its subsystems used for the calculation of sound transmission.
Sound Transmission Through Framed Buildings
IRC-IRrn
It was assumed that the floors and the walls were each a single subsystem and that the floor joists and wall framing were not important.
This
is reasonable as an initial assumption though it does lead to some errors. This is discussed further in Chapter 5.This model is essentially the same as that used by Price and Crocker in 1970 though some of the assumptions are slightly different and the model has been developed to include other transmission mechanisms.
Material properties
The dimensions and material properties of these subsystems are listed in Table 3.1. -- -- Subsystem
LX
LY Lz Pf.
m m m kg/m2 rn 1 room 4.54 4.60 2.43 2 room 4.52 4.11 2.43 3 room 4.38 4.46 2.07 4 room 4.37 3.96 207 5 upperwallcavity 6 floor cavity 7 floor cavity 8 lower wall cavity9 upper partywall 10 upper party wall 11 floor
12 floor 13 ceiling 14 ceiling
15 lower party wall 16 lower party wall
17 flankingwall 3.80 2.43 0.26 19.2 3000
18 flankingwall 3.70 243 0.026 19.2 3000
20 flanking wall cavity 7.50 2.43 0.191
Sound Transmission Through Framed Buildings IRC-IR-672
Damping
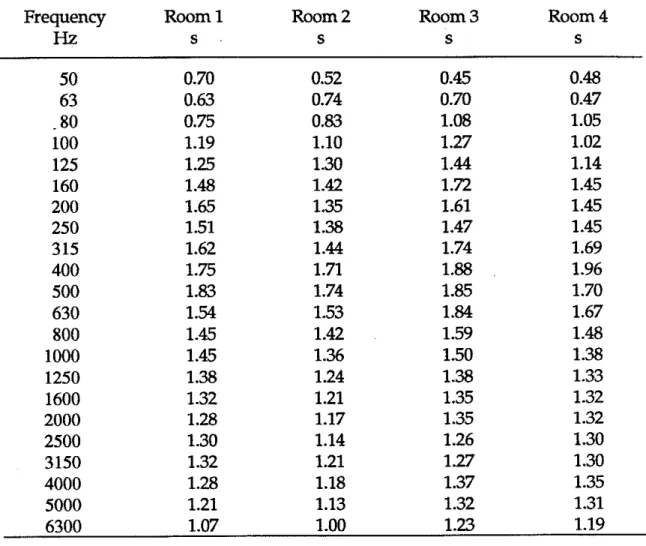
For the room volumes, the damping was obtained from measured reverberation times. The actual values are not too important as the measured results were norrnalised (usually as Transmission Loss) and so are independent of the room's damping. The reverberation times used are listed in Table 3.2.
Attempts were made to measure the reverberation times in the cavities. Both the cavities of the wall and the floor have considerable amounts of absorption in the space so that the reverberation time would be expected to be much shorter than for rooms.
Frequency Room 1 Room 2 Room 3 Room 4
Hz
S S S STable 3.2 Measured reverberation
times
for
each
of
the rooms.Measured values of reverberation time are given in Figure3.2. High values of around 1 second are likely to be leakage from the rooms. Based on these initial measurements, the reverberation time in the cavity was taken to be
Sound Transmission Thmugh Framed Buildings IRC-IR-672
I
I l l I I I I 1 l 1 1 l 1I
I
I
I
I
~
- 63 125 250 500 1000 2000 4000Frequency
Hz
- ?- -
R e v e r b e r a t i o n t i m e i n
a w a l l
- +- -
R e v e r b e r a t i o n t i m e
i n
a floor
E s t i m a t e d b e s t
f i tFigure3.2. Reverberation time measured in the cavity between the
walls
and in the floor together with a best fittingcurve.
(PPC FIG3,26 Oct. 94)At low frequenaes, the sum of the predicted coupling loss factors (CLF) was higher than the total loss factor
(TLF)
which violates the premise of SEA. Consequently, the TLF at 50 Hz was increased by 3 dB, at 63 Hz it was increased by 2 dB, and at 80 Hz was increased by 1 dB.Sound Transmission Through F m e d Buildings IRC-IR-672
These values were used in all initial tests though later measurements are discussed at the end of the chapter.
The reverberation times of the gypsum wall were measured and the values are listed in Table 3.3. The measured data were only available from 100 to 2000 Hz so an average value was obtained by plotting the reverberation times on a log scale and fitting a straight line through the data. This then filled in all the other frequencies. Both the measured and best fit data are shown in Figure 3.3. Atkmpts to measure the damping of the floor were unsu~iessf~l and so these values were used for all the strudural subsystems.
Frequency Measured Best fit line
Hz
S STable 3.3. I'vfazwred rmerberation time
of
the gypsum board partition wall behoeen rooms 1 and 2 and the best fitting curve.Sound Tmnsmission Through Framed Buildings mc-m-672
Frequency
Hz
Measured
- - -
,Best fit curve
Fipre3.3. Reverberation
timPs
measured on thegypsurn
bomd
partrtion wall used bothfor
thegypsum
walls and t h e p m . (PPC FIG18,01 Nov. 94)The coupling loss factors used were calculated using the above data and the equations
given
in Chapter 2.3.4 STEEL FIRE STOP
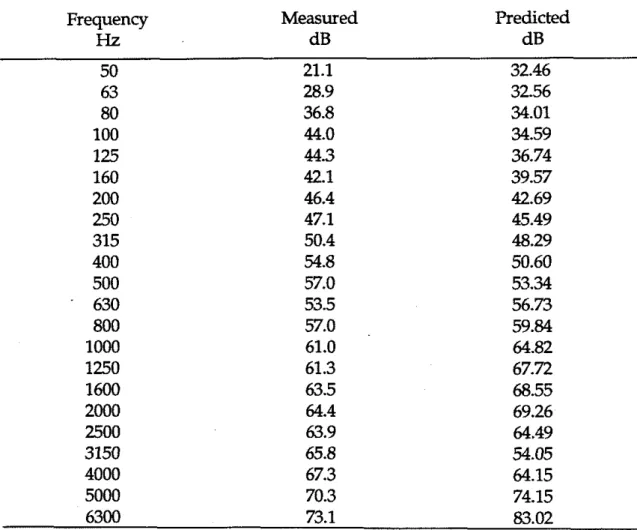
The first model was run to give the results for a steel fire stop. This fire stop is
very
soft and produces almost no flanking transmission. Using the model desaibed above, the airborne level difference was computed from transmission between rooms 1 and 2. The results are shown in Figure 3.4 and Table 3.4.Frequency
Hz
Sound Transmission Through Framed Bwldings 15
IRC-IR-672
.
Resonant d i r e c t
path (1-3-5-10-2l- - -
-
Non-resonant d i r e c t
path (1-5-21 A l l paths90
Figure3.4. Predicted airborne level diference
for
transmission through the wall between r m1 and 2 when there is a st& firestop together with the huo direct transmission paths. (PPC FIG23,02Nm.
94)*
-
i
I
An analysis of the dominant transmission paths shows that transmission is determined largely by the non-resonant transmission below the aitical frequency and by resonant transmission above the critical frequency. These correspond to the paths 1-52 and 1-9-5-10-2, respectively. Both these paths are shown in Figure 3.4.
l r l l l l l l l r l l l l l l
63 125 250 500 1000 2000 4000
Adding in the flanking along the wall by adding in the paths 1-20-2, etc., makes little difference. The path 1-20-2 is about 4 dB less important than the path 1-52. The area of the wall is about the same but the area of the cavity is much larger and this accounts for its lower importance.
The steel fire stop degrades the sound isolation by at most 1.3 dB and is more or less independent of frequency.
Sound Transmission Through Framed Buildings
IRC-IR-672
One of the properties of the joist floor and framed wall is that the effective perimeter is increased below the critical frequency due to the restraining effect of
the beams. For a subsystem like the party wall (9), this would increase the effective perimeter from 13.94 to 67.4 m and the floor (11) would be increased from 18.28 to 118.16 m
This
is based on each subsystem being changed to one with 12 independent sections (one for each bay defined by a joist or stud). Below the critical frequency, the radiation efficiency is directly proportional to the perimeter length. The radiation efficiency is therefore increased by about 8 dB which could be important as the radiation occurs 4 times in the path 1-9-5-10-2 giving a decrease in the level difference of about 32 dB. However, most of the individual sections of floor are then placed in a baffle that is in the same plane as the floor so that the multiplier of x4 should be reduced to a multipIier of x2.Frequency Measured Predicted
Hz
dB dB 50 21.1 32.46 63 28.9 32.56 80 36.8 34.01 100 44.0 34.59 125 44.3 36.74 160 42.1 39.57 200 46.4 42.69 250 47.1 45.49 315 50.4 48.29 400 54.8 50.60 500 57.0 53.34 630 53.5 56.73 800 57.0 59.84 1000 61.0 64.82 1250 61.3 67.72 1600 63.5 68.55 2000 64.4 69.26 2500 63.9 64.49 3150 65.8 54.05 4000 67.3 64.15 5000 70.3 74.15 6300 73.1 83.02Table 3.4 Measured and predicted transmission loss between room 1 and 2 with a steel f i e stop.
Sound Transmission Tbrough Framed Buildings
IRC-IR-672
In the model,
this
caused some difficulty as at low frequencies the sum of the CLFs is then higher than the TLFs which were obtained from measured reverberation times. For the rooms, the reverberation times and hence theTLF
can be considered to be very reliable so such a modif~cation to the CLFs cannot be appropriate. The reason is that there are no modes in the floor sub-panels below 125 Hz so that below this frequency the floor acts as a single subsystem and the perimeter is simply that of the entire floor. Above the critical frequency, this correction has no effect but just below the critical frequency the nail spacing is such that the in-line joint with the joists changes from being like a line (which is correct at low frequencies) to being like a series of points. The effective perimeter will obviously be less than for a continuous line but the exact value is not known.
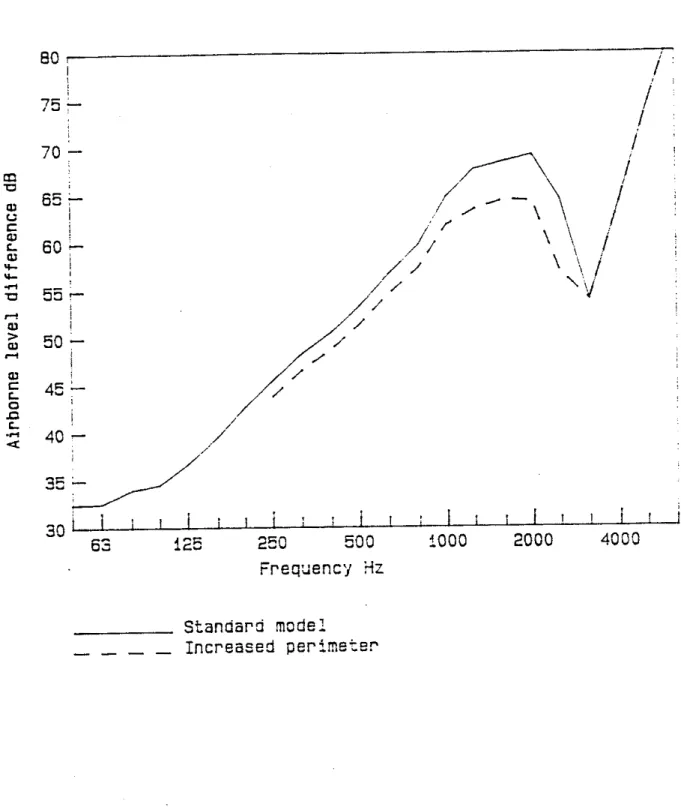
The upper limit for the radiation efficiency was computed increasing the perimeter and reducing the multiplier by 2. The results for the level difference between rooms 1 and 2 can be seen in Figure 3.5. The general trend is for the peak in level difference just below the critical frequency to be reduced by up to 5 dB. Given the uncertainty of the effective perimeter in this region the increased perimeter was not used in other calculations.
For
this
type of construction, the (steel) fire stop does not produce aparticularly strong flanking path. There are 4 dominant paths involving the fire stop:
Sound Transmission Though Framed Buildings IRC-IR-672
Freqnency
3zS t a n d a r d model
- -
-
I n c r e a s e d p e r i m e t e r
Figure 3.5, Predicted airborne level difference for the basic model and the model with the .ffective perimeter of the floors and walls increased. (PPC FlG25,
Sound Transmission Through Framed Buildings IRC-IR-672
The airborne level difference from these paths was summed and is shown plotted in Figure 3.6 with the overall level difference. It can be seen that the flanking paths can be ignored.
This
would be expected because the structural transmission loss for this joint is over 60 dB. The transmission coefficients are described in more detail in Chapter 5.Frequency
Hz
- - -
S u mof
flanking pathswith fire stop
S u m
of all
pathsFigure3.6. Predicted airbome level difference between rooms 1 and 2 shaving the contribution
of
the flanking paths involving the fire stop. (PPC FIG 24,Sound Transmission Through Framed Buildings
IRC-IR-672
A comparison of the measured and predicted results can be seen in Figure 3.7. In this case, the level difference has been nonnalised to give an airborne transmission loss. The agreement between the results is very good. The predicted dip at 3150 Hz is due to the critical frequency of the gypsum and is probably sharper
than
it should be. The hump just below f, would be reduced ifthe effective perimeter was increased.
Frequency
Hz
Measured
- - -
-
P r e d i c t e dFigure3.7. Measured and predicted transmission loss from
room
1 to 2 for a wallSound Transmission Through Framed Buildings IRC-IR-672
3.5 PLYWOOD FIRE STOP
A similar comparison of measured and predicted transmission loss for the wall with the plywood fire stop can be seen in Figure 3.8 and Table 3.5. Again there is good agreement between the results.
Measured
- -
- -
P r e d i c t e dFipn3.8. Meamred and predicted trammission IM from rmnn 1 to 2
In
a wall m'th a plyzoood fire stop. (PPC FIG25,02Nm.
94)Sound Transmission Through Framed Buildings
IRC-IR-672
Frequency Measured Redided
Hz
dB dB 50 18.2 29.49 63 27.4 31.10 80 38.8 32.97 100 44.5 34.71 125 43.8 37.18 160 42.0 39.83 200 44.7 42.14 2.50 42.0 44.34 315 38.8 46.50 400 42.8 48.54500
51.0 50.23 630 50.6 51.64 800 51.8 52.49 1000 49.7 52.23 1250 52.4 49.01 1600 48.5 38.36 2000 48.8 42.47 2500 47.6 47.89 3150 48.3 50.07 4000 50.0 54.00 5000 51.6 58.88 6300 53.9 63.34Table3.5. Measured and predicted transmission loss from room 1 fo 2 with a
plywwd fire stop.
The relative importance of the transmission paths can be seen in figure 3.9. Each of the four flanking paths listed above is shown together with the total transmission due to all paths and the result for the steel fire stop (which
has effectively no flanking at the fire stop joint).
The most important flanking path is the floor-floor path (1-11-12-2). The two paths floor-wall (1-11-10-2) and wall-floor (1-9-12-2) are more or less the same (the differences being due to small changes in room volumes and reverberation times) they would be identical if the graph showed transmission loss. The least important path is the wall-wall path (1-9-10-2).
At very low frequencies the flanking is not important but in the mid frequenaes the flanking dominates transmission.
Sound Transmission Through Framed Buildings IRC-EM72 l l i t l i ' ! I~ i ~I I i l l 3 0 6 3 125 250 50 0
iooo
2000 4000 Frequency Hz--
- -
Wall-wail path--
- -
Wail-floor path--
-
- Fioor-wall path-
,
- -
~ : _ o o r - f loor path S u m of all paths.
Sum of all paths for no firestopFigure3.9. Predicted airborne level difference from room 1 to 2 showing the
wnm'butiun of the paths associated with the plywood fire stop. (PPC
Sound Transmission Through Framed Buildings IRC-IR-672
3.6 PLYWOOD
FIRE
STOP WlTH A FLOATING FLOORThe predicted resdts were recomputed with a floating floor on top of floor 12 in the receiving room 2. This was assumed to eliminate coupling between the floor and room 2. This will then remove the floor-floor flanking path (1-11-12-2) which was an important path when there was floor to room -
coupling.
A comparison of the measured and predicted results is given in Figure 3.10 and in Table 3.6. The agreement is reasonable but the prediction is about 6 dB too low.
AU
the trends are correctly predicted.20 I l l 1 I l l 1 I l 1 1 1 1 I l l 1
63 iE5 250 500 1000 2000 4000
1-J
Frequency
Hz
Measured
-
-
- -
Predicted
Figure3.10. Measured and predicted transmission loss from room 1 to 2 for a wall
with a
plywood
fire stop and wifh a Postingflwr
on the receivingr
m
flour. (PPC FIG29,02 Nm. 94)Sound Transmission Through Framed Buildings
IRC-IR-672
Frequency Measured Predicted
Hz
dB dB 50 20.8 31.32 63 29.9 32.93 80 38.5 34.79 100 42.3 36.55 125 41.6 39.26 160 45.5 42.26 200 52.3 44.95 250 55.3 47.60 ' 315 55.7 50.28 400 57.3 52.95 500 61.4 55.30 630 62.5 57.53 800 64.7 59.45 1000 65.5 61.22 1250 68.2 60.64 1600 67.6 55.71 2000 66.8 57.20 2500 62.7 56.89 3150 64.7 51.47 4000 68.5 57.59 5000 72.4 63.11 6300 77.6 67.89Table3.6. Ivhmured and predicted transmission loss from room I to 2 with a
Sound Transnission Through Framed Buildings IRC-IR-672
The change in the predicted level difference can be seen in Figure 3.11.
This shows the predicted overall level difference for the plywood fire stop with and without the floating floor. The addition of the floating floor makes a si@icant difference at the mid frequencies. The floor-wall flanking path 1-11- 10-2 is also shown and as would be expected from Figure3.9 it is now an important path. 1 ! / i 65
-
. !
, , I,
i I 60-
i
m u 55-
/'
q
'7
.
m I U c i ! m L!
',Id>
50-
-
! Y-'
\"-
I / i .nI
/ \ 0 r \ r( 45-.
m > m1
id5"
\ //1
r( \ / ! 40-
C \ / L ai
I n41
'.
L ! .n 35+ // 4 L-'/ A I I l l 1 / / I I l l 1 1 1 1 3 0 k vI
/ t i 63 ?25 250 50 0 LOO0 2000 4000 Frequency HZ.
Floor-wall flanking path-
-
- -
All paths without flgating flr All paths with floating floorFigure3.11. Predicted airborne l e d diference for transmission
from
room 1 to 2 showing the effect of adding the floating floor and the importanceof
the finking path. (PPC FIG28,OZ Nov. 94)Sound Transmission Through Framed Buildings IRC-IR-672
3.7 GYPSUM BOARD
FIRE
STOPMeasured and predicted airborne transmission loss results are shown in Figure3.12 for a gypsum board fire stop. The agreement is excellent up to 1000 Hz but thereafter the measured data is lower than predicted. This cannot be explained at present. , . l i !
I
I l l I l I I I l l1 20 I l l I d 1 I l l 63 125 250 500 1000 2000 4000 Frequency HZ Measured- - - -
P r e d i c t e dFigure3.12. Measured and predicted transmission loss from room 1 to 2 for a wall
with a gypsum board fire stop on the flanking wall. (PPC FIG30, 02
Nm.
94)Sound Transmission Through Framed Buildings
IRC-1R-672
3.8 FURTHER RESULTS AND DISCUSSION
A comparison of the measurements and predictions can be seen in Figure3.13 for the steel, plywood and gypsum board f i e stops. The transmission loss for the case with the gypsum board is unusual in that there is good agreement between measured and predicted results at low frequenaes but then measured decreases with frequency.
1 1
Frequency
Hz-
Measured
-
s t e e l f i r e s t o p
-,
-
-
P r e d i c t e d
-
s t e e l f i r e s t o p
Measured
-
plywood f i r e s t o p
-
- -
,
P r e d i c t e d
-
plywood f i r e s t o p
.
Measured
-
gypsum board f i r e s t o p
--
- -
P r e d i c t e d
-
gypsum board f i r e s t o p
Figure3.13. Measured and predicted transmission loss
from
room 1 to 2 for steel, plywood andgypsum
bmrd fire stops. (PPC FIG39,02 Noa. 94)Sound Transmission Tbrough Framed Buildings
IRC-IR-672
At 50 Hz there is a dip in all of the results. This could be due to a mass- spring-mass resonance of the wall cavities. This resonance would occur at
where d is the depth of the cavity in metres, and p, is the surface density in kg/m2. In this case, the resonance would occur at 48 Hz and so could account for the dip. A non-resonant transmission path could be included in the model
if
Sound Transmission Through Framed Buildings IRC-lR-672
4
SOUND TRANSMISSION
TO OTHER ROOMS
As well as predicting transmission through the party wall between rooms 1 and 2, the SEA model was used to predict transmission from the source room 1 to the other rooms 3 and 4. The SEA model was the same as was used in Chapter 3.
4.2
VERTICAL
TRANSMISSIONMeasured and predicted sound transmission through the floor from room 1 to 3 is shown in Figure 4.1. There was no coupling included between the floor surface and the joists, nor between the joists and the ceiling. The ceiling gypsum boards were mounted on resilient channel so that this should have significantly reduced coupling between the joists and the ceiling making any coupling between the plywood and the joists irrelevant
Despite the simplicity of the model, there is good agreement at frequencies up to 4000 Hz. At higher frequencies, the predicted transmission loss is too high.
4 3 - DIAGONAL TRANSMISSION
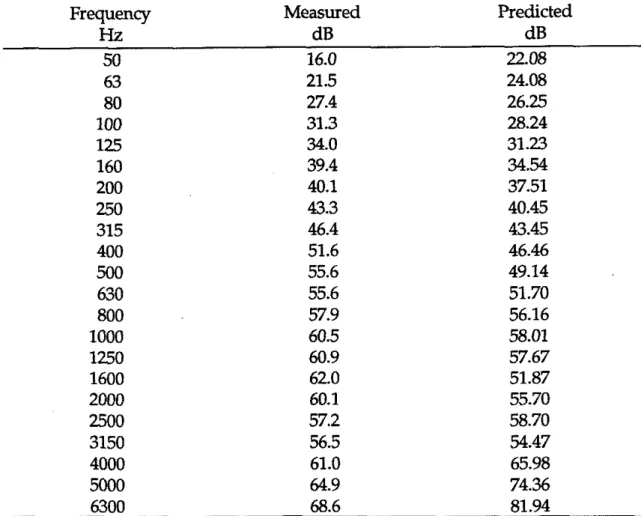
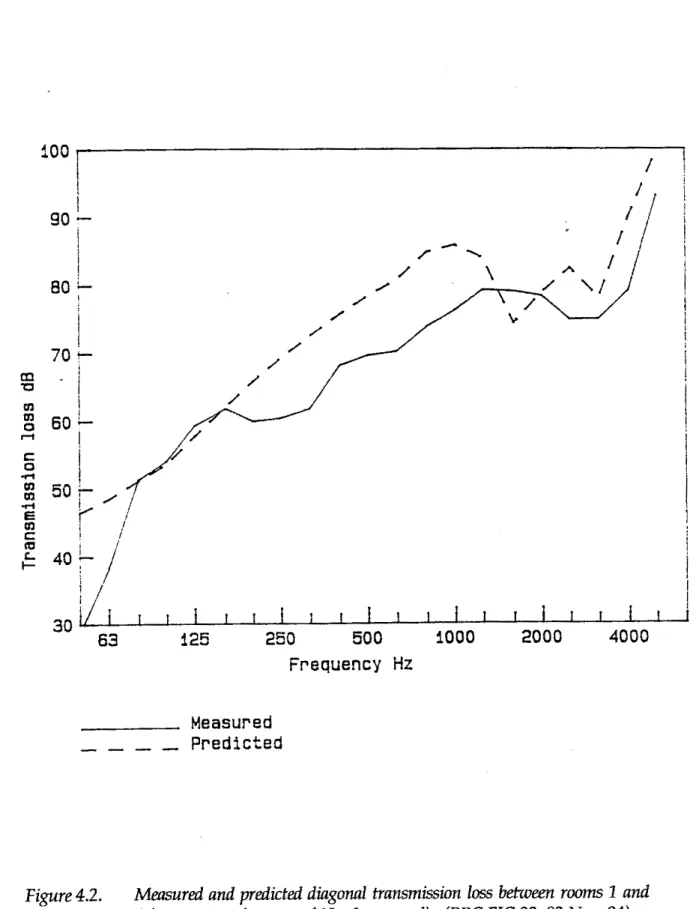
The model was also used to predict transmission diagonally between rooms 1 and 4. The model was again unchanged from Chapter 3. No additional coupling was introduced into the model apart from that already described. As a result, there is poorer agreement between the measured and predicted transmission loss shown in Figure 4.2 though the correct trends are predicted.
Sound Transmission Through Framed Buildings
IRC-IR-672
Frequency
Hz
Measured
-
- -
-
PredictedFigure 4.1. Measured and predicted &z) transmission loss b e e n rooms 1 and 3. (PPC FIG31,02
Nm.
94)Sound Transmission Through Framed Buildings
IRC-IR-672
Frequency Measured Predicted
Hz
dB dB SO 16.0 22.08 63 21.5 24.08 80 27.4 26.25 100 31.3 28.24 125 34.0 31.23 160 39.4 34.54 200 40.1 37.51 250 43.3 40.45 315 46.4 43.45 400 51.6 46.46500
55.6 49.14 630 55.6 51.70 800 57.9 56.16 1000 60.5 58.01 1250 60.9 57.67 1600 62.0 51.87 2000 60.1 55.70 2500 57.2 58.70 3150 56.5 54.47 4000 61.0 65.98 5000 64.9 74.36 6300 68.6 81.94Sound Transmission Tbrough Framed Buildings IRC-IR-672
Frequency
Hz
Measured
-
-
-
-
P r e d i c t e dFigure 4.2. Measured and predicted diagonal transmission loss between rooms 1 and
Sound Transmission Through Framed Buildings
IRC-IR-672
Frequency Measured Predicted
Hz
dB dB 50 28.7 46.50 63 38.3 48.51 80 51.4 51.24 100 54.1 53.66 125 59.3 57.69 160 61.8 61.99 200 59.9 65.79 250 60.4 69.24 315 61.8 72.54 400 68.2 75.68 500 69.7 78.39 630 70.3 80.80 800 73.9 84.86 1000 76.3 85.91 1250 79.3 83.94 1600 79.0 74.39 2000 78.3 78.89 2500 74.9 82.46 3150 75.0 78.11 4000 79.2 89.96 5000 93.1 99.53 6300 0.0 108.20Table 4.2. Measured and predicted
diagonal
transmission loss from room 1 to 4 withSound Transmission Through Framed Buildings
IRC-IR-672
5
SOUND TRANSMISSION ACROSS
FIRE STOPS
5.1 INTRODUCTION
This
section describes the theory that was used to predict the performance of the fire stops. The first part of the chapter describes the waves and conditions that exist on the plates. The second describes a simple model for transmission across the fire stop, and the third section looks at a more complex model that indudes the effects of joists at the joint.Sound Transmission Through Framed Buildings
lRc-IR-672
5.2 WAVES ON
THE
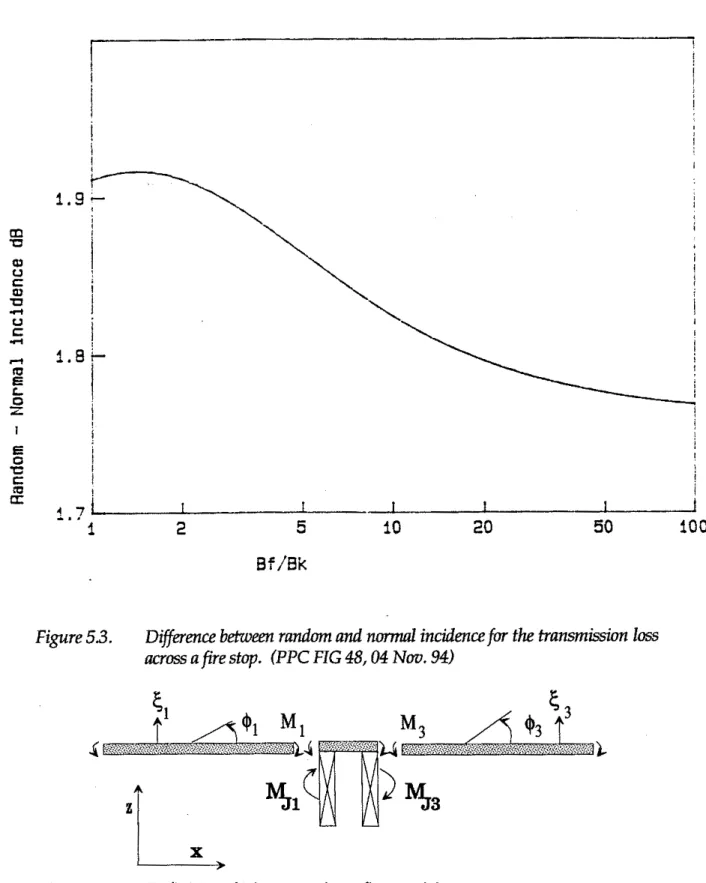
PLATESThe basic system that is examined in this section can be seen in Figure 5.1. It consists of four plates, two on each side of the fire stop.
In order to be able to model the system, a number of approximations and assumptions were made about the system. It was assumed that the plates forming the structural joint are homogeneous. In this section, the joists at the joint are ignored but are introduced to each side of the fire stop in the next section.
It is assumed that there are no in-plane waves generated at the joint. This is the same as assuming that the two sides of the joint are pinned
Properties of the waves on the plates
From the derivation of the bending equation, the slope,
+,
is related to the displacement,E,
bySimilarly the moment, M, applied to the boundary is related to the displacement by
where p is Poisson's ratio and B is the bending stiffness of the plate.
On plate 1 there is an incoming wave of unit amplitude at angle
51,
with a wave numberk ~ .
There is also a reflected wave with amplitude, TI, and a near field wave with amplitude, T,,I. The equation for the displacement is thenThe last term is common to all equations and is not given in subsequent equations.
Sound Transmission Through Framed Buildiigs
IRC-IR-672
for any plate. The angle at which the waves leave the joint can be found from Snell's law which requires that
In a similar manner, there are waves on plates 2 , 3 and 4 which can be given by
Fire stop
The fire stop is subjected to moments and as a result is deformed. A positive moment on either side will, for the coordinate system used, give a negative angle of rotation. Thus
where Bt is the fire stop bending stiffness.
The stiffness of the fire stop can be found by considering a small element of beam and using fundamental mechanics
where L is the span of the fire stop (typically 13 or 25 mrn), h is the thickness of the fire stop (such as 0.038 mrn for the steel plate) and Y is Young's Modulus of the fire stop material.
Sound Transnission Through Framed Buildings
IRC-lR-672
Typical properties of the fire stop with a span of 25 mm are Young's
Stiffness Modulus Density
Material Nm N/m2 kg/m3
0.038 mm steel 42 210x10~ 7800
16 mm plywood 42201 2.81~109 451
26 mm gypsum board 15900 2.48~109 740
BASIC MODEL
At the boundary, a number of continuity and equilibrium conditions exist.
1 At the joint the displacements of all plates are zero.
2 The right angle between plates 1 and 2 is preserved (the slopes are equal).
3 The right angle between plates 3 and 4 is preserved (the slopes are equal). 4 The sum of the moments at the left hand pin is zero.
5 The sum of the moments at the right hand pin is zero.
6 The angular deformation of fire stop is determined by the bending stiffness and the moment
From these conditions, a number of equations can be generated. The first set of boundary conditions, that the displacements of all plates be zero, gives the amplitude of the near field waves as
The requirement that the slopes of plates 1 and 2 be equal gives $I =
+,
which, expressing the slope as the derivative of the displacement and evaluating, givesSound Transmission Through Framed Buildiogs
IRC-IR-672
In a similar manner, the requirement that the slopes of plates 3 and 4 be equal
(&*)
givesThe requirement that the moments about the left pin sum to zero can be written as
Substituting for M and I$ gives
The requirement that the moments about the right
pin
sum to zero can be written asSubstituting for M and
4
givesThese four equations - (5.151, (5.16), (5.18) and (5.20)
-
can
be solved simultaneously to give the amplitude of the waves on each plate.The transmission coeffiaent can then be found from
Sound Transmission Through Framed Buildings IRC-IR-672
Normal incidence
If it is assumed that all the plates are the same (have the same material properties and thickness) and that only normal incidence is considered, then the equations can be simplified.
Taking the parameter C to be
the equations for the conditions at the boundary can be solved analytically gi-g
This
gives the transmission loss in non-dimensional form. When C tends to zero,as occurs at very high frequencies or for very soft fires stops, then the transmission loss tends to infity. When C tends to infinity, then the transmission loss tends to 9 dB.
The transmission loss can be seen in Figure 5.2 for both random and normal incidence. It can be seen that the random incidence curve is higher than normal incidence. The difference is about 1.8 to 1.9 dB, as shown in Figure 5.3
5.4 EFFECTS
O F
JOISTSThe joists at the joint will resist rotation due to their inertia and torsional stiffness. The orientation of the joist is shown in Figure 5.4. An equation which describes the resisting moments in the joists can be given in terms of the slopes on the connected plates. In a similar manner to the in-line joint at a beam, which is treated by Cremer et al, the moments and slopes at the joint are related through
Sound Transmission Through Framed Buildings IRC-IR-672
Figure5.2. Structural transmission loss as a function of the stiffness of the fire stop and the plate stiffness. (PPC FIG 47,04
Nm.
94)Sound Transmission Through Framed Buildings
IRC-IR-672
Figure 53. Difference between random and n d incidence for the tramission
loss
moss
a
fire stop. (PPC FIG 48,04 Noo. 94)Sound Transmission Through Framed Buildings
IRC-IR-672
where the subscript J1 is used to represent the joist. J and G are the polar moment of inertia and elastic modulus, respectively. The second joist is attached to plate 3 and its stiffness is given by
whrre the subscript J3 is used to represent the joist attached to plate 3.
Introducing these terms into the equilibrium equations (5.17) and (5.19) gives two new equilibrium equations as,
and
The transmission coefficients can then be calculated by solving the new set of eight boundary conditions ((5.11), (5.12), (5.131, (5.141, (5.151, (5.16), (5.17), (5.19))
as was described in the previous section.
5.5 RESULTS
The transmission coefficients for vibration transmission at 1000 Hz from floor 11 as a function of angle of incidence are shown in Figure 5.5. The simple model was used where the joists are not considered. The fire stop used was plywood. The transmission coeffiaents for transmission to wall 9 and 10 fall smoothly from normal incidence to a limiting angle of 37.6". Strongest transmission is to wall 9.
The transmission coeffiaents for the same joint are shown in Figure 5.6 but the effects of the joists (38x235 mrn finished dimension) are included. The joists reduce transmission at most angles of incidence but two sharp peaks are 0 b s e ~ e d in each curve at an angle of incidence of around 27".
The angular average structural transmission loss at the joint for the cases with and without joists and for plywood, gypsum and steel fire stops are given in Tables 5.1,5.2,5.3 and 5.4 for reference.
Sound Transmission Through Framed Buildings
IRC-IR-672
Sine o f a n g l e of incidence
Figure 5.5. Predicted transmission m-ts against angle of incidence at 1000 Hz
for transmission from floor 11 m'th a plywood fire stop (no joists). (PPC
Sound Transmission Through Framed Buildiigs IRC-IR-672 Sine o f angle
of
i n c i d e n c e Transmission iito
9-
-
- -
Transmission ilto
12 Transmission 11to
10Figure 5.6. Predicted transmission co$fcients at 1000 Hz versus angle o f incidence
for transmission
from
floor 11with
a plywood fire stop including the effects of joists. (PPC FIG 45,03 Nov. 94)Sound Transmission 'Iluough Framed Buildings IRC-IR-672
Table 5.1. Predicted angular w a g e transmission loss in dB for transmission
from
POOT
11fbr
variuus fire s t qmateriaZs (no
jokt.4.
Steel 2119 211.12 211.10 4.5 522 53.8 4.5 53.2 54.8 4.5 54.2 55.8 4.5 55.2 56.8 4.5 56.2 57.8 4.5 57.2 58.8 4.5 58.2 59.8 4.5 59.2 60.8 4.5 60.2 61.8 4.5 61.2 628 4.5 622 63.8 4.5 63.2 64.8 4.5 64.2 65.8 4.5 65.2 66.8 4.5 66.2 67.8 4.5 67.2 68.8 4.5 68.2 69.8 4.5 69.3 70.8 4.5 70.3 71.9 4.5 71.3 72.9 4.5 72.3 73.9 4.5 73.3 74.9 4.5 74.3 75.9 4.5 75.3 76.9 4.5 76.3 77.9 Gypsum Board TII,IZ 211.10 8.5 11.3 12.9 8.3 11.6 13.2 8.1 11.9 13.5 8.0 122 13.8 7.8 126 14.2 7.6 129 14.6 7.4 13.3 15.0 7.2 13.8 15.4 7.0 14.3 15.9 6.8 14.8 16.4 6.6 15.3 16.9 6.5 15.9 17.5 6.3 16.5 18.1 6.1 17.1 18.8 6.0 17.8 19.4 5.9 18.5 20.1 5.7 19.2 20.9 5.6 20.0 21.6 5.5 20.8 22.4 5.4 21.5 23.2 5.3 224 24.0 5.2 23.2 24.8 5.2 24.0 25.7 5.1 24.9 23.5 5.0 25.8 27.4 Freq. 50 63 79 100 126 159 200 252 317 4M) 504 635 800 1008 1270 1600 2016 2540 3200 4032 5080 6100 8063 10159 12800 Plywood zllj 211.~2 nl,Io 9.6 9.9 11.5 9.5 10.0 11.6 9.4 10.1 11.7 9.3 10.2 11.9 9.2 10.4 120 9.0 10.6 122 8.9 10.8 124 8.7 11.0 126 8.6 11.2 128 8.4 11.5 13.1 8.2 11.7 13.4 8.0 12.1 13.7 7.9 124 14.0 7.7 128 14.4 7.5 13.2 14.8 7.3 13.6 15.2 7.1 14.1 15.7 6.9 14.5 16.2 6.7 15.1 16.7 6.5 15.6 17.3 6.4 16.2 17.9 6.2 16.9 18.5 6.1 17.5 19.1 5.9 18.2 19.8 5.8 18.9 20.5
Sound Trausmission Through Framed Buildings
IRC-IR-672
Table5.2. Predicted angular average transmission loss in dB for transmission from
wall 9 for ~~1?'ousfire stop materials (no joists). Freq. 50 63 79 1M) 126 159 200 252 317 400 504 635 800 1008 1270