HAL Id: insu-02270099
https://hal-insu.archives-ouvertes.fr/insu-02270099
Submitted on 23 Aug 2019HAL is a multi-disciplinary open access
archive for the deposit and dissemination of sci-entific research documents, whether they are pub-lished or not. The documents may come from teaching and research institutions in France or abroad, or from public or private research centers.
L’archive ouverte pluridisciplinaire HAL, est destinée au dépôt et à la diffusion de documents scientifiques de niveau recherche, publiés ou non, émanant des établissements d’enseignement et de recherche français ou étrangers, des laboratoires publics ou privés.
Simulation and Validation Strategy on Real-Time
Autocoded Onboard Software for Formation Flying
In-Orbit Ranging Demonstration
Olivier Bompis, Pierre-Yves Guidotti, Michel Delpech, Bernard Pontet
To cite this version:
Olivier Bompis, Pierre-Yves Guidotti, Michel Delpech, Bernard Pontet. Simulation and Validation Strategy on Real-Time Autocoded Onboard Software for Formation Flying In-Orbit Ranging Demon-stration. Embedded Real Time Software and Systems (ERTS2008), Jan 2008, toulouse, France. �insu-02270099�
Simulation and Validation Strategy on Real-Time Autocoded
Onboard Software for Formation Flying In-Orbit Ranging
Demonstration
Olivier Bompis
1, Pierre-Yves Guidotti
2, Michel Delpech
2, Bernard Pontet
21: CS-SI, 5 rue Brindejonc des Moulinais – 31506 Toulouse Cedex 5 – France 2: CNES, 18 av. Edouard Belin – 31401 Toulouse Cedex – France
Abstract: This article gives an overview of the simulation and validation strategy used for a real-time onboard software (OBSW) module developed on Matlab/Simulink® environment and autocoded into C language using the Real-Time Workshop Embedded Coder® (RTW). This module is the key point of the Formation Flying In-Orbit Ranging Demonstration (FFIORD) on PRISMA satellite mission. To respect requirements on real-time execution conditions and software reliability for space missions, the OBSW module is carefully tested before delivery and integration.
Interesting results are obtained based on an inconstancies analysis of the C code produced by RTW, which leads to “good practice” guidelines for Simulink model implementation. Actions realised through this experiment aim at providing a background for the development of adequate Independent Verification and Validation (IV&V) procedures. They give more confidence and experience on the Model-Based Design domain before applying it to large scaled projects.
Keywords: Embedded Autocoded Software, Model Based Design, IV&V, Matlab/Simulink®, RTW®, LEON3, RTEMS.
1. Introduction 1.1 FFIORD Mission Description
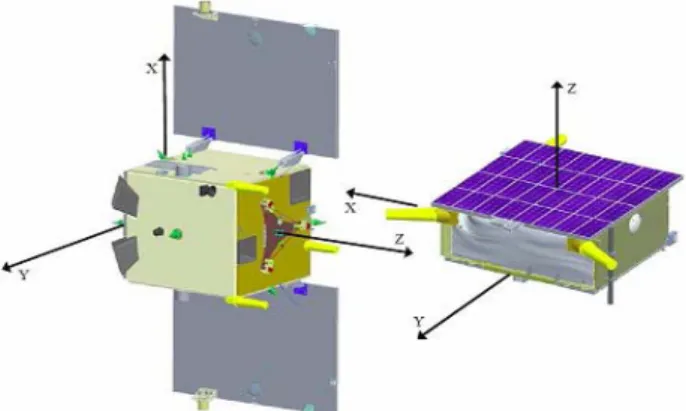
PRISMA is a Formation Flying mission proposed by the Swedish National Space Board (SNSB) for validation of formation flying concepts and technologies as early as 2009. Two satellites set the formation. The Main is a fully manoeuvrable satellite with a six thrusters’ configuration for attitude and orbit control. The Target uses magnetorquers for attitude control only, without orbit control capability. The CNES participation on PRISMA consists of embarking the Formation Flying RF Metrology sub-system (FFRF) on the two PRISMA satellites as passenger equipment. This radiofrequency-based sensor developed by Thales Alenia Space is partly
designed on existing GPS technology. It will be used as a coarse metrology and safety monitoring sensor for future Formation Flying missions. Thus, FFIORD will include closed loop operations with the FFRF sensor, allowing genuine autonomous formation flying scenarios and associated GNC algorithms to be tested in real-life conditions.
Figure 1: Main (left) and Target (right) satellites. 1.2 CNES OBSW Module Development
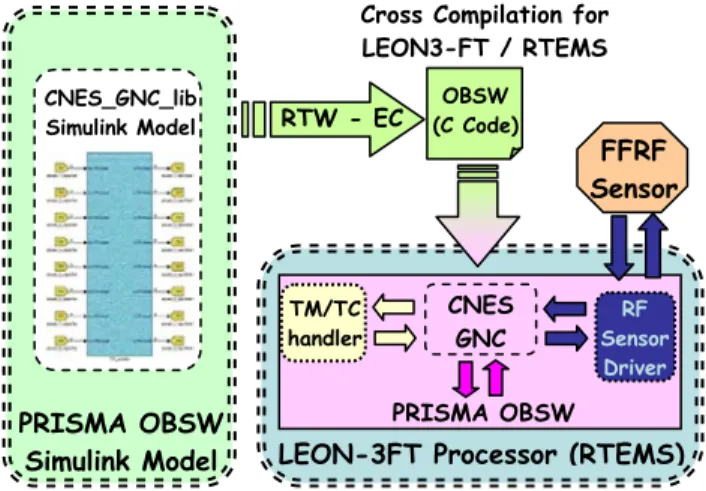
The software development performed by CNES aims at providing a Simulink model named “CNES_GNC_lib”. This library defines several Guidance Navigation & Control (GNC) modules realised with specific blocs in the Matlab/Simulink® environment. These algorithms (mainly based on RF sensor measurements) will run during FFIORD experiment on PRISMA mission. In addition to these goals, the “CNES_GNC_lib” library manages interfaces of the FFRF sensor for open and closed loop GNC experiments.
Once developed and validated on the Matlab/Simulink® environment, “CNES_GNC_lib” is integrated in the main PRISMA OBSW Simulink® model on the Swedish side. An automatic code generation process is then performed using the Real-Time Workshop Embedded Coder®. In order to be run on the Main satellite onboard computer, the autocoded C code is cross compiled for the LEON3-FT (SparcV8 design).
Figure 2: CNES GNC Module Development. The first part of this paper describes the validation process realised on the CNES GNC module within two consecutive steps. The second part contains an evaluation of code generation quality through Code reliability and coverage analysis with specific tools. The last part provides a validation strategy for any autocoded software obtained with the Real-Time Workshop Embedded Coder®. Every section contains associated results.
2. CNES GNC Module IV&V Process A quick and efficient two steps process is performed for the CNES GNC Module validation.
Firstly, a dedicated Matlab/Simulink® test harness is developed to run GNC algorithms in their native context, using space environment and equipment simulation models. A numeric simulator representing accurate behaviour of the FFRF sensor is developed and used in the further OBSW testing. Thus, this simulator is considered as reference for further hybrid tests.
Secondly, a hybrid simulator based on a LEON-3FT processor is developed under the real-time operating system RTEMS. This allows real-time testing for autocoded algorithms obtained from the code generator with PRISMA mission representative processor board and operating system. This hybrid simulator provides realistic estimations of computational load, and evaluates final autocoded algorithm performances by using a set of reference scenarios. Comparisons between these two different environments are realised on produced results. 2.1 Simulation of the “CNES_GNC_lib” Model
The GNC library is entirely developed on Simulink environment in order to be integrated inside the main OBSW developed as Simulink model. This allows
experiment capabilities such as simulation tools provided by this environment. Furthermore, the Model-Based Design approach is well-adapted for any non computer software engineer (i.e. GNC engineer). Each function can be implemented through combination of functional blocks which realise unit operations. At this step, each algorithm is developed on a functionality sense not on a software one. Every requirement and specification comes from functionality analysis.
The “All Software” (AS) test facility consists of a Simulink® simulation which contains several items: • Environment models which simulate realistic
In-Orbit flight conditions.
• TC Generator model which allow controlling the CNES GNC module through specific Telecommands.
• FFRF Sensor model which interacts with the CNES GNC module.
• PRISMA System models which simulate the main OBSW of the Swedish side and other PRISMA services afforded by the spacecrafts. These items are connected as inputs / outputs to the “CNES_GNC_lib” library to be tested.
Figure 3: CNES GNC Model Test Facility. Reference scenarios are run on the Test Facility to stimulate corresponding subsystems (S/S) inside the GNC Simulink® library. Several outputs are analysed such as relative states (three-axis position, speed) between Main and Target satellites, or absolute state of the Target satellite computed by the Navigation function.
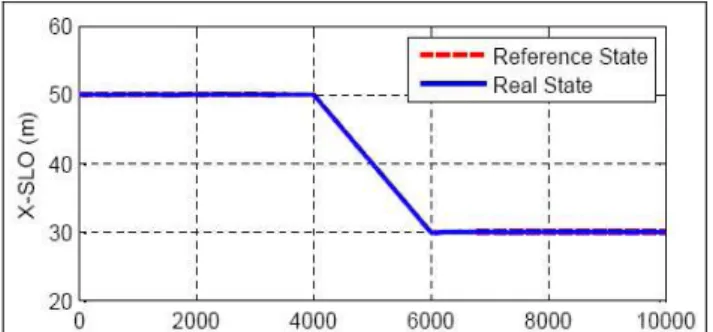
A typical simulation output is presented there after to illustrate the validation strategy of the GNC functions. The simulation scenario begins with station keeping of the Main satellite at [50, 190, 0 m] in the Target Local Orbital Frame named SLO (Z is Earth Oriented, Y is opposite to the orbit kinetic momentum, X is almost the velocity vector for near circular orbit). Then a forced translation is commanded to reach in 2000s the point [30, 0, 0 m].
Simulin k PRISM A syste m model s FFR F modeSensor l T C generato r FFRF commands FFRF messages delta V commands + even t PRISM A signals Environmen t Model s state s comman d state s Simulin k PRISM A syste m model s FFR F modeSensor l T C generato r FFRF commands FFRF messages delta V commands + even t PRISM A signals Environmen t Model s CNES_GNC_li b Simulink Model Simulink (Unix or PC) PRISM A PRISMA system models FFR F FFRF Sensor TC generator FFRF commands FFRF messages deltaV commands + events PRISMA signals Model s Environment Models states command states CNES GNC PRISMA OBSW RF Sensor Driver FFRF Sensor
LEON-3FT Processor (RTEMS)
RTW - EC (C Code) OBSW
Cross Compilation for LEON3-FT / RTEMS PRISMA OBSW Simulink Model TM/TC handler CNES_GNC_lib Simulink Model
Figure 4: Evolution of the Main satellite position on X axis in SLO frame.
Comparison between Reference State from the Environment Models and Real State from the GNC library allows checking the expected functional behaviour and the performances.
2.2 Simulation of the autocoded CNES GNC library After having performed Verification & functional validation of the GNC library inside the “All Software” Test Facility, automatic code generation process can be run using the Real-Time Workshop Embedded Coder®. In order to have runs of the generated C code on the mission representative processor (LEON3), a specific real-time embedded benchmark is developed. This benchmark handles RTW C code on a real-time task of the RTEMS operating system which is also mission representative.
An Ethernet data link is used between the Simulink simulation on Unix Workstation or PC, and the LEON3-FT GR-CPCI-AX2000 development board. The client is implemented inside a specific S-Function in Simulink while the server is on the LEON3-FT side. This S-Function replaces the “CNES_GNC_lib” model in the previous “All Software” Test Facility.
Figure 5: CNES GNC Hybrid Test Facility At each simulation iteration, this connection carries current GNC model inputs and benchmark control data. These data drive embedded benchmark such as initialisation and termination actions. The CNES GNC autocoded model on the board returns
corresponding outputs, and measurement data. These data contains different status such as CPU execution time and amount of RAM memory spent. The Hybrid Test Facility contains the Real-Time Core task which manages the Server task and the CPU measurements library. The autocoded GNC model is executed from the Real-Time Core Task as a software library through service functions (initialization, one step iteration, termination).
Figure 6: Hybrid Test Facility Software Architecture The following figure shows result obtained during Hybrid Tests on the embedded real-time benchmark. It gives for each activation step, the CPU time required to compute the CNES GNC autocoded algorithms considering test scenario with the worst time consumption (most consuming functions are activated). The graph has to be compared to the 20ms maximum time allocation given as prerequisite for the whole CNES GNC library (considering its 1Hz activation period by the main OBSW).
Figure 7: Worse CPU load obtained during Hybrid Tests to check real-time constraint (board oscillator
is 25 MHz, Data & Instruction Caches deactivated) This easy-to-use benchmark allows an iterative process between Simulink® code production, performance measurement on the representative board, and then Simulink® code improvement if required. Server (Ethernet) CNES_GNC_lib outputs Benchmark Meas. data CNES_GNC_lib inputs Benchmark Ctrl. data
GNC Hybrid Test Facility on LEON3-FT Autocoded CNES_GNC_lib Model (CNES GNC functions) Benchmark RT-Core CPU measurements I/O S-Func ti on Ha ndling PRISMA system models FFRF Sensor TC generator Environment Models Autocoded CNES_GNC_lib Computation Module Receive Inputs Send Outputs LEON3-FT board (RTEMS) Simulink Simulator (Unix or PC)
Such an iterative approach shall be followed soon in the development process to avoid issue when testing the full software on the board at the end of the development.
A good illustration comes from the use of Simulink state vector block “1/z delay” that shall be used with an extreme care. Indeed, even if only a small subset of the state vector shall be updated within a given time step, the whole vector is copied (full variable copy of the previous state) and then updated (copy of the incoming subset).
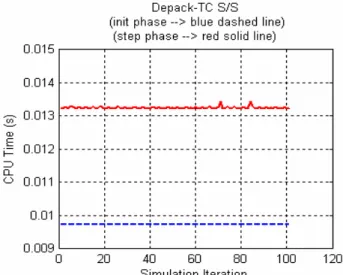
This can lead to a huge CPU consumption for big state vectors. The solution is to design the Simulink® model by replacing any inadequate big state vector with several distributed state vectors. Following this philosophy, CPU load was decreased from more than 13ms down to 6ms for the “Depack_TC” subsystem.
Figure 8: CPU Execution Time obtained for the first version of “Depack_TC” S/S
Figure 9: CPU Execution Time obtained for the upgraded version of “Depack_TC” S/S
Amongst other functionalities, this subsystem is in charge of unpacking and storing 55 possible instances of a single telecommand (characterized by an index within the TC) containing 18 doubles. The first “Depack_TC” version was based on a global state vector of 55*18 doubles. The second version upgraded after observation of the poor CPU performance was based on 55 different state vectors, each one containing 18 doubles and activated only if the incoming telecommand index was corresponding.
2.3 Results comparison analysis between “All Software” and “Hybrid” Test Facilities
In order to validate the autocoded GNC software obtained from the GNC Simulink® library, it becomes necessary to compare outputs produced from the two Test Facilities (“All Software” configuration on Windows PC and Hybrid configuration on PC-UNIX/LEON3). Here focus is made on the Target satellite absolute states estimation (3-axis position in inertial frame) as computed by the “CNES_navigation” subsystem of the CNES GNC library running a specific reference scenario.
Two configurations are considered for the “All Software” Test facility, depending on the computer used to host together the Simulink® simulator and the CNES GNC library model (Sun Sparc Solaris or PC Intelx86). Hardware details used for “All Software” and Hybrid simulations are summarised in the table below.
Test Facility
Configuration Hardware Design Hardware Name All Software
(config #1) Intelx86 IBM® Laptop All Software
(config #2) Ultra Sparc III+
Sun Blade 1000 UNIX Workstation Intelx86 IBM® Laptop Hybrid
LEON3-FT SparcV8
GR-CPCI-AX2000 Table 1: Hardware details of “All Software” and “Hybrid” simulations for the “CNES_GNC_lib” model Note: Analysed outputs are totally independent of the Simulink® simulator part. In fact, no computation is made on the simulator side for the Hybrid Test Facility. Thus, the simulator is only run on the Intelx86 design.
Differences are studied between the two Test Facilities outputs obtained for the GNC library running in open-loop mode (identical inputs for both cases) on specific designs (different compilation and execution processes). The next figure presents evolution of absolute difference on three-axis position of the “Main” satellite as computed from the “CNES_navigation” S/S of the GNC library. This experiment is realised with nominal test scenario which remains unchanged all along analysis. Two parameters which produce changes are identified: rounding direction† for float arithmetic and hardware design.
Figure 10: Absolute difference evolution on three-axis position of the “Target” satellite between “All
Software” and Hybrid Test Facilities
The maximum absolute difference value on Z axis is about 3.25e-4m which shall be compared to the order of magnitude of the estimated position (7000km). This test is realised by differencing position values obtained from “All Software” Test Facility in Windows-PC (rounding direction† set to “NEAREST”) and the Hybrid Test Facility on Windows-PC for the simulator side and on LEON3-FT for the autocoded CNES GNC library (rounding direction† set to “INF”).
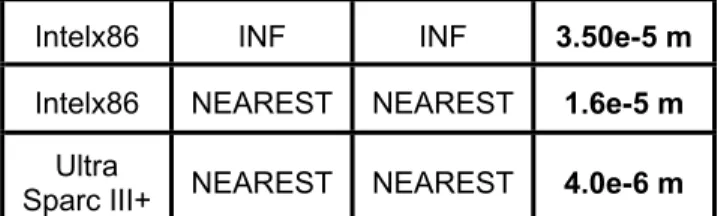
The following table summarises influence of rounding direction and hardware design.
†: Rounding direction refers to the IEEE Standard 754 Floating Point Numbers.
AS Hardware Design Rounding direction† for AS Rounding direction† for Hybrid Max difference (absolute value) Intelx86 NEAREST INF 3.25e-4 m
Intelx86 INF INF 3.50e-5 m Intelx86 NEAREST NEAREST 1.6e-5 m
Ultra
Sparc III+ NEAREST NEAREST 4.0e-6 m Table 2: influence of rounding direction and hardware design on maximum absolute difference
value
The previous results show that even with a same hardware design and rounding direction, exact reproducibility between “All Software” and Hybrid Test Facilities is not complete. Regarding GNC constraints on position accuracy of the “Target” satellite, the maximum difference position value measured is acceptable (3.25e-4m towards the order of magnitude of 7000km on position). In any case, computation environments have to be as close as possible to avoid great disparities between different hardware designs.
Æ Performance validation can’t be achieved in trying to retrieve exact results between two simulation run on different environments, but in analysing macroscopic tendencies (convergence time, …) and performance criteria (results accuracy, …).
3. Autocoded Software Quality & Reliability Analysis
After having achieved performance validation on autocoded software from functional model, an evaluation of code quality and reliability has been performed. For the PRISMA project, a static analysis is realised using PolySpace®. Interesting results are obtained such as logic code coverage and analysis of error occurred in the auto-generated code.
3.1 Auto-generated Code Quality Analysis Typical code metrics have been measured:
• STMT: Number of statements in a function’s body.
• AVGS: AVeraGe Size of Statements corresponds to the average number of operands and operators used by each of the function’s executable statements. AVGS is calculated as follows:
stat
lc
N
N
AVGS
_
)
2
1
(
+
=
[1] where: N1 is the number of operator occurrences,N2 is the number of operand occurrences, lc_stat = STMT
• VOCF: VOCabulary Frequency corresponds to the average number of times the vocabulary is used (sum of distinct operands and operators) in a component. VOCF is calculated as follows:
)
2
1
(
)
2
1
(
n
n
N
N
VOCF
+
+
=
[2] where: N1 is the number of operator occurrences,N2 is the number of operand occurrences, n1 is the number of distinct operators,
n2 is the number of distinct operands
• LEVL: Maximum nesting level in a function plus one.
• PARA: Number of a function parameters.
• VG: McCabe cyclomatic complexity number of the function. This number depends on the number of nodes of decision in the control graph with the formula:
∑
−
+
=
ision NodesOfDecin
VG
1
1
[3] where:n
iis the number of edges departing from thenode i.
• LVAR: Total number of variables declared in a function (Local VARiables).
• DRCT_CALLS: number of direct calls in a function. Different calls to the same function count for one call.
• RETU: Number of Return statements in the function (plus one if the function’s last statement is not Return statement).
• GOTO: Number of “Goto” statements. • COMF: COMments Frequency.
The following table presents metrics values obtained on the two main autocoded functions of the CNES GNC library: CNES_GNC_lib0_initialize() and CNES_GNC_lib0_step(). The first one performs model initialisation before any outputs computation (local variables and states initialisations, S/S activations). The second one contains the most important part of the autocoded Simulink model. Called every time to produce outputs, the CNES_GNC_lib0_step() is the core function and represents about 13% of the auto-generated code. Corresponding metrics values in parenthesis are given as reference from the CNES normative referential for OBSW.
Function Name Metric Name
CNES_GNC_lib0_
step CNES_GNC_lib0_initialize
STMT 3004 (< 40) 247 (< 40) AVGS 7,82 (< 9) 7,64 (< 9) VOCF 26,69 (< 5) 8,69 (< 5) LEVL 6 (< 4) 3 (< 4) PARA 0 (< 5) 1 (< 5) VG 565 (< 10) 64 (< 10) LVAR 497 (< 7) 64 (< 7) DRCT CALLS 19 (< 7) 1 (< 7) RETU 0 (< 1) 0 (< 1) GOTO 0 (0) 0 (0) COMF 0,31 (> 0,2) 0,29 (> 0,2) Table 3: RTW generated Code Quality Analysis Bold metrics values point out some disadvantages of the code generator. Indeed, autocoded functions often contain very important amount of executable statements which increase code length and introduce poor vocabulary frequency. McCabe cyclomatic complexity number and total number of local variables declared per function are directly linked to these previous metrics.
Æ Through this analysis, auto-generated code on RTW from a complex functional model can quickly become difficult to read by human despite of comments frequency. The last section of this paper describes some tools which may improve auto-generated code quality and readability.
3.2 Auto-generated Code Reliability Analysis
The PolySpace Verifier® tool allows to check software errors such as unreachable code or uncalled procedure or any possible cause of execution exception (underflow / overflow, arithmetic exception, division by zero …). From a logic call functions tree, every function of autocoded software is executed following a normal call sequence. Global variables are initialised with representative definition intervals.
Four diagnostic levels are provided at the end of the reliability analysis:
• Statement non reachable (dead line) (Gy). • Statement with reliability proved (Gr). • Statement with indeterminate reliability (O). Indeterminate reliability may indicate potential error or simple warning on specific statement. These points should be analysed manually.
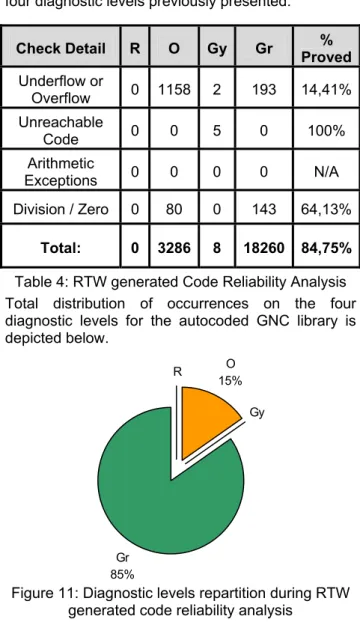
Some results on the GNC library are summarised in the following table. Occurrences of possible cause of software exception are classified with respect to the four diagnostic levels previously presented.
Check Detail R O Gy Gr Proved% Underflow or Overflow 0 1158 2 193 14,41% Unreachable Code 0 0 5 0 100% Arithmetic Exceptions 0 0 0 0 N/A Division / Zero 0 80 0 143 64,13% Total: 0 3286 8 18260 84,75% Table 4: RTW generated Code Reliability Analysis Total distribution of occurrences on the four diagnostic levels for the autocoded GNC library is depicted below. O 15% Gr 85% Gy R
Figure 11: Diagnostic levels repartition during RTW generated code reliability analysis
Auto-generated code can’t be directly declared unreliable since there is no presence of red level occurrences. However, orange level cases need to be resolved to ensure code safety. These indeterminate cases should be removed by analysing inputs intervals which are implied to the corresponding statement. For example, an indeterminate reliability case for the “Overflow / Underflow” issue on particular variable must be resolved in analysing definition interval.
Grey (Gr) level occurrences which correspond to unreachable code may appear in the generated RTW code when specific blocks are badly used. Typical example is given below for blocks which protect arithmetic operations in autocoded software. The following figure presents an unreachable code case due to a bad usage of the “Saturation” block.
Figure 12: Use of “Saturation” block in simulation model and corresponding auto-generated code In that case, the “mask_in” signal is never greater than 65535 during analysis, so the saturation condition in bold never occurs. This design could be maintained to increase model robustness (no prerequisite is made on the “mask_in” input signal). It shall be removed if functional analysis proves that the “mask_in” variable never reaches 65535. 3.3 Auto-generated Code Coverage Analysis
RTW Code coverage analysis can be realised through specific Code Coverage Tool (CCT) [1]. This tool provides coverage information for every statement of autocoded software running as a RTW S-Function. Reference scenarios from Model Validation are re-used here to obtain corresponding code coverage information. These three reference scenarios provides specific CNES GNC S/S activation such as guidance modes according nominal functional cases. These modes are triggered from dedicated telecommands defined in reference scenarios. Concatenating coverage results from each scenario allows obtaining global RTW code coverage information.
Figure 13: Autocoded GNC model code coverage analysis CNES_GNC_li b RTW S-Function Simulink (Unix or PC) PRISM A PRISMA system models FFR F FFRF Sensor TC generator FFRF commands FFRF messages commands + events PRISMA signals Environment Models states commands states
rtb_Saturation = (uint16_T)( (( mask_in ) <= ( ((uint16_T)(65535) )) ? ( mask_in ) : (
The CCT uses the automatic code generation process to insert instrumentation code which allows determining whether specific statements are executed or not. At the end of simulation, an automatic code coverage report is provided. This report contains coverage information for each line of auto-generated code.
Figure 14: Code coverage report produced by CCT On the contrary to the static analysis where unreachable code is found from logic combination drawings, the CCT provides coverage percentage which reflects executed statements when autocoded model runs on specific test scenarios. These results can be compared to the Model Coverage realised through the Simulink Verification and Validation toolbox. The same test scenarios ran previously can be reused for Model Coverage which improve code validation process reliability.
4. Autocoded Software Validation Strategy This last section proposes a validation strategy which may be applied for auto-generated code produced by the Real-Time Workshop® code generator. Each validation step which belongs to the Model-Based Design software development process is described.
Advantages gained from automatic code generation are obtained despite of code quality and readability (unitary module, generic and arbitrary variables names, low comments frequency). Time saving during code production may be lost through validation activities. An efficient validation strategy needs to be defined in order to evaluate code quality and reliability.
4.1 Model Based Software Design Rules
Automatic code production is based on use and organization of functional blocks inside simulation. Good usage and configuration of these blocks can avoid code error generation and increase code quality of final software.
Through the Model-Based On Board Software PRISMA project (MBOBSW), an interesting knowledge on functional blocks configuration has been developed. These rules define coding standard for functional blocks to prepare auto generation
process. This standard definition can improve model & code robustness, and associated documentation readability. It becomes an essential step in the software development cycle to obtain reliable auto-generated software. As presented above, these rules can introduce code redundancy and dead code lines. Despite of these, they need to be applied by any model designer as soon as possible in the auto-coded software development process. For further projects, a specific blocks library which implements directly these design rules may be defined
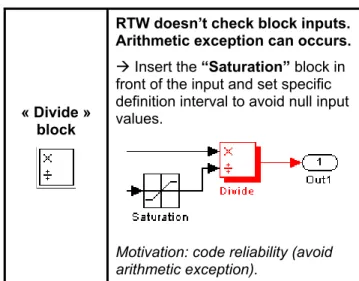
The following table gives an example of one design rule on usual functional block.
« Divide » block
RTW doesn’t check block inputs. Arithmetic exception can occurs. Æ Insert the “Saturation” block in front of the input and set specific definition interval to avoid null input values.
Motivation: code reliability (avoid arithmetic exception).
Table 5: Examples of Design Rules for MBOBSW. 4.2 Model-Based Software Functional Validation In order to realise validation operation before code generation operation, the simulation environment proposes a specific toolbox which allows functional verification of functional models.
With this toolbox, user can specify requirements from preliminary design studies on any targeted S/S in the simulation model. These requirements can be checked through unit tests during simulation and are automatically reported as comments into the auto-generated code.
After checking requirements, model designer can handle functional coverage which points out every non executed blocks and S/S. Several metrics are provided such as design complexity estimation (cyclomatic complexity), condition / decision coverage (decision tree from logic combinatory of specific blocks), and MC/DC tests (from the RTCA DO-178B standard). Coverage report which corresponds to specific test scenario is produced after simulation. Metrics values are provided for each block and S/S of simulated model. Different runs can be compiled to obtain global coverage results.
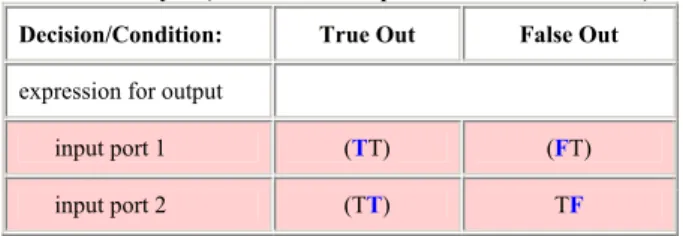
The next figure presents a coverage metric (MC/DC) for a particular logic block.
Metric Coverage Cyclomatic Complexity 0
Condition (C1) 50% (2/4) condition outcomes MCDC (C1) 0% (0/2) conditions reversed the outcome MC/DC analysis (combinations in parentheses did not occur)
Decision/Condition: True Out False Out
expression for output
input port 1 (TT) (FT) input port 2 (TT) TF
Figure 15: Model coverage report
Every functional cases need to be tested through dedicated scenario to obtain complete model functional coverage. The fine granularity of this tool allows easy validation of each model’s component in relation of corresponding specifications.
To conclude, functional model validation is an essential step before any validation operation on the auto-generated code. This “Model In the Loop” (MIL) phase ensures specification verification for every block and S/S. Test scenarios are validated by corresponding functional model coverage.
4.3 Auto-generated Code Functional Validation Three main validation phases can be distinguished depending on different configurations:
• The “Software In the Loop” (SIL) phase is the first step for code functional validation. It describes auto-generated code implementation into Simulink®. The code generator provides capability to produce an “RTW S-Function” to use auto-generated code into a test harness on Simulink®. Thus, previous integration tests of the “MIL” test phase can be replayed here. • The “Processor In the Loop” phase occurs after
the “SIL” phase to insert representative processor in the previous test harness. This phase is required when CPU load of real-time auto-coded software needs to be monitored on the mission representative processor. The “PIL” phase is compliant to the European Coordination for Space Standardisation (ECSS) E-40 and Q-80 standards regarding requirements to test OBSW on the mission representative processor.
• Finally, the “Hardware In the Loop” (HIL) phase ends code functional validation in performing tests on benchmark with hardware representative equipments (i.e. hardware sensors, processor, and actuators for GNC module). The same test scenarios of the “MIL” phase can be adapted for the “PIL” and “HIL” phases considering that no exact outputs can be retrieved due to different test environments. 4.4 Model-Based Software Development Life-cycle To conclude on this validation strategy, proposal on a possible Model-Based Software Development cycle can be made. This V life-cycle contains every validation phases describes here. Comparison between model-based and traditional software development plans is provided with explanations on what benefits can be get in term of time.
Figure 16: Model-Based Development Cycle Only actions enclosed by dashed lines require development software engineer to be achieved. Others are done through automated processes On Matlab / Simulink®. Red lightning represents time saving action compared to corresponding ones in traditional development cycle. If automatic code generation can easily save time than the traditional one, the “Software In the Loop” and “Processor In the Loop” phases have low time consumptions as well due to reuse of previous test harnesses. In fact, the “Model Design” phase in association to MIL and requirements validation phases need greater amount of time than the traditional development plan where System and Modules design and specification phases happened. The “Model Design” phase is particularly important on Model-Based Development cycle since code reliability depends of the initial functional model. This new development cycle is interesting in term of time saving despite of its dependence of private and expensive development environment.
Functional Specifications & Requirements Model Design Code Auto Generation MIL SIL PIL Check Requirements HIL Static Analysis + Code Coverage
5. Conclusion
Embedded Autocoded Software generation are growing up better and better in aerospace industry which leads to a new development and validation approach for OBSW. Thus, an important knowledge on validation of autocoded embedded software for critical application is required. Actions realised through the SMART1, PROBA, and soon PRISMA space missions give more confidence and experience on the Model-Based Design domain before applying it to future large scaled projects.
6. Acknowledgement
The authors would like to thank the whole PRISMA project team at CNES and CS-SI for produced results and positive cooperation on this paper.
7. References
[1] Mark Walker: "Code Coverage Tool", Matlab
Central, The Mathworks Ltd
www.mathworks.com/matlabcentral/fileexchange/lo adFile.do?objectId=14284
8. Glossary
AS: “All Software” Test Facility..
CCT: Code Coverage Tool.
CNES: Centre National d’Etudes Spatiales.
ECSS: European Coordination for Space
Standardisation.
ESA: European Space Agency.
FFIORD: Formation Flying In-Orbit Ranging
Demonstration.
FFRF: Formation Flying Radio Frequency.
GNC: Guidance, Navigation, & Control.
HIL: Hardware In the Loop.
IV&V: Independent Verification & Validation.
MIL Model In the Loop.
MBOBSW: Model Based On Board Software.
OBSW: On-Board Software.
PIL: Processor In the Loop.
PRISMA: Prototype Research Instruments and
Space Mission Technology Advancement.
RTEMS: Real-Time Executive for Multiprocessor
Systems.
RTW-EC: Real-Time Workshop Embedded Coder.
SIL: Software In the Loop.
SLO: Satellite Local Orbit.
SNSB: Swedish National Space Board.
S/S: Subsystem.