HAL Id: inserm-00483521
https://www.hal.inserm.fr/inserm-00483521
Submitted on 14 May 2010
HAL is a multi-disciplinary open access
archive for the deposit and dissemination of
sci-entific research documents, whether they are
pub-lished or not. The documents may come from
teaching and research institutions in France or
abroad, or from public or private research centers.
L’archive ouverte pluridisciplinaire HAL, est
destinée au dépôt et à la diffusion de documents
scientifiques de niveau recherche, publiés ou non,
émanant des établissements d’enseignement et de
recherche français ou étrangers, des laboratoires
publics ou privés.
network patterns in developing neocortex.
Camille Allène, Adriano Cattani, James Ackman, Paolo Bonifazi, Laurent
Aniksztejn, Yehezkel Ben-Ari, Rosa Cossart
To cite this version:
Camille Allène, Adriano Cattani, James Ackman, Paolo Bonifazi, Laurent Aniksztejn, et al..
Se-quential generation of two distinct synapse-driven network patterns in developing neocortex.. Journal
of Neuroscience, Society for Neuroscience, 2008, 28 (48), pp.12851-63.
�10.1523/JNEUROSCI.3733-08.2008�. �inserm-00483521�
Cellular/Molecular
Sequential Generation of Two Distinct Synapse-Driven
Network Patterns in Developing Neocortex
Camille Alle`ne, Adriano Cattani, James B. Ackman, Paolo Bonifazi, Laurent Aniksztejn, Yehezkel Ben-Ari, and
Rosa Cossart
Institut de Neurobiologie de la Me´diterrane´e, Inserm U901, Universite´ de la Me´diterrane´e, 13273 Marseille cedex 9, France
Developing cortical networks generate a variety of coherent activity patterns that participate in circuit refinement. Early network
oscil-lations (ENOs) are the dominant network pattern in the rodent neocortex for a short period after birth. These large-scale calcium waves
were shown to be largely driven by glutamatergic synapses albeit GABA is a major excitatory neurotransmitter in the cortex at such early
stages, mediating synapse-driven giant depolarizing potentials (GDPs) in the hippocampus. Using functional multineuron calcium
imaging together with single-cell and field potential recordings to clarify distinct network dynamics in rat cortical slices, we now report
that the developing somatosensory cortex generates first ENOs then GDPs, both patterns coexisting for a restricted time period. These
patterns markedly differ by their developmental profile, dynamics, and mechanisms: ENOs are generated before cortical GDPs (cGDPs)
by the activation of glutamatergic synapses mostly through NMDARs; cENOs are low-frequency oscillations (
⬃0.01 Hz) displaying slow
kinetics and gradually involving the entire network. At the end of the first postnatal week, GABA-driven cortical GDPs can be reliably
monitored; cGDPs are recurrent oscillations (
⬃0.1 Hz) that repetitively synchronize localized neuronal assemblies. Contrary to cGDPs,
cENOs were unexpectedly facilitated by short anoxic conditions suggesting a contribution of glutamate accumulation to their generation.
In keeping with this, alterations of extracellular glutamate levels significantly affected cENOs, which are blocked by an enzymatic
glutamate scavenger. Moreover, we show that a tonic glutamate current contributes to the neuronal membrane excitability when cENOs
dominate network patterns. Therefore, cENOs and cGDPs are two separate aspects of neocortical network maturation that may be
differentially engaged in physiological and pathological processes.
Key words: development; GABA; imaging; network; cortex; synchrony
Introduction
Spontaneous correlated neuronal activity is the hallmark of
developing networks and plays a central role in their
construc-tion (Katz and Shatz, 1996; Khazipov et al., 2004; Cang et al.,
2005; Kandler and Gillespie, 2005; Nicol et al., 2007). A variety
of coordinated activity patterns have been described in
devel-oping neocortical structures from correlated pairs of neuronal
precursor cells (Owens and Kriegstein, 1998) to gap
junction-synchronized cortical columns (Yuste et al., 1992; Kandler and
Katz, 1998; Dupont et al., 2006). Clarifying the underlying
mechanisms and the spatiotemporal interactions between
these diverse network patterns is crucial toward
understand-ing their ultimate function in the construction of cortical
maps.
Two synapse-driven network patterns have been extensively
described in immature cortical structures: (1) Cortical early
net-work oscillations (cENOs) are large-scale oscillatory calcium
waves, occurring immediately after birth at low frequency and
providing most of the coherent activity in the developing rodent
neocortex (Garaschuk et al., 2000). Cortical ENOs require action
potentials and are driven by NMDA and AMPA receptors but not
GABA
Areceptors (Garaschuk et al., 2000; Corlew et al., 2004;
McCabe et al., 2006). (2) Giant depolarizing potentials (GDPs)
are the earliest synapse-driven network pattern in the developing
hippocampus (Ben-Ari et al., 1989; Garaschuk et al., 1998; Cre´pel
et al., 2007). They occur a few days after birth in rodents at
mod-erate frequency (
⬃0.1 Hz). They are driven by GABAergic
trans-mission and disappear with the excitatory/inhibitory shift in the
actions of GABA (Ben-Ari et al., 1989; Garaschuk et al., 1998;
Tyzio et al., 2007).
Relying on the apparent similarities between these patterns, it
was concluded that cENOs were the cortical counterpart to the
hippocampal GDPs but generated by glutamatergic synapses,
which would play a more critical role in the developing neocortex
(“cortical GDPs”) (McCabe et al., 2007). Therefore GDPs and
cENOs would reflect intrinsic differences between brain
struc-tures. Yet, GABA also excites immature neocortical neurons
(Yuste and Katz, 1991; Owens et al., 1996; Dammerman et al.,
2000; Garaschuk et al., 2000; Marandi et al., 2002; Yamada et al.,
2004; Tyzio et al., 2006; Ben-Ari et al., 2007) and the possibility
that cENOs and GDPs could be separate network patterns
se-Received July 31, 2008; revised Sept. 30, 2008; accepted Oct. 5, 2008.
This work was supported by grants from Inserm, the Ville de Marseille and Re´gion Provence-Alpes-Coˆte d’Azur, and the Agence Nationale Recherche (Programme Jeunes Chercheurs). R.C. is funded by the Centre National de la Recherche Scientifique. C.A. is funded by the Ministe`re de l’Education Nationale et de la Recherche. P.B. is funded by the Marie Curie Fellowship. We thank Sonja Martin for her contribution to the supplemental movies and Dr. Milh for helpful discussions.
Correspondence should be addressed to Dr. Rosa Cossart, Institut de Neurobiologie de la Me´diterrane´e, Inserm U29, Parc Scientifique de Luminy, BP.13, 13273 Marseille cedex 9, France. E-mail: [email protected].
DOI:10.1523/JNEUROSCI.3733-08.2008
quentially dominating the developing
neocortex has not been excluded.
To test this hypothesis we monitored
the spatiotemporal patterns of neuronal
activities in slices of rat somatosensory
cortex between embryonic to postnatal
stages using multibeam two-photon
mi-croscopy, on-line analysis, and targeted
single-cell and field potential recordings.
We show that the immature neocortex
produces at birth cENOs and cortical
syn-chronous plateau assemblies [cSPAs, i.e.,
synchronous calcium plateaus associated
with intrinsic membrane potential
oscilla-tions in restricted groups of neurons,
iden-tical to the recently described activity in
the hippocampus (Cre´pel et al., 2007)],
then GABA-driven GDPs that are similar
to hippocampal GDPs. These patterns
dif-fered in their spatiotemporal dynamics,
intracellular correlates, developmental
profile, and pharmacological features.
In-deed, cENOs were generated by the
activa-tion of NMDARs and favored by higher
extracellular glutamate levels in contrast to
cGDPs which preferentially involved
GABAergic transmission. Remarkably, a
tonic glutamate current excited neurons at
the stage when cENOs were preferentially
observed. Finally, we show that cENOs
and cGDPs present a differential
sensitiv-ity to anoxic conditions since the
occur-rence of cGDPs was impaired while cENOs
were transiently increased, in
anoxic/agly-cemic or low rate saline perfusion. We
conclude that the neocortex successively
generates two coherent activity patterns,
first cENOs then cGDPs. This
develop-mental sequence results in differential
sen-sitivity to ischemia during maturation.
Materials and Methods
Slice preparation and calcium imaging. Coronal
and horizontal slices of somatosensory cortex (400 – 450m thick) were prepared from E20 to 9-d-old (P9) Wistar rats using a Microm tis-sue slicer (International) in ice-cold oxygen-ated modified artificial CSF (mACSF: 0.5 mM
CaCl2and 7 mMMgSO4; NaCl replaced by an
equimolar concentration of choline). Most of the experiments were per-formed on horizontal slices since the incidence of calcium waves (cE-NOs) was critically diminished in coronal slices (see Table 1) (Garaschuk et al., 2000; Corlew et al., 2004; Sun and Luhmann, 2007). Slices were then transferred for rest (⬃1 h) in oxygenated normal ACSF containing (in mM): 126 NaCl, 3.5 KCl, 1.2 NaH2PO4, 26 NaHCO3, 1.3 MgCl2, 2.0
CaCl2, and 10D-glucose, pH 7.4. For AM-loading, slices were incubated
in a small vial containing 2.5 ml of oxygenated ACSF with 25l of a 1 mM
fura-2 AM solution (Molecular Probes; in 100% DMSO) for 20 –30 min. Slices were incubated in the dark, and the incubation solution was main-tained at 35°–37°C. The fraction of labeled cells was constant for all age groups included in the study (at P1: 6⫾ 3% cells were visible in trans-mitted light but not in the calcium fluorescence image, n⫽ 1391 cells, vs 5⫾ 1% at P8, n ⫽ 888 cells, p ⫽ 0.9). Unless indicated otherwise, slices were perfused at a rate of 4 ml/min with continuously aerated (95% O2/5% CO2) normal ACSF at 35–37°C. Imaging was performed with a
multibeam two-photon laser scanning system (Trimscope-LaVision Bio-tec) coupled to an Olympus microscope as previously described (Cre´pel et al., 2007). Images were acquired through a CCD camera (La Vision Imager 3QE), which typically resulted in a time resolution of⬃100 ms (2⫻ 2 binning, pixel size: 600 nm). Slices were imaged using a low-magnification, high-numerical-aperture objective (20⫻, NA 0.95, Olympus). The size of the imaged field was typically 430⫻ 380m2.
Imaging depth was on average 80m below the surface (range: 50–100 m).
Analysis. As previously described (Cre´pel et al., 2007), analysis of the
calcium activity was performed with custom-made software written in Matlab (MathWorks). This program aimed at the automatic identifica-tion of loaded cells and at measuring their fluorescence as a funcidentifica-tion of time. The calcium signal of each cell was the average fluorescence within the contour of that cell, measured as a function of time.
The entire procedure could be performed on-line sufficiently quickly
Table 1. Quantitative comparison between cENOs and cGDPs in cortical slices
cENO cGDP Age E20 Incidence 0/11 0/11 P0 –P4 Amp 38⫾ 3 (n ⫽ 53)
Freq (per min) 2.45⫾ 0.3 (n ⫽ 53)
Incidence 53/110 1/3
P5–P9
Amp 41⫾ 13 (n ⫽ 3)* 13⫾ 3 (n ⫽ 63)
Freq (per min) 3.25⫾ 2.26 (n ⫽ 3)* 8.4⫾ 0.7 (n ⫽ 63)
Incidence 3/48 63/137
Orientation of slices Coronal
Amp 47⫾ 29 (n ⫽ 2)* 7⫾ 1 (n ⫽ 12)
Freq (per min) n.a. 6.81⫾ 1.07 (n ⫽ 12)
Incidence 2/42 12/27
Horizontal
Amp 39⫾ 3 (n ⫽ 56)* 16⫾ 1 (n ⫽ 64)
Freq (per min) 2.55⫾ 0.34 (n ⫽ 56)* 9.2⫾ 0.8 (n ⫽ 64)
Incidence 56/158 64/140 Pharmacology Bicuculline Amp (% cont) 111⫾ 25 (n ⫽ 9)* 9⫾ 7 (n ⫽ 9) Freq (% cont) 153⫾ 72 (n ⫽ 9)* 0 (n⫽ 9) D-APV Amp (% cont) 13⫾ 6 (n ⫽ 13)* 54⫾ 21 (n ⫽ 5) Freq (% cont) 22⫾ 1 (n ⫽ 13)* 70⫾ 5 (n ⫽ 5) D-APV⫹ NBQX Amp/cont (%) 7⫾ 7 (n ⫽ 14)* 80⫾ 17 (n ⫽ 6) Freq/cont (%) 5⫾ 1 (n ⫽ 14)* 14⫾ 14 (n ⫽ 6)
Calcium events kinetics
Rise time (s) 1.02⫾ 0.02 (n ⫽ 1000)* 0.230⫾ 0.005 (n ⫽ 1000) Decay (s) 5.32⫾ 0.2 (n ⫽ 1000)* 1.02⫾ 0.2 (n ⫽ 1000) Synchronicity duration (s) 0.97⫾ 0.11 (n ⫽ 1000)* 0.25⫾ 0.05 (n ⫽ 1000) Patch-clamp recordings Amplitude (mV) 12.8⫾ 2.5 (n ⫽ 9) 12.4⫾ 4.4 (n ⫽ 4) Duration (s) 2.4⫾ 0.8 (n ⫽ 9)* 0.28⫾ 0.0 (n ⫽ 4) Rise time (s) 0.6⫾ 0.2 (n ⫽ 9)* 0.05⫾ 0.0 (n ⫽ 4) AP number 3.5⫾ 1.5 (n ⫽ 9) 4.2⫾ 0.0 (n ⫽ 4) Firing frequency (Hz) 1.9⫾ 0.5 (n ⫽ 9)* 15.4⫾ 0.5 (n ⫽ 4) Frequency (per min) 1.6⫾ 0.5 (n ⫽ 9)* 8.2⫾ 0.8 (n ⫽ 4) Field potential recordings
Amplitude (V) 142⫾ 58 (n ⫽ 5) 43⫾ 9 (n ⫽ 7)
Duration (s) 2.7⫾ 0.3 (n ⫽ 5)* 0.5⫾ 0.4 (n ⫽ 7)
Peak frequency (Hz) 15.3⫾ 3.9 (n ⫽ 5) n.a.
Rate of occurrence (Hz) 0.010⫾ 0.007 (n ⫽ 5)* 0.15⫾ 0.03 (n ⫽ 7)
MUA (Hz) 28.6⫾ 7.8 (n ⫽ 5) 14.6⫾ 2.5 (n ⫽ 7)
Amp, Amplitude; AP, action potential; Freq, frequency; n.a., not applicable. See Materials and Methods. Bicuculline, 10M,D-APV, 40M; NBQX, 10M. *p⬍ 0.05 compared with cGDPs.
to identify cells for targeted patch-clamp recordings. Signal-processing algorithms of MiniAnalysis software (Synaptosoft) were used to detect the onsets and offsets (time of half-amplitude decay) of calcium signals within the traces of individual cells. Active cells are neurons exhibiting at least one calcium event within the period of recording. Kinetics analysis of individual calcium events was performed using the MiniAnalysis pro-gram. Single and averaged events were fully characterized: rise times (10 –90%), amplitudes, and decay time constants were calculated (single exponential fit). For SPA-associated events we chose to calculate the duration of individual calcium plateaus (time between the event onset and the start of the decay) instead of rise and decay times because the values of both parameters were negligible compared with the duration of the plateau. To compute the activity correlation of two cells, the onset of each event was represented by a Gaussian (s⫽ 1 frame, to allow some jitter). The inner product of the resulting values was then calculated. The significance of each correlation value was estimated by direct comparison with a distribution computed from surrogate data sets, in which the events were randomly reshuffled in time. To quantify synchronous ac-tivity patterns (i.e., cENOs and cGDPs), we used four parameters: quency, incidence, amplitude, and duration of synchronicity. The fre-quency of a network pattern was the averaged time interval between two peaks of synchronous activity. The incidence was the fraction of slices in which it could be recorded at least once. The amplitude of a network pattern in a given movie was the average of the maximum of cells coactive in each peak of synchrony across the movie. To identify peaks of synchro-nous activity that included more cells than expected by chance, we used interval reshuffling (randomly reordering of intervals between events for each cell) to create a set of surrogate event sequences. Reshuffling was performed 1000 times for each movie, and a surrogate histogram was constructed for each reshuffling. The threshold corresponding to a sig-nificance level of p⬍ 0.05 was estimated as the number of coactive cells exceeded in a single frame in only 5% of these histograms. This threshold was used to calculate the duration of a synchronous activity pattern that is the number of successive frames for which the number of coactive cells was superior to threshold. Experimental values are given as means⫾ SEMs. Student’s t test and2test were used for statistical comparisons.
p⬍ 0.05 was considered significant.
Electrophysiology. Neurons were recorded using the patch-clamp
tech-nique in the whole-cell configuration. For voltage-clamp the composi-tion of the intracellular solucomposi-tion was: 120 mM Cs-gluconate, 10 mM
MgCl2, 0.1 mMCaCl2, 1 mMEGTA, 5 mMNa2adenosine triphosphate, 10
mMHEPES. With this solution glutamate-R-mediated postsynaptic
cur-rents (PSCs) reversed at⫹10 mV while GABAAR-mediated PSCs
re-versed at⫺60 mV. Liquid junction potential value was ⫺16.8 mV, but no correction was applied. For current clamp, the intracellular solution was: 130 mMK-methylSO4, 5 mMKCl, 5 mMNaCl, 10 mMHEPES, 2.5 mM
Mg-ATP, and 0.3 mMGTP. No correction for liquid junction potential
was applied.
The osmolarity was 265–275 mOsm, pH 7.3. Microelectrode resis-tance was 4 – 8 M⍀. Uncompensated access resistance was monitored throughout the recordings. Values⬍20 M⍀ were considered acceptable and the results were discarded if it changed by⬎20%. Whole-cell mea-surements were filtered at 3 kHz using a patch-clamp amplifier (HEKA, EPC10). Recordings were digitized on-line (20 kHz) with a Labmaster interface card to a personal computer and acquired using Axoscope 7.0 software (Molecular Devices). Synchronization between optical and elec-trical signals was achieved by feeding simultaneously the Labmaster in-terface card with the trigger signals for each movie frame and the electro-physiological recordings. Neurons were also patch clamped without dye loading. In these conditions, we found electrophysiological events corre-sponding to GDPs or ENOs similar to which we found in dye loading conditions. Recordings were analyzed using the MiniAnalysis software (Synaptosoft). Extracellular recordings were performed with a glass pi-pette (⬃1 M⍀) filled with ACSF and the signal was recorded with a DAM80 amplifier (WPI). Spectrograms were calculated using the func-tion “spectrogram” of Matlab (MathWorks).
Pharmacology. Antagonists for GABAAand ionotropic glutamate
re-ceptors mentioned in this manuscript are bicuculline (10M), gabazine (10M), NBQX (10M), andD-APV (40M). All drugs except TTX
(Tocris) were purchased from Sigma. As previously described (Min et al., 1998), GPT (porcine heart, 115 kDa dimer) was dialyzed for 3 h with a 10 kDa cutoff membrane (Slide-A-Lyzer, Pierce Chemical) before the ex-periments. We confirmed that GPT was acting by scavenging glutamate by comparing the current evoked by pressure application of glutamate (1 mM) onto the same neuron recorded in voltage clamp at⫹40 mV in the
absence or in the presence of GPT 5 U/ml (together with pyruvate 2 mM)
in the puff pipette. As expected, currents evoked in the presence of the glutamate scavenger were significantly smaller (n⫽ 12, p ⬍ 0.05, data not shown). Finally, we also confirmed that GPT did not affect network activity in the absence of pyruvate (frequency and amplitude of cENOs under GPT 5 U/ml (without pyruvate) were not significantly different relative to control: 140⫾ 4%, p ⫽ 0.4 and 87 ⫾ 2%, p ⫽ 0.6, respectively,
n⫽ 3).
Results
Maturation of population coherence in neocortical slices
We used multibeam two-photon imaging in horizontal slices
in-cluding the primary somatosensory cortex, loaded with a calcium
indicator (fura-2 AM), to record movies of spontaneous activity
in rats aged between E20 and P9. We focused on the
somatosen-sory area (39,166 cells, 238 cells per movie on average; 4000
frames/movie, 100 ms/frame). Analysis was performed using
cus-tom software to measure fluorescence changes in each cell and
mark the onset and offset of individual calcium transients (Fig. 1)
(see also Cre´pel et al., 2007). Four maturation steps of
spontane-ous neuronal activity could be distinguished:
At embryonic stages (E20), only a minority of cells were active
(9
⫾ 0.02%, n ⫽ 11 slices, 3190 cells). Most activity consisted of
sporadic calcium spikes (6.3
⫾ 1.6 s duration, n ⫽ 433 events, Fig.
1) that were poorly correlated between neurons (0.07% cell pairs
significantly correlated, see Materials and Methods).
Current-clamp recordings from active neurons revealed that these calcium
events corresponded to immature action potentials (Fig. 1).
Around birth (P0 –P3), more cells generated calcium spikes
but another pattern appeared in approximately one third of
ac-tive cells (32
⫾ 3% at P0, n ⫽ 41 slices) consisting of synchronous
calcium plateaus (duration: 18.5
⫾ 2.3 s, 0.02 ⫾ 0.001 Hz, n ⫽
493 events, significantly different from calcium spikes in terms of
duration, p
⫽ 0.009; 14% cell pairs significantly correlated) (Fig.
1). These were reminiscent of synchronous plateau assemblies
(SPAs), recently described in the hippocampus (Fig. 1) (Cre´pel et
al., 2007). Targeted current-clamp recordings showed that these
plateaus corresponded to recurrent burst discharges when cells
were recorded at V
rest(n
⫽ 5 cells) (Fig. 1). Like hippocampal
SPAs, cortical SPAs (cSPAs) were not synapse driven since they
were not affected by blocking AMPA/KARs, NMDARs, and
GABA
ARs (fraction of SPA-cells in NBQX 10
M,
D-APV 40
M,
and bicuculline 10
M, was 133
⫾ 14% of control, n ⫽ 25 slices,
p
⫽ 0.15, data not shown). They were in contrast blocked by
sodium and L-type calcium channel antagonists (to 15
⫾ 6% of
control in the presence of TTX 1
Mand nifedipine 10
M, n
⫽ 3
slices, p
⫽ 0.003, data not shown). Finally, as in the hippocampus,
the emergence of cSPAs was controlled by signaling molecules
involved during delivery since treatment with oxytocin (1
M) of
slices from rat fetuses (E20) having been initially intracardially
perfused with ACSF to wash out the endogenous hormone,
caused an almost two-fold increase in the fraction of SPA-cells to
levels comparable to birth stages (37
⫾ 6% of SPA-cells at E20 in
the presence of OT, vs 18
⫾ 2% of SPA-cells in control at E20, n ⫽
25 movies, 5369 cells, p
⫽ 0.03, data not shown). In contrast, the
fraction of active cells relative to the total number of imaged
neurons was not affected by the hormone (active cells: 9
⫾ 2% at
E20 control vs 8
⫾ 2% at E20 in OT, p ⫽ 0.67).
During the same developmental period as cSPAs were
ob-served (P0 –P3), we could image, in almost half of the slices,
synchronous waves of calcium activity slowly invading the entire
network and sharing spatiotemporal dynamics comparable to
those previously described for cENOs (Figs. 1, 2, Table 1;
supple-mental Movie 2, available at www.jneurosci.org as supplesupple-mental
material) (Garaschuk et al., 2000; Corlew et al., 2004; Sun and
Luhmann, 2007). Indeed, they were associated with calcium
events having slow kinetics (Fig. 3, Table 1) occurred at the same
rate (1.5
⫾ 0.3 waves/min on average) during the same
develop-mental period (P0 –P5) (see Fig. 3), and could be detected in
almost all neurons within a given cortical region (average fraction
of active cells involved in cENOs was 81
⫾ 3%). Even neurons
involved in cSPAs tended to synchronize within ENOs (on
aver-Calcium spike
A
B
10mV 500ms 10s 20%DF/F 100 200 0C
D
1
cSPA
1s 10mV 0 100 10s 10%DF/F2
200cGDP
10s 20%DF/F 0 40 80 120 2s 20mV4
3
10s 20%DF/FcENO
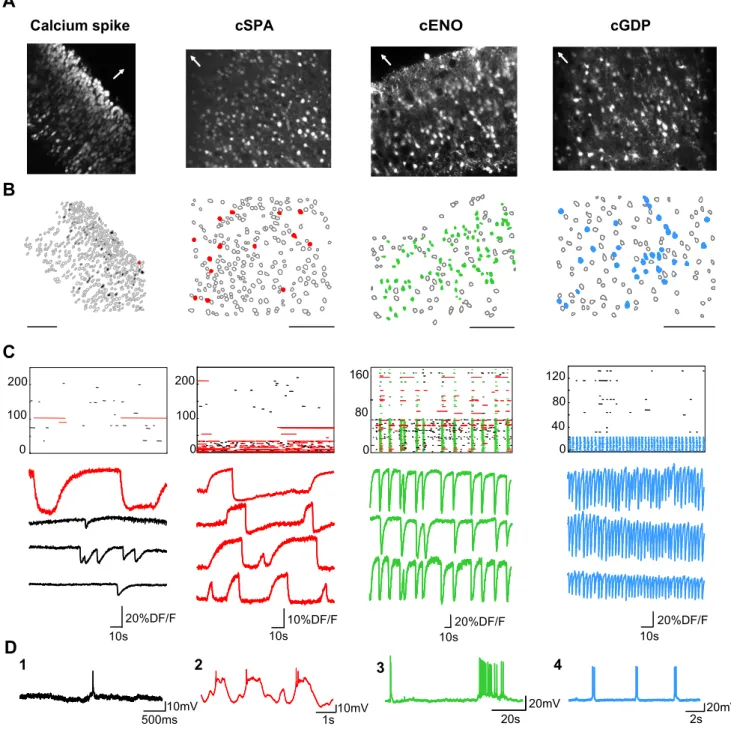
20s 20mV 160 80 0Figure 1. Multibeam two-photon imaging of the four maturation steps of spontaneous neuronal activity in somatosensory cortical slices from embryonic stages to first postnatal days. A, Two-photon calcium fluorescence images of rat somatosensory cortical slices of the four types of spontaneous activity: calcium spikes (left), cortical synchronous plateau assemblies (cSPAs), cortical early network oscillations (cENOs), and cortical giant depolarizing potentials (cGDPs, right) recorded at E20, P0 (cortical plate), P3 (cortical plate, horizontal slice), and P7 (deeper layers), respectively. White arrows indicate direction of pial surface. B, Automatically detected contours of the cells from the fluorescence images: open contours indicate silent cells, black filled contours indicate cells producing calcium spikes, red filled contours are cSPAs-cells, green filled contours are cENO cells, and blue filled contours are cGDPs-cells; scale bar: 100m. C, Raster plots of the activity from the four slices illustrated in A in control ACSF. Each row represents a single cell and each horizontal line the duration of detected calcium transients. Four populations of events can be distinguished as shown by representative fluorescence traces below the raster plots (black: calcium spikes; red: calcium plateaus i.e., cSPA-events; green: cENO-events; blue: cGDP-events). D, Current-clamp recordings (Vrestof approximately⫺60 mV) in four representative neurons displaying the four types of calcium activities described above. D1, A calcium spike recorded in a neuron at E20. D2, Red:
cSPA recorded in a neuron at P0. Note that calcium plateaus are associated to rhythmic membrane potential oscillations as SPAs described in the hippocampus. D3, Green: a cortical ENO. D4, Blue: three successive cortical GDPs.
A
1
Frame #2
B
550 600 650 700 750 800 850 900 950 10 2 m i n 0 50 100 e v i t c A ) % ( 0 10 20 20% D F /F 10 sC
cENO cG
DP
1
1
2 m i n 0 50 100 100 150 200 250 300 350 400 450 500 20% D F /F 10 s 0 50 1002
2
l l e C # MUA 50 µV 1s 0 40 80 120 FP 1 m i n 0 10 20 ) z H ( A U M 100 µV 10 s 1s 50 µV 40 0 120 200 l l e C # F r n e u q e y c FP 0 100 0 1 u . a . z H ( )3
3
e v i t c A ) % ( e v i t c A ) % ( e v i t c A ) % (Figure 2. Cortical ENOs and GDPs display two distinct spatiotemporal dynamics. A1, A2, Contour maps of seven successive movie frames taken from a P3 (A1) and a P8 (A2) horizontal somatosensory slice to illustrate the slower dynamics of cENOs (A1) compared with cGDPs (A2). Black filled contours indicate cells active in frames where network synchronization reaches significance threshold (see Materials and Methods). One frame every 150 ms; scale bar: 100m B1, Histogram indicating the fraction of imaged cells detected as being active for each movie frame in a P1 horizontal somatosensory cortical slice. Each peak of the histogram represents a cENO. Calcium fluorescence traces of four cells implicated in the two cENOs illustrated in the above histogram on an expanded time scale. B2, Simultaneous field potential recording (FP) and calcium imaging (raster plot) during a cENO occurring in a P3 horizontal cortical slice. Raster plot indicates the onset of each calcium event in all imaged cells as a function of time. Note the strong correlation between field potential oscillations and multineuron calcium activity. B3, Spectrogram of the FP oscillation associated to the cENO illustrated in B2. a.u.: arbitrary units. C1, C2, Same as A1 and A2 but in a P6 somatosensory horizontal slice where cGDPs could be recorded (small peaks of synchrony). Note that peaks associated with cGDPs are much smaller and more frequent than those associated with cENOs (B2). They involve fewer cells as shown in the C2 raster plot. C3, Cortical GDPs are not associated with any remarkable oscillatory pattern but correspond to a significant increase in MUA as shown by the frequency histogram of MUA as a function of time and by the MUA recording trace below.
age 71
⫾ 4% of SPA-cells were involved in
cENOs in the form of synchronous
cal-cium plateaus, n
⫽ 6). Interestingly, in
contrast to other patterns described here,
the incidence of these waves was
signifi-cantly affected by the slice orientation (see
Table 1 and Materials and Methods).
These calcium waves were tightly
corre-lated to changes in the field potential and
increased multiunit activity (see Table 1,
Fig. 2). Targeted current-clamp
record-ings performed while imaging indicated
that these waves were associated with
slowly rising and prolonged membrane
potential depolarizations (Fig. 3, Table 1)
whereas voltage clamp recordings
indi-cated that they were associated with
in-creased synaptic activity (n
⫽ 11) (see Fig.
5A3). Most importantly, these calcium
os-cillations presented the same
pharmaco-logical profile as cENOs since their
occur-rence was not affected by GABA
AR
blockade ( p
⫽ 0.66) (Table 1, Fig. 4), but
completely prevented by AMPA/KAR and
NMDAR antagonists (Table 1) ( p
⫽ 0.08).
Therefore the large calcium waves and
field potential oscillations we recorded,
corresponded to the previously described
cENOs (Garaschuk et al., 2000). We have
now provided the intracellular correlates
for these network oscillations in
voltage-and current-clamp recordings.
Last, starting from P6, a coherent
pat-tern reminiscent of the GDPs initially
de-scribed in the hippocampus (Ben-Ari et
al., 1989), was recorded in almost half of
the slices (46%, n
⫽ 137 slices, see also
Table 1; supplemental Movie 1, available
at www.jneurosci.org as supplemental
ma-terial) while the occurrence of cSPAs
sig-nificantly declined (SPA-cells: 16
⫾ 3% of
active cells in slices where cGDPs could be
recorded, n
⫽ 24 movies, p ⫽ 0.0002) (Fig.
3). Pharmacological and
electrophysiolog-ical observations indicated that this
pat-tern indeed corresponded to GDPs.
Corti-cal
GDPs
consisted
of
recurrent
synchronous calcium oscillations
occur-ring on average at 0.1 Hz (0.14
⫾ 0.01 Hz,
see Table 1) and involving a
subpopula-tion of neurons (13
⫾ 3% neurons
in-volved on average, n
⫽ 24 slices). They
were often confined within deeper cortical layers (Fig. 1) and
always associated to fast calcium events (see Table 1, Fig. 3)
oc-curring simultaneously within one movie frame (i.e.,
⬍100 ms)
(Fig. 2). Extracellular recordings further confirmed that these
synchronous fast calcium events were associated to field potential
changes and to a marked increase in multiunit activity (Fig. 2,
Table 1). These oscillations were strongly dependent on the
ac-tions of GABA as they were almost completely blocked by the
GABA
AR antagonist (bicuculline 10
M, n
⫽ 9 slices) (Fig. 4, see
Table 1). As in the hippocampus, cGDPs also required
glutama-tergic transmission since their frequency was significantly
re-duced by blockade of AMPA/KARs and NMDARs (to 14
⫾ 14%
of control values in NBQX 10
M,
D-APV 40
M, n
⫽ 6 slices, p ⫽
0.004) (Fig. 5). However, the fraction of cells involved in cGDPs
was not significantly affected by AMPA/KAR and NMDAR
blockers (to 80
⫾ 17% of control, n ⫽ 6, p ⫽ 0.2). Last,
current-clamp recordings confirmed that these calcium oscillations
cor-responded to recurrent suprathreshold membrane potential
de-polarizations (Table 1, Figs. 1, 3) whereas voltage-clamp
recordings validated that they were associated with bursts of
syn-aptic postsynsyn-aptic events (sPSCs, n
⫽ 4) (Fig. 5B3 and Materials
and Methods).
cSPA cENO cGDP Calcium spike E20 P0 Age 0 20 40 60 80 Active (%) Age 20%DF/F 20mV 2sA
cENO
100s 10s 20%DF/F 20mV i iB
cGDP
i 100sC
Rise (s) Du ra ti o n ( s ) 0 1 2 3 4 5 6 7 0 4 8 121
D
1
22
5s cSPA cENO cGDP 0 5 10 15 20 25 30 0 5 10 15 20 F ra c ti o n o f events (%) Event decay (s) Rise (s) F rac ti o n o f ev ents ( % )3
0 1 2 3 4 10 20 30 02
i P3-5 P6-8Figure 3. Single-cell electrophysiological and calcium events associated with cortical ENOs and GDPs. A, B, Current-clamp recordings at resting membrane potential and corresponding calcium fluorescence traces (bottom traces) of cells implicated in cENOs (A) and cGDPs (B). Recording periods indicated in i are illustrated on an expanded time scale. C1, Plots of the duration versus rise time of individual membrane potential oscillations associated with cGDPs (blue squares, n⫽ 4 cells, 75 events) and cENOs (green, n⫽ 5 cells, 65 events). C2, C3, Normalized distribution of the decay (2) and rise (3) times of single calcium events associated with cGDPs (blue, n⫽ 1000) and cENOs (green, n ⫽ 1000). Distribution of the duration of the calcium plateaus associated with cSPAs (red, n⫽ 500, see Materials and Methods) is also plotted in C2. D1, Comparison of three representative normalized calcium fluorescence traces recorded in single cells during cGDPs, cENOs, and cSPAs clearly illustrates the kinetics difference between these events. D2, Graph indicates the fraction of calcium spike-, cSPA-, cENO-, and cGDP-cells relative to the number of active cells at four successive age groups between embryonic to first postnatal stages. Error bars indicate SEMs.
Therefore, we found a sequence for the maturation of
popu-lation coherence in the neocortex almost similar to the one
pre-viously described in the hippocampus (Cre´pel et al., 2007) except
from the fact that two synapse-driven network patterns (cENOs
and cGDPs), sequentially led the developing neocortex.
Cortical ENOs differ from cortical GDPs
Figures 2–7 illustrate the major differences between cENOs and
cGDPs recorded at the time when they dominate the activity of
the immature cortical network (P0 –P3 for cENOs and P6 –P8 for
cGDPs) (see Fig. 3D2). A comparative quantitative description of
these two coherent patterns is provided in Table 1. Most
electro-physiological and optical measurements used to assess network
activity, including kinetics of individual calcium events,
spatio-temporal dynamics, rates of occurrence or duration, significantly
differed between cENOs and cGDPs ( p
⬍ 0.05). Moreover,
whereas both types of activity required synaptic transmission (as
assessed with voltage clamp recordings), cENOs were glutamate
driven, whereas GABA plays a critical role in the generation of
cGDPs (see above). We next performed a series of experiments
aimed at further discriminating between the mechanisms of
gen-eration of cENOs and cGDPs. First, we observed that NMDAR
blockade alone significantly affected the occurrence of cENOs (to
21
⫾ 15% of control in
D-APV 40
M, n
⫽ 11, p ⫽ 0.002) (Table
1, Fig. 5), compared with cGDPs (to 70
⫾ 5% of control in
D-APV
40
M, n
⫽ 5, p ⬎ 0.05) (Table 1, Fig. 5) further confirming the
crucial role of NMDAR activity in the generation of synchronous
network oscillations in the immature neocortex (Garaschuk et
al., 2000; Demarque et al., 2004; Dupont et al., 2006). The major
contribution of NMDARs activation to the synaptic influx
asso-ciated with cENOs was further established by measurements of
their current–voltage relationship. Indeed, I/V curves associated
with cENOs displayed a region of negative slope at
hyperpolar-ized membrane potentials and reversed polarity close to 0 mV
(2.5
⫾ 1.4 mV, n ⫽ 4 cells) (Fig. 5) whereas I/V curves
corre-sponding to cGDPs were linear and reversed at more negative
values (
⫺40.5 ⫾ 0.5 mV, n ⫽ 4 cells) (Fig. 5) clearly indicating an
important GABA
AR contribution. Interestingly, in addition to
mediating cENOs-associated PSCs, we
ob-served, in a majority of tested neurons
(57%, n
⫽ 14, P1–P3), that NMDARs also
provided a constant membrane potential
depolarization most likely sustained by a
tonic NMDAR current, since addition of
D
-APV induced a reversible
hyperpolar-ization at resting membrane potential in
current-clamp recordings (⫺6.3 ⫾ 2.3
mV, n
⫽ 4) (supplemental Fig. 1, available
at www.jneurosci.org as supplemental
ma-terial) and an outward current at
⫹40 mV
in voltage-clamp mode (22
⫾ 6 pA, n ⫽ 4)
(supplemental Fig. 1, available at www.
jneurosci.org as supplemental material).
Part of these effects was specific for
younger rats (P1–P3). Indeed, NMDAR
blockade did not affect resting membrane
potential at developmental stages when
cENOs are no longer observed (P8 –P9,
n
⫽ 6) (supplemental Fig. 1, available at
www.jneurosci.org as supplemental
mate-rial), whereas
D-APV application still
pro-duced an outward current at
⫹40 mV in
voltage-clamp mode (15
⫾ 3 pA, n ⫽ 3).
As the above experiments suggested a contribution of
NMDAR-driven tonic depolarization to the generation of
cE-NOs, we decided to test whether such depolarization could be
mimicked by elevating extracellular potassium concentrations in
the presence of
D-APV. Indeed, similar experiments were
con-ducted in a previous study to argue that a tonic depolarizing drive
provided by excitatory GABAergic transmission was instructive
for the generation of hippocampal GDPs (Sipila¨ et al., 2005). We
observed that if synchrony could be restored by 8 m
Mextracellu-lar potassium, it was difficult to compare such network events to
control cENOs since their amplitude was significantly decreased
(to 43
⫾ 8% of control, n ⫽ 8, p ⫽ 0.013) while their frequency
tended to increase (335
⫾ 171%, n ⫽ 5, p ⫽ 0.135) (supplemental
Fig. 2, available at www.jneurosci.org as supplemental material).
Likewise, in slices where cGDPs occurred (P8 –P9), we observed
that peaks of synchronous activity could indeed be restored in the
presence of the GABA
AR antagonist (gabazine 10
M) after
in-creasing the extracellular potassium concentration to 8 m
M, but
that the dynamics of the network patterns thus induced was
het-erogeneous and could not be compared with control cGDPs.
Their amplitude and frequency significantly differed ( p
⬍ 0.05,
n
⫽ 9) (supplemental Fig. 2, available at www.jneurosci.org as
supplemental material). In particular, large-amplitude (342
⫾
7% of control, n
⫽ 6), low-frequency (31 ⫾ 4% of control, n ⫽ 6)
synchronizations appeared, associated with three-times slower
calcium events (average decay was 336
⫾ 57% of control, n ⫽ 4,
p
⫽ 0.03). In 6 of 9 experiments in high potassium conditions,
large population events could be observed. These events, which
invaded the entire slice including regions that did not display any
synchronous activity pattern in control, are likely to correspond
to the occurrence of epileptiform activity. To conclude, both
cE-NOs and cGDPs are complex emergent network patterns that
cannot be reliably mimicked by pharmacological manipulations.
The slow kinetics of cENO-associated calcium and
electro-physiological events, the tonic glutamate current, as well as the
immature synaptic connectivity and neuronal excitability around
birth in the neocortex (Corlew et al., 2004; Moody and Bosma,
2005) suggested that the action of glutamate during cENOs could
B
cGDP
+bicuculline controlA
cENO
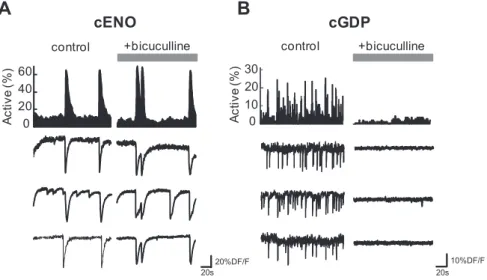
control +bicuculline 20s 10%DF/F 0 20 40 60 20s 20%DF/F Ac ti v e ( % ) Ac ti v e ( % ) 0 10 30 20Figure 4. GABAergic transmission is not involved in the generation of cENOs but is crucial for cGDPs. A, B, Representative histograms indicating the fraction of imaged cells detected as being active for each movie frame as a function of time in a P3 (A) and a P8 (B) somatosensory horizontal slice. The occurrence of cENOs (peaks of synchrony in A) was not significantly affected in the presence of the GABAAR antagonist (bicuculline, 10M) compared with control conditions. In contrast, cGDPs (peaks of synchrony
in B) were blocked in the presence of bicuculline. Below, Calcium fluorescence traces of three representative cells implicated in cENOs (A) and cGDPs (B) in control and after adding bicuculline.
also involve transmitter diffusion or accumulation in the
extra-cellular space. In a first attempt to test this hypothesis, we altered
the spatiotemporal glutamate profile without interfering with
transmitter release or with glutamate receptors uptake
mecha-nisms (Min et al., 1998). We used glutamic-pyruvic transaminase
(GPT, alanine transaminase, EC 2.6.1.2) an enzymatic glutamate
scavenger to enhance the clearance of glutamate. GPT (5 U/ml)
applied together with pyruvate (2 m
M) catalyzes the conversion
of glutamate and pyruvate to
␣-ketoglutarate. Test experiments
were performed to confirm the specificity of the scavenger for
glutamate (see Materials and Methods). We observed that
perfu-sion with GPT (5 U/ml) significantly prevented the occurrence of
cENOs (cENOs frequency and amplitude decreased to 19
⫾ 8%
and 49
⫾ 13% of control values respectively, n ⫽ 9 slices, 2426
cells, p
⬍ 0.001) (Figs. 5, 7B) compared with cGDPs (frequency
was 99
⫾ 22% of control, p ⫽ 0.67). If the frequency of cGDPs
was not affected by the glutamate scavenger, the fraction of cells
involved in them was modified since cGDPs amplitude decreased
to 64
⫾ 7% of control values in the presence of GPT (n ⫽ 7 slices,
2195 cells, p
⫽ 0.03) (Fig. 5). Separate voltage-clamp recordings
were performed to verify that GPT (5 U/ml and pyruvate) did not
block evoked NMDAR-mediated synaptic currents
(supplemen-tal Fig. 3, available at www.jneurosci.org as supplemen(supplemen-tal
material).
These experiments therefore argued for a critical role of
glu-tamate and NMDAR activation in the generation of cENOs but
not cGDPs. Since increases of extracellular glutamate
concentra-tion leading to transmitter diffusion are frequently associated to
anoxic brain episodes (Volterra et al., 1994; Takahashi et al.,
1997; Rossi et al., 2000; Auld and Robitaille, 2003) and since most
60 40 20 0 20 40 100 100 200 300 +10 10 40 70
A
cENO
cGDP
1
3
Active ( % ) +D-APV 1min +glutamate scavenger +glutamate1
3
B
4
4
Active (%) Active ( % ) 20s 0 20 40 Active (%) 100s 100s 100s100s 0 20 40 0 8 16 4 8 0 0 40 80 +D-APV Active ( % ) Active ( % )+D-APV +NBQX +D-APV +NBQX +D-APV +NBQX
20s 20s 20s 20s 50pA +40 0 -500ms -0 20 40 - -0 250ms 100 pA - 60 30 20 +40 -- 60 30 20 +40 60 - 30 - 20 +40
2
2
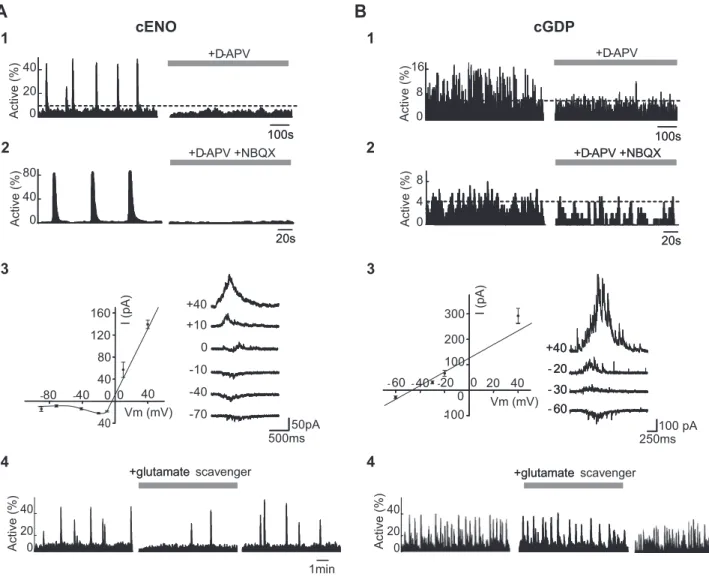
+glutamate scavenger +glutamate 80 40 0 0 40 80 120 160 --40 - 40 Vm (mV) Vm (mV) I (pA) I (pA)Figure 5. Differential role of glutamate in the generation of cortical ENOs and GDPs. A1, Histograms indicating the fraction of imaged cells detected as being active for each movie frame as a function of time in a P0 somatosensory horizontal slice. The occurrence of cENOs (peaks of synchrony, left histogram) was strongly reduced when the NMDAR antagonist (D-APV, 40M) was added
to the saline (right histogram). Dashed horizontal line indicates statistical significance threshold. A2, Same type of histograms as in A1 showing that the occurrence of cENOs was fully blocked in the presence of both NMDAR and AMPA/KAR antagonists (D-APV, 40Mand NBQX, 10M, right histogram). A3, Left, Average current–voltage relationship of cENO-associated postsynaptic currents
(PSCs, 5 cENOs-PSCs averaged for each point) obtained in a representative cortical neuron. I/V curve displays a negative slope at negative membrane potential values and reverses around 0 mV, indicating a strong contribution of NMDARs. Error bars indicate SEM. Right, Representative traces of PSCs associated with cENOs at different holding potentials from the same recorded neuron. A4, Same type of histograms as in A1 in a P1 somatosensory horizontal slice, showing that perfusion with the enzymatic glutamate scavenger (GPT 5 U/ml with pyruvate 2 mM) significantly reduces the
frequency of cENOs (peaks of synchrony). The effect of GPT is reversible upon wash out of the drug (right histogram). B, Same as A but in P6 somatosensory horizontal slices where cGDPs could be recorded (small peaks of synchrony). B1,D-APV had a significantly smaller effect on the occurrence of cGDPs compared with cENOs (see A1). Dashed horizontal line indicates significance threshold; B2, Blockade of ionotropic glutamatergic transmission almost completely prevented the occurrence of cGDPs. B3, Same as A3, but current–voltage relationship of cGDP-PSCs is linear and reverses
previous experiments describing cENOs were performed at
rela-tively low perfusion rates (
⬃1 ml/min, Corlew et al., 2004), we
hypothesized that cENOs could be favored by slowing down
fusion or triggering anoxic conditions. Thus, decreasing the
per-fusion rate (from 4 to 1 ml/min) significantly increased the
fre-quency of ENOs (to 359
⫾ 156% of control values, n ⫽ 4 slices,
1232 cells, p
⫽ 0.005) (Fig. 6). On the contrary, as reported in the
hippocampus (Dzhala et al., 1999), the occurrence of cGDPs was
impaired by a similar procedure (to 45
⫾ 26%, n ⫽ 2 slices, 227
cells) (Fig. 6).
We also tested the temperature dependence of both patterns
and observed that their occurrence was stable between 30 and
34°C, but significantly decreased by lowering the temperature to
room temperature values (
⬃22°C, data not shown).
Interest-ingly, when reproducing the previously described “temperature
drop” protocol (Yuste et al., 1995) that consists in perfusing slices
with a bolus of cold saline (⬃4°C), we could trigger synchronous
calcium events in neuronal clusters clearly resembling “neuronal
domains” (Yuste et al., 1992; Yuste et al., 1995, n
⫽ 2 slices, data
not shown). Brief episodes (
⬃5 min) of anoxia/aglycemia were
induced by superfusion with a solution in which oxygen was
substituted for nitrogen and glucose for sucrose (Dzhala et al.,
1999). These experimental conditions differentially affected
cE-NOs and cGDPs since we observed: (1) in experiments
per-formed when cENOs dominate the neocortical network (P0 –P3),
a transient but significant increase in the frequency of cENOs
occurring
⬃2 min after the beginning of anoxic conditions (to
234
⫾ 54% of control values, n ⫽ 9, p ⫽ 0.03) (Figs. 6, 7A); in
addition, a significant increase of cENOs amplitude was observed
just after reoxygenation (to 124
⫾ 9% of control values, n ⫽ 9,
p
⫽ 0.01); (2) a significant reduction in the frequency and
ampli-tude of cGDPs during anoxia and persisting up to 8 min after
reoxygenation (to 25
⫾ 17% and 24 ⫾ 15% of control values
respectively, n
⫽ 4, p ⫽ 0.03) (Figs. 6, 7A). We conclude that
cENOs are physiologically present in horizontal slices but favored
by hypoxic conditions, most likely due to their strong
depen-dence on glutamate levels. In contrast, experimental anoxia
de-presses cGDPs, which emerge later during development.
Still, cENOs and cGDPs could be the expression of the same
network pattern supported by different cellular mechanisms
be-cause they are observed at separated developmental stages as
de-scribed for cholinergic oscillations (Dupont et al., 2006) or retinal
waves (Syed et al., 2004). To test this hypothesis, we performed
experiments during the transition period (P4 –P5) between
ENO- and GDP-dominated networks. In a rare portion of
im-aged slices (2 of 17), we could simultaneously image two network
patterns with significantly distinct dynamics (Fig. 7): (1) slow
ENO-like calcium waves involving a large fraction of cells and
occurring on average 2 times/min and (2) faster GDP-like
recur-rent (0.12 Hz) synchronizations between localized groups of
neu-rons. Both patterns most likely corresponded to simultaneously
imaged cENOs and cGDPs since the former was selectively
blocked when the enzymatic glutamate scavenger GPT was added
to the saline, whereas the latter was specifically impaired in
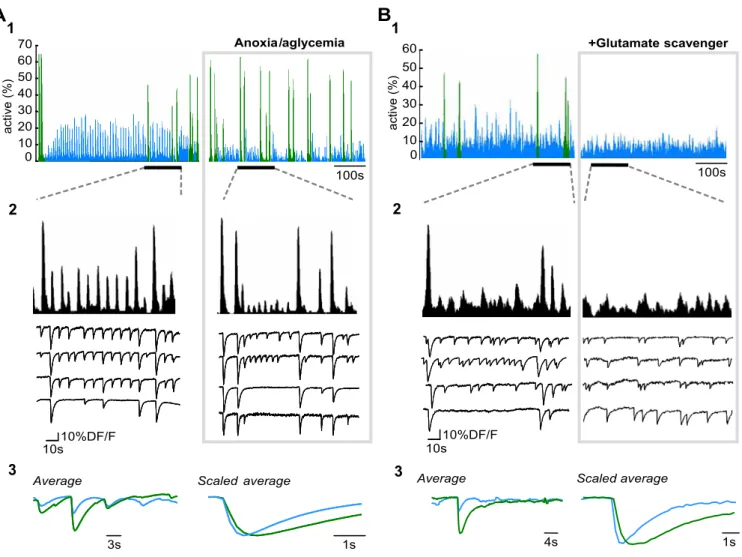
anox-ic/aglycemic conditions (Fig. 7). We conclude that cENOs and
cGDPs are two distinct network patterns.
Discussion
The main finding of the present study is that NMDAR-driven
ENOs and GABA
AR-driven GDPs are two distinct network
pat-terns, sequentially expressed in immature neocortical structures,
characterized by different spatiotemporal dynamics both in
elec-0 10 20 30 40 50 60 Anoxia/aglycemia 100s Active ( % )cENO
100s 0 20 40 60 Active ( % )High perfusion rate (4ml/min)
Low perfusion rate (1ml/min)
* *
*
* *
A
1
2
100s Active ( % ) 0 10 20 30 40 50 60 Anoxia/aglycemia2
cGDP
10s High perfusion rate(4ml/min)
Low perfusion rate (1ml/min) 20 40 60 Active ( % )
** * * *
* ***** ** **
*
*
B
1
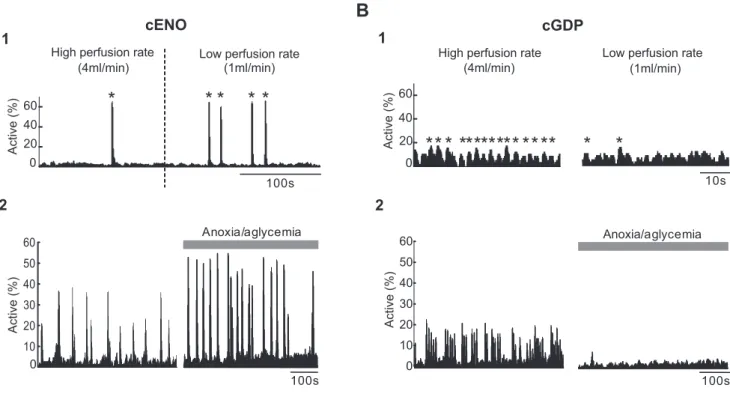
0Figure 6. Perfusion rate and anoxic/aglycemic episodes differentially affect cENOs and cGDPs. A1, Histograms indicating the fraction of imaged cells detected as being active for each movie frame as a function of time in a P2 somatosensory horizontal slice. The frequency of cENOs (peaks of synchrony indicated by *) was significantly increased when decreasing the rate of ACSF perfusion from 4 to 1 ml/min. Dashed line indicates the time when perfusion rate was modified. A2, Same histograms as in A1 in a P3 horizontal cortical slice. The frequency of cENOs (peaks of synchrony in the histogram) was significantly increased compared with control (left histogram) after 5 min of anoxia/aglycemia (right). B1, B2, Same as A but in a P7 somatosensory horizontal slice where cGDPs could be recorded (small peaks of synchrony indicated by *). In contrast to cENOs (A), the frequency of cGDPs was dramatically decreased in low perfusion conditions (B1, right) as well as after 5 min of anoxia/aglycemia (B2, right).
trical and optical recordings. Most importantly, we show that
cENOs are effectively modulated by extracellular glutamate
lev-els. This unique feature imparts to the immature cerebral cortex a
critical sensitivity to pathological transmitter accumulations,
such as those occurring during anoxic episodes.
Electrophysiological and single-cell correlates of calcium
oscillations in the immature neocortex
In this study we have chosen to perform a compound
descrip-tion of populadescrip-tion activity to gain the best resoludescrip-tion and
assess the spatiotemporal features of any organized activity
pattern, even discrete and localized. Whereas activity is poorly
correlated at embryonic stages, large scale calcium waves
abruptly emerge at birth in horizontal neocortical slices; these
calcium events correspond to the extensively described ENOs
(Garaschuk et al., 2000; Corlew et al., 2004; McCabe et al.,
2006, 2007) as they present similar dynamics (i.e., calcium
kinetics, amplitude, rate of occurrence), developmental
pro-file, temperature sensitivity, and pharmacological properties.
Most imaging studies describing cENOs (Garaschuk et al.,
2000; Corlew et al., 2004; McCabe et al., 2006, 2007) were
performed in horizontal slices and surprisingly we could
in-deed record them only in
⬃5% of imaged coronal slices. This
would indicate that cENOs are better supported when some
anatomical connections are spared, most likely the
rostrocau-dal organization within layers rather than the intralaminar
circuitry (Fleidervish et al., 1998). In agreement with this,
spontaneous oscillatory network activity similar to cENOs
could be recorded with MEA chips in thick coronal cortical
slices, but much more infrequently (Sun and Luhmann, 2007).
In our study we confirmed that cENOs are associated with (1)
field potential oscillations and increased multiunit activity
(MUA) validating that they result from synchronous
popula-tion discharges; (2) sustained membrane potential
depolariza-tion that could lead to acdepolariza-tion potential firing; and (3) a barrage
of NMDAR driven EPSCs. This work therefore provides the
first comprehensive description of the electrophysiological
correlates underlying cENOs.
10 20 30 40 50 60 70 0 ac ti v e (% ) 100s Anoxia/aglycemia
A
3s 10s 10%DF/FAverage Scaled average
1s 0 10 20 30 40 50 60 +Glutamate scavenger 4s 10s 10%DF/F
Average Scaled average
1s ac ti v e (% )
B
100s1
1
2
2
3
3
Figure 7. Differential modulation of cENOs and cGDPs, simultaneously recorded in a neocortical slice. A1, Histograms indicating the fraction of imaged cells detected as being active for each movie frame as a function of time in a P5 somatosensory horizontal slice in control (left) and during anoxic/aglycemic conditions (right, 164 ms per frame). Two types of synchronous network events can be distinguished: cGDPs (blue) are smaller amplitude highly recurrent synchronizations associated to fast and small amplitude calcium transients and cENOs (green) are less frequent large peaks of synchrony associated to slower and larger calcium transients. Perfusion with anoxic/aglycemic ACSF increases the frequency of cENOs but reduces that of cGDPs. A2, Same histograms as in A1 but on an expanded time scale for the time period indicated in A1 by a horizontal bar. Representative calcium fluorescence traces from four imaged cells illustrating the amplitude and kinetics difference between cENO and cGDP-associated calcium events. A3, Comparison of all the digitally averaged calcium fluorescence events associated to cENOs (green) and cGDPs (blue) from the entire duration of the recording clearly indicates the amplitude difference between the two network patterns. Comparison of the scaled digital averages shows that the rise and decay time constants of cENOs-associated calcium transients are significantly slower than those associated to cGDPs (rise time: 1.0 vs 0.6 s; decay: 5.7 vs 1.6 s). B, Same as A, but comparing control and perfusion with the enzymatic glutamate scavenger (GPT 5 U/ml with pyruvate 2 mM) Perfusion with GPT (5 U/ml) selectively blocks the occurrence of cENOs (green) without significantly affecting cGDPs (blue).