HAL Id: hal-03005818
https://hal.archives-ouvertes.fr/hal-03005818
Submitted on 14 Nov 2020
HAL is a multi-disciplinary open access
archive for the deposit and dissemination of
sci-entific research documents, whether they are
pub-lished or not. The documents may come from
teaching and research institutions in France or
abroad, or from public or private research centers.
L’archive ouverte pluridisciplinaire HAL, est
destinée au dépôt et à la diffusion de documents
scientifiques de niveau recherche, publiés ou non,
émanant des établissements d’enseignement et de
recherche français ou étrangers, des laboratoires
publics ou privés.
Exposures by Quantitative Ultrasound
Victor Barrère, Emilie Franceschini, David Melodelima
To cite this version:
Victor Barrère, Emilie Franceschini, David Melodelima. Characterization of High Intensity Ultrasound
Exposures by Quantitative Ultrasound. IEEE International Ultrasonics Symposium, IUS, 2019.
�hal-03005818�
Abstract— High Intensity Ultrasound (HIU) is of proven value in the treatment of many medical disorders by using US energy without incisions or radiation. The development of an effective method for guiding HIU therapies remains necessary. Changes in spectral-based Quantitative UltraSound (QUS) parameters have been correlated with the temperature changes during HIU exposure (Ghoshal et al. IEEE UFFC 2016). The aim of this study is to quantify the changes in QUS parameters due to temperature elevation after HIU exposure of ex vivo bovine livers. The QUS experiments are conducted in high frequencies (12-38 MHz) to provide insight into the specific changes in liver tissues that cause the changes of backscatter properties for fixed temperature ranging from 37°C up to 80°C after HIU exposure.
Samples of porcine livers are exposed to HIU using a plane 3 MHz transducer with aperture diameter of 4 cm. Samples were heated up to 37, 50, 60, 65, 70, 75, 80°C. After reaching the desired temperature, the sample is cut in half at the center of the lesion. US backscatter signals were recorded from the cut samples by using the Visualsonics Vevo 770 imaging system with the RMV710 probe of center frequency 25 MHz. The backscatter coefficients (BSCs) were estimated using the reference phantom technique and the attenuation coefficients were determined using a standard substitution method. Structural scatterer properties were estimated by fitting the measured BSCs with the spherical Gaussian model (SGM) or with the Structure Factor Model (SFM) to estimate the effective scatterer diameter (ESD) and acoustic concentration (EAC). The QUS parameters estimated by the sparse SGM and the concentrated SFM differ strongly from each other for HIU treated samples and suggests that the treated livers can be considered as concentrated media. Results showed that both integrated BSC and ESD estimated by the SFM increased as a function of temperature.
Keywords— high intensity ultrasound, backscatter coefficient, quantitative ultrasound.
I. INTRODUCTION
High Intensity Focused Ultrasound (HIFU) is of proven value in the treatment of many medical disorders by using US energy without incisions or radiation [1-2]. The development of an effective method for guiding HIFU therapies remains necessary. Quantitative UltraSound (QUS) techniques based on the parametrization of the backscatter coefficient (BSC)
provide insight into tissue microstructure. The method consists in fitting a scattering model to the estimated BSC.
The fit parameters provide a meaningful description of the tissue microstructure, such as the scatterer size, shape, scattering strength, spatial organization. One of the most popular scattering models is the spherical Gaussian model (SGM) [3-4] that describes tissue as a random inhomogeneous continuum with impedance fluctuations. The SGM yields two QUS estimates describing tissue microstructure: the average effective scatterer size (ESD) and the acoustic concentration (EAC) (i.e., the product of the scatterer number density and the square of the relative impedance difference between the scatterers and the surrounding medium). Another class of theoretical scattering model is the concentrated Structure Factor Model (SFM) that describes tissue as an ensemble of discrete scatterers and considers interference effects caused by coherent scattering using a structure function [5-6]. Changes in ESD and EAC QUS parameters have been correlated with the temperature changes during HIU exposure [7-8]. The aim of this study is to quantify the changes in QUS parameters due to temperature elevation after HIU exposure of ex vivo porcine livers. The attenuation, BSC, ESD and EAC were evaluated at different temperatures between 37°C and 80°C. The change in tissue microstructure during a HIFU treatment could allow to explicit both dependences of ultrasonic parameters in temperature and tissue microstructure. The long term objective is to use such information to provide 2D temperature maps during ultrasound treatments or 2D ablation maps using conventional ultrasound imaging probes.
II. MATERIALS AND METHODS A. Sample preparation and HIFU treatment
Fresh porcine liver samples were collected from a slaughter house. They were sliced into rectangular prisms of 10 cm x 3 cm x 6 cm with a scalpel. Before each intervention, samples were placed in degassed water at 4 mg/L of oxygen and degassed in a vacuum chamber during 45 minutes. The aim was to avoid the presence of hyperechogenic microbubbles within the tissue. To minimize contact with air, the sample and degassed water were both transferred into an experimental tank containing degassed water. While underwater, the sample was placed in its holder.
Tissues were heated using an air-backed 3-MHz homemade plane transducer [9-10]. The shape of the transducer is circular with an active diameter of 4-cm. The electrical power was delivered in via a 41501-55-dB power
Characterization of High Intensity Ultrasound Exposures by
Quantitative Ultrasound
Victor Barrère1, Emilie Franceschini2, David Melodelima1
1LabTAU, INSERM, Centre Léon Bérard, Université Lyon 1, Univ Lyon, F-69003, LYON, France 2Aix-Marseille Université, CNRS, Centrale Marseille, LMA UMR7031, Marseille, France
amplifier (ADECE, Artannes, France) driven by a Hameg HM8131 sinusoidal wave generator (Hameg, Frankfurt,
Germany). Directional power meter
(wattmeter/reflectometer) (Rohde and Schwarz, Munich, Germany) fitted with a NAP bidirectional coupling device probe (Rohde and Schwarz) were inserted into the line between the amplifier output and the applicator to determine, with the aid of a built-in directional coupler, the incident and reflected electrical power. The probe was covered by an envelope in polyurethane (14×91.5 mm, CIV-Flex Transducer cover, CIVCO, USA) containing a sterile and degassed ultrasonic coupling fluid (Ablasonic®, EDAP, Vaux-en-Velin, France). This envelope attenuated the ultrasound pressure by about 3-4% at 2.5MHz. A continuous flow of 0.3 L/min maintained the degassed coupling water at 20 ◦C and allowed cooling of the HIFU transducer during the treatment. A peristaltic Masterflex pump (L/S model 7518– 60, Cole-Parmer Instruments Co., Chicago, IL, USA) drove the water around a closed cooling circuit.
Tissues were heated using low intensity (1.5 W/cm2 at the
surface of the plan transducer) to create slow and homogeneous heating and avoid non-linear effects. Using such power, the temperature of the liver reached 80°C after approximatively fifteen minutes of exposure. The temperature was monitored along the acoustic axis at 1 cm from the surface of the liver using a needle thermocouple (MY-29/5HT Needle Microprobe, Physitemp, USA). Six samples were heated up to 50, 60, 65, 70, 75 and 80°C. The sample was then sliced perpendicularly to the HIFU acoustic axis at the depth of the thermocouple and then sliced again into two samples. The first one is used to acquire backscattered signals to evaluate BSC. The second one was used to measure the attenuation coefficient.
B. Quantitative ultrasound
The attenuation coefficients were determined by using a standard substitution technique. Attenuation measurements were conducted with a single element 20-MHz flat transducer excited using a pulser-receiver (5073PR, Olympus, France). The RF signals are digitized at a sampling frequency of 250 MHz with 12-bit resolution using a Gagescope model CS12502 acquisition board. A slice of the heated sample of thickness around 5 mm is put in contact with a flat reflector, and the attenuation is determined by comparing the spectra of the backscattered signals with and without the tissue in the acoustic path. For each heated sample, six backscattered signals from six different locations were recorded for averaging purpose.
The backscatter coefficient was estimated using the reference phantom technique. Ultrasonic backscatter signals were recorded from the two parts of the cut samples by using the Vevo 770 high frequency imaging system (Visualsonics Inc, Toronto, Canada). The RMV710 probe was used in B-mode. The oscillating singe element focused transducer has center frequency of 25 MHz, focus of 15 mm and f-number of 2.1. The probe focus was approximatively positioned at a distance of 1 mm below the water/sample interface. For around 100 RF lines, echoes were selected in the focal zone with a
rectangular window of d=1.2 mm, corresponding to 15 pulse lengths. The power spectra of the backscattered RF echoes were then averaged to obtain the measured average power spectrum BSCmeas. The reference phantom technique uses a reference scattering medium that makes it possible to compensate the measured backscattered power spectrum
BSCmeas for the electromechanical system response and the depth-dependent diffraction and focusing effects caused by the ultrasound beam. The reference medium consisted in 2.5-microns polyamide microspheres (orgasol 2001 UD NAT1, Arkema, France) at a volume fraction of 0.5% embedded in an agar-agar matrix. Echoes from the reference scattering medium were acquired and windowed as with the sample to obtain the reference average power spectrum BSCmeas.
The measured BSC was then computed as [11]
where f is the ultrasound frequency in MHz. The acoustic losses were compensated using predetermined attenuation coefficients in samples and reference media; αmeas and αref refer to the frequency-dependent attenuation expressed in Np/cm of the sample and the reference.
For each ROI, estimates of QUS parameters were obtained by fitting the measured BSCmeas with the SGM [3-4] or the SFM [5-6] within the 12-38 MHz bandwidth. The SGM yields estimates of ESD and EAC. The ESD has been related to the size of dominant scatterers in tissues. The EAC is the product of the number of scattering particles per unit volume (mm3)
and the square of the fractional change in the impedance between the scatterers and the surrounding medium. The SFM yields three parameters the scatterer radius a, the scatterer volume fraction and the relative impedance contrast z, from which the EAC can be deduced: EAC=z2/((4/3)a3). If both SGM and SFM gave similar scatterer sizes, the tissue may be considered as a sparse medium, and the SFM can only yield the ESD and EAC [5-6]. Otherwise, the tissue may be considered as a concentrated medium, and the SFM can yield the three QUS parameters (a, , z). The reported QUS parameters are averaged over the five measurements performed on each heated sample.
III. RESULTSANDDISCUSSION
A. Attenuation
Figure 1 shows the attenuation as a function of frequency for various studied temperatures. The attenuation was found to depend linearly on frequency within the 5-30 MHz bandwidth. The mean values of attenuation coefficient were found equal to 0.58, 0.81, 1.15, 1.2, 1.45, 1.37 and 1.83 dB/cm/MHz, for the temperature of 37, 50, 60, 65, 70, 75 and 80°C, respectively. Therefore, the attenuation coefficient increases with the HIU temperature. For the non-treated liver at 37°C, the value of the attenuation is in accordance with the literature.
Figure 1. Attenuation as a function of frequency for livers heated at different temperatures by HIU treatment
B. Tissue microstructure parameters
The amplitude of BSC for untreated liver was found to be smaller than the BSC for HIU treated livers. The mean integrated BSC within the frequency bandwidth 12-38 MHz were equal to 0.006, 0.025, 0.018, 0.018, 0.050, 0.038 and 0.036 cm-1.sr-1, for the temperature of 37, 50, 60, 65, 70, 75
and 80°C, respectively. It is interesting to notice that the integrated BSC can be used to differentiate between moderate (50, 60, 65°C) and high temperature exposure (70, 75, 80°C) (p-value<0.05), which corresponds to the transition in HIU-induced coagulative necrosis.
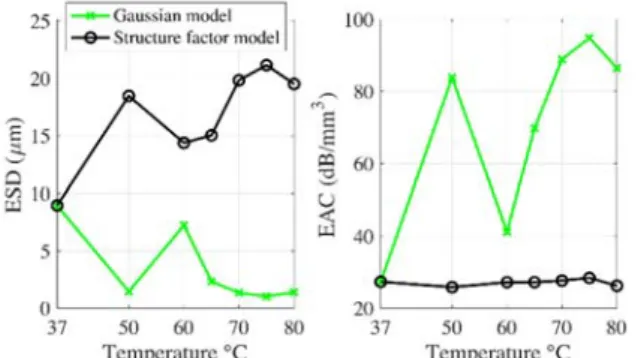
Figure 2. Effective scatterer size (ESD) and acoustic concentration (EAC) estimated by both SGM and SFM models in liver tissue as a
function of temperature.
Figure 2 summarizes the ESD and EAC QUS parameters estimated from the SGM and SFM models. The ESD and EAC obtained from the sparse SGM and the concentrated SFM gave similar values for untreated liver at 37°C, as observed previously in previous experiments on ex vivo canine livers [5]. Whereas the ESD and EAC estimated by the sparse SGM and the concentrated SFM differ from each other for HIU treated samples. The ESD estimated by the SGM decreased with increasing temperature and gave ESD values ≤2 μm for the temperature of 50, 65, 70, 75 and 80°C, as obtained previously in concentrated mouse tumors [5]. It suggests that the treated livers can be considered as concentrated media and that the SFM is a more-appropriate model to use for characterizing the treated livers.
When considering the concentrated SFM, the ESD increased with increasing temperature, whereas the EAC
stays roughly constant as function of temperature (around 27 dB.cm-3). It can be noticed that the ESD value for non-treated
liver (≈8.96 μm) is significantly different from the ESD values for HIU treated samples (≥14.37 μm).
IV. CONCLUSION
To date MRI is the only imaging method allowing to monitor temperature in real-time during HIU treatments. The results presented here are based on structural changes in biological tissues during heating that can be measured in ultrasonic backscattered signals obtained with commercially available diagnostic imaging probes. During HIU treatments a change was observed regarding iBSC and ESD estimated by the concentrated SFM that increase as a function of temperature. These changes in iBSC and ESD seem to indicate a change in the tissue microstructure and need to be correlated with histological examination. Further studies are needed to evaluate the reversibility during cooling of the tissue. These parameters or a combination of them could conduct to an efficient temperature monitoring during HIFU interventions.
ACKNOWLEDGEMENT
This research was supported by France Life Imaging WP3-FLI.
REFERENCES
[1] J.E. Kennedy, “High-intensity focused ultrasound in the treatment of solid tumours”, Nat. Rev. Cancer, vol. 5, no4, pp. 321-327, 2005 [2] D. Melodelima, F. Prat, J. Fritsch, Y. Theillere, D. Cathignol,
“Treatment of esophageal tumors using high intensity intraluminal ultrasound: first clinical results”, J. Transl. Med., vol. 6, pp. 28 [3] F. L. Lizzi, M. Ostromogilsky, E. J. Feleppa, M. C. Rorke, and M. M.
Yaremko, “Relationship of ultrasonic spectral parameters to features of tissue microstructure”, IEEE Trans. Ultrason. Ferroelect. Freq. Contr., vol. 33, no. 3, pp. 319-329, 1986.
[4] M. F. Insana, R. F. Wagner, D. G. Brown and T. J. Hall, “Describing small-scale structure in random media using pulse-echo ultrasound”, J.
Acoust. Soc. Am., vol. 87, no. 1, pp. 179-192, 1990.
[5] P. Muleki-Seya, R. Guillermin, J. Guglielmi, J. Chen, T. Pourcher, E. Konofagou and E. Franceschini, “High frequency quantitative ultrasound spectroscopy of excised canine livers and mouse tumors using the structure sactor model”, IEEE Trans. on Ultrason.,
Ferroelect., Freq. Contr., vol. 63, no. 9, pp. 1335-1350, 2016.
[6] E. Franceschini, R. de Monchy and J. Mamou, “Quantitative characterization of tissue microstructure on concentrated cell pellet biophantoms based on the structure factor model”, IEEE Trans. on
Ultrason., Ferroelect., Freq. Contr., vol. 63, no. 9, pp. 1321-1334,
2016.
[7] G. Ghoshal, J. Kemmerer, C. Karunakaran, R. J. Miller and M. L. Oelze, “Quantitative Ultrasound for Monitoring High-Intensity Focused Ultrasound Treatment In Vivo”, IEEE Transactions on
Ultrasonics, Ferroelectrics, and Frequency Control, vol. 63, no. 9 , pp
1234 – 1242, Sept. 2016.
[8] G. Ghoshal, J.P. Kemmerer and M.L. Oelze, “Changes in quantitative ultrasound parameters during HIFU application”, AIP Conference
Proceddings, vol. 1481, 106, 2012.
[9] Tardoski S., Gineyts E., Ngo J., Kocot A., Clézardin P. and Melodelima D., “Low-Intensity Ultrasound Promotes Clathrin-Dependent Endocytosis for Drug Penetration into Tumor Cells”, Ultrasound in
Medicine and Biology, vol. 41, no. 10, pp. 2740-2754, 2015.
[10] Tardoski S., Ngo J., Gineyts E., Roux J. P., Clézardin P. and Melodelima D., “Low-intensity continuous ultrasound triggers
effective bisphosphonate anticancer activity in breast cancer”, Sci. Rep., vol. p. 16354, 2015.
[11] E. Franceschini, R. Guillermin, F. Tourniaire, S. Roffino, E. Lamy and J.-F. Landrier, “Structure factor model for understanding the measured backscatter coefficients from concentrated cell pellet biophantoms”,
Journal of the Acoustic Society of America, vol. 135, no. 6, pp.
3620-3631, 2014.
[12] V. Zderic, A. Keshavarzi, M. A. Andrew, S. Vaezy and R. W. Martin, “Attenuation of porcine tissues in vivo after High-Intensity Ultrasound Treatment”, Ultrasound in Medicine and Biology, vol. 30, no. 1, pp 61-66, 2004