Development of a Software Tool to Investigate the Local & Global
Response of Buildings to Blast Loading
By
Killian T. O'Leary
Bachelor of Engineering in Structural Engineering Cork Institute of Technology, 2011
Submitted to the Department of Civil and Environmental Engineering in Partial F of the Requirements for the Degree of
MASTER OF ENGINEERING in High-Performance Structures
at the
MASSACHUSETTS INSTITUTE OF TECHNOLOGY
June 2015 ulfillment
ARCHIVES
MASSACHUSETTS INSTITUTE OF TECHNOLOLGYJUL 02 2015
LIBRARIES
2015 Killian T. O'Leary. All Rights Reserved.The author hereby grants to MIT permission to reproduce and to distribute publicly paper and electronic copies of this thesis document in whole or in part in any medium now know or hereafter created.
Signature of Author:
Signature red acted
Certified By:
Certified By:
Accepted By:
/1"
Department of Civil and Environmental Engineering May 15, 2015
Signature redacted
Pierre Ghisbain Lecturer of Civil and Environmental Engineering Thesis Supervisor
Signature redacted
Jerome
J.
ConnorProfessor of Civil and Environmental Engineering Thesis Co-Supervisor
I I
I- /Signature redacted
4
,- I- P:Development of a Software Tool to Investigate the Local & Global
Response of Buildings to Blast Loading
By
Killian O'Leary
Submitted to the Department of Civil and Environmental Engineering on May 15, 2015 in Partial Fulfillment of the Requirements for the Degree of Master of Engineering in Civil and Environmental Engineering
Abstract
Well-publicized intentional and accidental explosions in the last two decades have exposed the lack of resilience in structures triggering disproportionate failure. This has fuelled change in the civil engineering industry with government agencies leading the way. This research further contributes to the topic of blast resistant design with particular focus placed on the response of building structures subjected to external blasts.
A software tool to assess the response of structure to blast loads is firstly presented. The proposed tool integrates a staged process and can broadly be broken down into three core modules: the blast load condition, the response of the target structural element(s), and frame stability in the event of a support being compromised. By automating this process, the resistance of a building can be investigated under a number of possible blast situations in quick succession.
In addition, the application incorporates a design feature that sizes 2D moment frames for wind and gravity loading, for the sole purpose of studying blasts on different frame strengths and geometries. The latter stages of the report demonstrate the capabilities of the tool by firstly proposing standard input metrics based on industry norm, and following on from this exploring the effects of each input through a parametric analysis. Example input parameters include blast weight, standoff distance, wind speed, number of bays & stories, target column location and element plastic limits.
Thesis Supervisor: Pierre Ghisbain
Title: Lecturer of Civil and Environmental Engineering Thesis Co-Supervisor: Jerome J. Connor
Acknowledgements
I would like to thank Pierre Ghisbain for his continuous guidance with this thesis. His knowledge and enthusiasm for structural analysis, specifically the topic of resilience, has proved invaluable and provided a great source of encouragement throughout this academic year. His commitment to MIT and his students is outstanding and greatly appreciated by the entire MEng class of 2015.
I would like to thank the friends I have made over the past year. I wish you all continued success whether it be in academia or the working industry. I would also like to acknowledge John Gaffney. Your help with programming and friendship throughout the year was extremely valuable and very much appreciated.
Table of Contents
List of Figures ... 7 List of T ables ... 9 1 Introduction ... 11 1.1 Background ... 11 1.2 Blast Loading ... 13 1.3 Preventative M easures ... 14 1.4 M otivation ... 162 Structural Response to Blasts ... 17
2.1 Building Enclosure ... 17
2.2 Structural Elem ents ... 19
2.3 Fram e Stability ... 20
3 A pplication D evelopm ent ... 23
3.1 Fram e D esign ... 23
3.1.1 D esign Loads ... 23
3.1.2 Elem ent D esign ... 24
3.2 Blast Loading - Em pirical M ethod ... 27
3.3 Elem ent Response ... 31
3.3.1 Elastic Behaviour ... 32
3.3.2 Elasto-Plastic Behaviour ... 33
3.3.3 Colum n Re-D esign ... 35
3.4 Fram e Stability ... 37
3.4.1 Linear Static Analysis ... 37
3.4.3 N on-Linear D ynam ic (N LD ) Analysis ... 39
3.5 Com plete Application and Required Inputs ... 41
3.6 Application Precision ... 43
3.6.1 Blast D ata ... 43
3.6.2 Structural Response ... 43
4 Analysis & Results ... 45
4.1 Standard Case ... 45
4.2 Loading Condition ... 46
4.2.2 Standoff D istance...48
4.2.3 A ngle of Incidence ... 49
4.3 Elem ent A nalysis - Colum n Boundary Conditions... 50
4.3.1 Blast W eight & Boundary Conditions... 51
4.4 Elem ent A nalysis -Building G eom etry ... 53
4.4.1 Beam Tributary W idth... 53
4.4.2 Beam Length ... 54
4.4.3 Colum n H eight ... 55
4.4.4 Stories, Bays & D esign W ind Pressure ... 56
4.4.5 Stories, D esign W ind Pressure & Colum n H eight... 58
4.5 Fram e A nalysis...60
5 Sum m ary & Conclusions... 65
5.1 Future Research...65
6 R eferences ... 67
A ppendix A - Standard Case R esults ... 69
A ppendix B - Sam ple C alculation ... 73
A ppendix C - JAVA Code Extracts... 79
A pplication Inputs ... 79
Finding Peak O ver Pressure...81
Finding Reflected Blast Im pulse ... 83
W ind A ssessm ent...85
Colum n D esign Checks...87
Beam D esign Checks...89
Sourcing Colum n Properties...90
Colum n Plastic Response ... 92
SA P2000 Text File Fragm ents ... 93
List of Figures
Figure 1.1 -Aftermath of attack on Murrah Federal Building, 1995 ... 12
Figure 1.2 -Blast and Progressive Collapse damage (NIST)...12
Figure 1.3 -Pressure distribution at 10 feet Standoff Distance from detonated explosion (NIST) ... 12
Figure 1.4 -Details of the explosion and the immediate interaction with the Federal Building (NIST) ... 12
Figure 1.5 -Aftermath of the gas explosion on the 18th floor of Ronan Point (Delatte 2005)...13
Figure 1.6 -Typical structural connection detail between wall panel and floor slab (ASCE) ... 13
Figure 1.7 -Typical pressure time history (FEMA 426)...14
Figure 1.8 -Significance of Standoff Distance (FEMA 426) ... 15
Figure 2.1 -Blast resistant glazing fagade (Sentech Architectural Systems) ... 18
Figure 2.2 -Application of blast pressure on column flange ... 19
Figure 2.3 -Intensity of a blast pressure on a building ... 19
Figure 2.4 -Possible column boundary conditions...20
Figure 2.5 -Increased beam span due to column removal...21
Figure 3.1 - Pressure difference due to reflection ... 29
Figure 3.2 - Idealised pressure loading ... 29
Figure 3.3 -Shock wave parameters for hemispherical TNT explosion (UFC 3-340-02) ... 30
Figure 3.4 -Pressure coefficient versus angle of incidence (UFC 3-340-02) ... 30
Figure 3.5 -Reflected scaled impulse versus angle of incidence (UFC 3-340-02)... 30
Figure 3.6 -Idealised SD O F system ... 31
Figure 3.7- Maximum Response of Elastic System due to Triangular Load (UFC 3-340-02) ... 33
Figure 3.8 -Maximum deflection of Elasto-Plastic SDOF (UFC 3-340-02)...34
Figure 3.9 -Maximum response time of Elasto-Plastic SDOF (UFC 3-340-02)...34
Figure 3.10 -(A pplication fragm ent) Colum n...35
Figure 3.11 -(Application fragment) Column design equations...35
Figure 3.12 -Deformation Criteria (UFC 3-340-02)...36
Figure 3.13 - (Application Extract) Re-design results...37
Figure 3.14 -(Application fragment) SAP2000 text file ... 39
Figure 3.15 -SA P2000 Im port text file extract...39
Figure 3.16 -Extracts from typical SAP2000 import model...40
Figure 3.17 -Software environment for blast analysis and structural response... 41
Figure 3.18 -(Application fragment) Peak Incident Pressure application input... 43
Figure 3.19 -(Application fragment) Peak Incident Pressure application input (cont'd)...43
Figure 4.1 - Standard analysis case ... 45
Figure 4.2 -Blast properties with varying explosive weight ... 47
Figure 4.3 -Local structure assessm ent with varying explosive weight... 48
Figure 4.4 -Blast properties with varying standoff distance ... 48
Figure 4.5 -Local structure assessm ent with varying standoff distance... 49
Figure 4.6 -Blast properties with varying angle of incidence... 50
Figure 4.7 -Colum n boundary conditions...50
Figure 4.8 -Ultim ate resistance equations (UFC,2008)...50
Figure 4.9 -Elastic response with varying different boundary conditions and blast weight ... 51
Figure 4.10 -Plastic response with varying different boundary conditions and blast weight ... 53
Figure 4.11 -Local structure assessm ent with beam tributary width...54
Figure 4.12 -Local structure assessm ent with beam length ... 55
Figure 4.13 -Local Structure A ssessm ent with Colum n H eight ... 56
Figure 4.14 - G lobal assessm ent fixed param eters ... 60
Figure 4.15 -Location of m axim um m om ent...61
Figure 4.16 -Ratio of m axim um linear dynam ic m om ent to beam plastic capacity ... 61
Figure 4.17 -Typical plastic hinge curve for flexural elem ents... 62
Figure 4.18 -165M ph/13ft/0.75LL...63 Figure 4.19 -165M ph/13ft/0.5LL...63 Figure 4.20 -165M ph/13ft/0.25LL...63 Figure 4.21 -165M ph/15ft/0.75LL...63 Figure 4.22 -165M ph/15ft/0.5LL...63 Figure 4.23 -165M ph/15ft/0.25LL...63
Figure 5.1 -Current and possible application m odifications... 66
List of Tables
Table 3-1 -W ind loading calculation ... 24
Table 3-2 - Calculation of colum n forces...25
Table 3-3 -Colum n design procedure...26
Table 3-4 - B eam design procedure ... 27
Table 3-5 -Scaled distance equation...28
Table 3-6 -Standoff distance R with varying weight of explosive W and Scaled Distance Z... 28
Table 3-7 - E quivalent reflected blast duration...29
Table 3-8 -Colum n properties...31
Table 3-9 - E quivalent colum n elastic properties ... 32
Table 3-10 -Elastic response check...33
Table 3-11 -Colum n E quivalent Plastic Properties and Requirem ents ... 34
Table 3-12 -Recom m ended plastic lim its (N assr, 2012)... ... 36
Table 3-13 -Com bined B eam Check w ith Colum n Rem oved ... 38
Table 3-14 - A pplication inputs ... 42
Table 4-1 -Inputs used for standard case...46
1
Introduction
1.1
Background
Structures are designed to cater for conditions specific to their use and location. National Standards guide structural engineers with the development of a structural scheme, within the prescribed geometry, to satisfy the loading conditions specific to that structure. Based on collected data and the ability to approximate future trends through probabilistic analysis, loadings such as wind and seismic activity can be accurately predicted for future time periods. These principals unfortunately cannot be applied so easily to blast loadings.
A blast on a structure can either be pre-meditated or accidental. An example of the former would be most commonly known as a terrorist attack while the latter might arise from the ignition of a gas leakage. Focusing on terrorist attacks, the spectrum of possible explosion situations in addition to the limited collected data is such that it is extremely difficult to narrow a blast design procedure on a structure to a small number of possibilities. One thing is for certain, a terrorist attack will attempt to maximize failure of their target with the priority of causing loss of life.
In 1995, a domestic terrorist attack was carried out on the Alfred P. Murrah Federal building in Oklahoma City. A truck filled with homemade explosives, thought to be the equivalent of 4,000lbs of TNT, was parked in the close vicinity of the federal building and detonated. Aftermath studies by the
National Institute of Standards and Technology (NIST) and the Federal Management Emergency Agency (FEMA) concluded that the blast initially wiped out 4% of the total floor area, and this led to a further 38% of the floor area being destroyed through progressive collapse. Figures 1.1 to 1.4 show the damage of the explosion and also display some of the characteristics of the blast. The blast was determined to be approximately 15.6ft from the nearest support of the Federal Building. Due to the lack of redundancy, the building was incapable of containing the initial 4% of damage, and therefore activated progressive collapse.
Figure 1.1 -Aftermath of attack on Murrah Federal Building, 1995
Pressure Distribution
Moon. wt: 4000 pouds 14 s
Vatdaff dbsance: 10 feel
<H
4000psi-86r0si
Figure 1.3 -Pressure distribution at 10 feet Standoff Distance from detonated explosion (NIST)
Figure 1.2 -Blast and Progressive Collapse damage (NIST) I N.W. Filh Stree I' ,| -- SkW^O Cob" em0
Figure 1.4 -Details of the explosion and the immediate interaction with the Federal Building
(NIST)
Studies of the initial structural construction drawings and design guidelines of that time period showed that the Federal Building was satisfactory for the design period, but seriously lacked the redundancy and continuity recommended for structures today.
Another example, which demonstrates the catastrophic results of structures with poor resilience under blast loading, is the partial collapse of Ronan Point apartment tower. In 1968, a gas explosion
occurred on the 18th floor of the building and this caused the collapse of a corner section of the building, killing 17 people. In this instance, the investigation of the original design concluded that the design techniques and construction methods were deeply flawed (ASCE). The superstructure consisted of precast panels and hollow core slabs with the connections relying mainly on friction to transmit forces,
therefore seriously lacking capacity to re-distribute loads. An example of one of the main connection details can be seen in Figure 1.6 below, and this portrays the poor continuity of the detail. The floor slab bears onto the vertical panel and the primary restraint holding the panel and slab comes in the form of a clamped threaded rod. The Building Codes at that time were not satisfactory for these types of structures and have since been developed to provide better designed structures.
Figure 1.5 -Aftermath of the gas explosion on the 18th
floor of Ronan Point (Delatte 2005)
LG
bi&~
Horizontal joint between
floor slab and flank wall
Figure 1.6 - Typical structural connection detail
between wall panel and floor slab (ASCE)
These unfortunate incidences, along with the events of 9/11 have led to significant research efforts on the abilities of a building to cope with adverse loadings, particularly through the provision of resilience and robustness in the superstructure.
1.2
Blast Loading
During an explosion, a rapid exothermic chemical reaction occurs producing a large amount of energy in a small-confined volume. The explosive material transforms into a hot, dense, high-pressure
gas, which expands outwards in an attempt to reach equilibrium with the surrounding air. This formation is known as a shock wave.
As the shock wave radiates outwards, the pressure decreases with the cube of the distance due to geometric divergence, in addition to energy dissipation with heating the air. Figure 1.3 shows the influence of distance on the resultant pressures changing significantly over a 20ft height from 8,600psi to 500psi. The positive shock wave dispersing out from the source at supersonic velocities is followed with a negative shock phase where the pressure of the explosion dips below the ambient temperature. This pulls air back towards the origin of the explosion in an attempt to reach equilibrium. A typical time history graph of an explosion is illustrated in Figure 1.7 below.
+ Pressure Peak Ind"n Atmospheric Pressure Timo of Arival
-Pressure ~N~tive Phase
Figure 1.7 -Typical pressure time history (FEMA 426)
1.3
Preventative Measures
Unlike natural hazards, acts of terrorism are executed with the intention of maximizing their consequences. In the context of blasts, terrorists deliberately locate explosives to exploit their target in an attempt to cause most devastating results. Therefore, it is virtually impossible to eliminate the threat of blast attacks entirely on an urban building. However, through a combination of structural and non-structural measures, the risk of potential catastrophic failure to a target building can be controlled and in most cases prevented. The U.S Department of Homeland Security (USDHS) and U.S Department of Defence (DoD) have been particularly active on this topic in recent years, publishing several documents and procedures to assist engineers with mitigating the impact of blast loading on structures, and in turn human life.
The bombing in Oklahoma City in 1995 unfortunately provides a fitting example of how through the absence of preventative measures, both structural and non-structural, can lead to the collapse of a building. Three key elements collectively triggered the collapse of the Federal Building and are described below. These will form the core of this research.
0 Loading Condition - The two primary contributors of a blast are the weight of TNT W and the distance between the detonated explosive and target building elements, known as the standoff distance R.
Cost to Provide
Force Protection SOURCE: U.S AR FORCE, INSTALLATION
Lo Staid-off Distuuc Betwo. Uitw md Asuet 6eu
Figure 1.8 -Significance of Standoff Distance (FEMA 426)
The standoff distance has more influence on the resultant blast pressure than the weight of the explosive, which is due to rapid energy dissipation over distance. Figure 1.8 demonstrates the significance of this, showing how distancing the threat reduces the cost of protection exponentially. That being said, increasing the standoff distance can be difficult to implement in urban areas with land being a precious commodity.
* Element response - The blasts addressed in this research will initially impact the building in a confined manner due to the highly localized pressures released. The strength of the immediate primary building components are consequently the first structural concern.
* Frame stability - Following the localized impact of the blast is the issue of global stability. If components are compromised, structure surrounding them must have sufficient capacity to create new load paths and re-distribute forces safely to other support members. Failing this will trigger disproportionate failure and possible collapse of the structure.
1.4
Motivation
The consequence of a terrorist attack on a building is a topic that has received a lot of attention in recent times. Government agencies have published documents to assist engineers with the design of resilient buildings capable of withstanding adverse loadings. One such document issued by the UFC, 'Structures to Resist The Effects of Accidental Explosions' describes methods for quantifying design pressures, impulses and durations of an explosion based on empirical data, while also enclosing "design
procedures and construction techniques whereby propagation of explosion or mass detonation can be prevented" (UFC,
2008). While this document presents a comprehensive breakdown of how one would go about assessing structural elements for a blast, it is not widely used in the industry. In many cases, the localized assessment stage is omitted and the assumption of structural support(s) failing is automatically made. Focus is therefore placed on the structures ability to cope with a support removal by redistribution of loads to adjacent supports and safely into foundations.
To date, there is an absence of a common procedure to fully assess the structural integrity of a building subjected to a blast load. This research will therefore seek to develop an automated software application with the ability of simulating a blast event, assessing the immediate components of a structure and further investigating possible progressive collapse of a building. The second part of the research will conduct studies using the constructed application and varying input parameters (e.g. blast magnitudes, building geometries, geographical locations, loading conditions, material limits etc.) to provide a better understanding on blasts and their effects on buildings. Furthermore, investigations on various building topologies will be carried out to see if certain geometries are more susceptible to blasts, and if in fact certain buildings are inadvertently blast resistant due to building code regulations and specific design loading requirements.
2 Structural Response to Blasts
An explosion can impact a structure from both a local and global perspective. As previously noted, if a primary element of a building fails, then the structure surrounding that element must be robust enough to cater for the additional loads, and create new load paths. Failing this will instigate disproportionate failure. Subsequently, engineers with the task of designing a structure for blast events must consider the target-localized area of the blast in combination with overall global stability of the structure.
"This combination of threat-specific and threat-independent design provides the most robust structural systems that are able to survive both the anticipated and the unimaginable catastrophic events" (O'Duesnberry, 2010).
2.1
Building Enclosure
The first component of a building to experience the pressure of an external blast will be the building envelope. Cladding commonly made up of glazing and infill walling has the potential to cause serious injuries to the building occupants. Flying debris entering the building can cause lacerations and blunt trauma injuries, and potentially fatalities. Additionally, if a blast pressure infiltrates the interior of a building, occupants become further at risk, becoming susceptible to eardrum rupture, lung collapse and also being hurled against solid objects.
Nowadays, when a building is designed for blast loading, particular attention is placed on the cladding design. Brittle failure must be avoided, as ductile flexural inelastic systems that can reduce the spread of debris are favoured. Glass, one of the primary materials used as a building enclosure has been advanced to cope better with impulsive pressures. Laminated glass, typically used in the automotive industry, is composed of two or more layers of monolithic glass & inter layered with a polyvinyl sheets. This form improves the ductility of the glazing systems and better holds fragments together after breakage. For these reasons, it is now being used in the building industry.
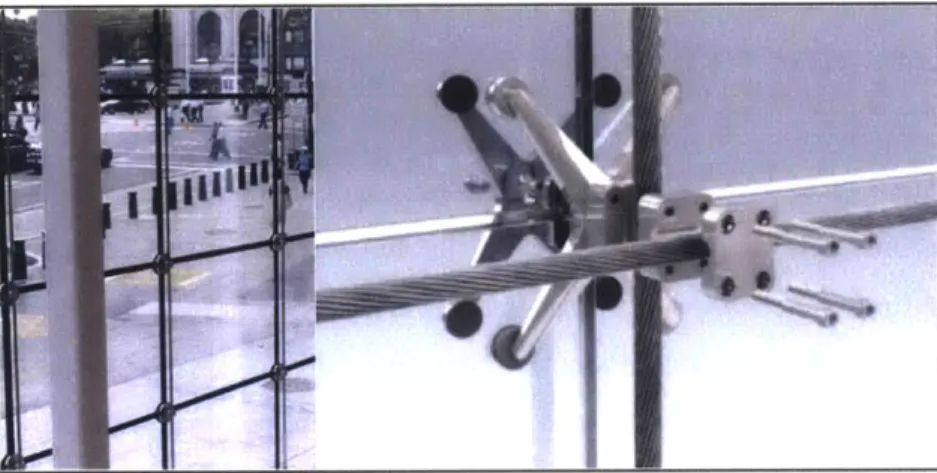
Glazing support systems have also received attention. Cable support systems shown in Figure 2.1 are employed to absorb energy from the blast, and subsequently reduce impact on the superstructure.
Figure 2.1 -Blast resistant glazing facade (Sentech Architectural Systems)
The interaction of the building envelope and primary frame is highly complex when considering impulsive pressures. The first question that needs to be asked is whether the cladding remains intact, receives considerable damage or is totally removed. Assuming the cladding can resist the blast, how will it respond with the primary frame? The answer depends on the natural properties of the cladding and support system. For the case of the cable support systems, the natural period will be orders of magnitude larger than the natural period of the primary structural components supporting it, and will prolong the duration of the load transfer between the building envelope and building frame. Therefore, in a simplified description, the primary member can initially deal with the blast acting on the member surface and following this cater for the loads transferred from the pressure acting on the facade. This assumes the cladding remains intact which is questionable.
In the context of this research, it has been assumed that the cladding has been compromised and transmits no loads to the primary frame. The simulated blasts are highly impulsive and substantial in magnitude, generating reflected pressures of up to 2000psi. With the cladding removed, the magnitude of the pressure acting on the primary support elements will depend only on the catchment area (see Figure 2.2) of the element exposed to the blast waves.
2nd Fkoor
Applied Blast 7: Pressure P(b)
-Targ Column
Figure 2.2 -Application of blast pressure on column flange
2.2
Structural Elements
Unlike seismic ground motions where the entire structure is excited, blast loading is more concentrated on the structure in the vicinity of the explosion. Perimeter structural components should therefore be robust enough to resist specific external blast events, noting that the structural performance will be that of inelastic, plastic behaviour rather than elastic. Otherwise the results would not produce feasible
section sizes. In addition, similar to seismic design, the structure should have a "strong-co/umn,
weak-beam"
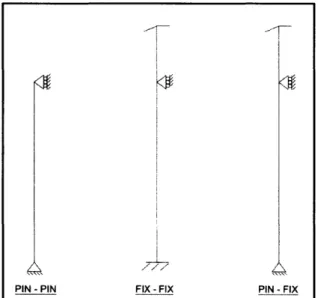
structural arrangement to prevent the formation of plastic mechanisms on the columns and possible global instability concerns.Boundary conditions are an important consideration when assessing columns as isolated elements. To simulate an accurate model, close consideration of the interaction between the element and the building frame is vital. This research will focus on fixed and pinned boundary conditions, which is an acceptable assumption due to the large difference in natural periods between individual components and those of the holistic structure. Possible column boundary conditions are shown in Figure 2.4 and will be discussed in more detail in Chapter 3.
PIN -PIN FIX -FIX PIN -FIX
Figure 2.4 -Possible column boundary conditions
2.3
Frame Stability
Maintaining the global stability of a building is the fundamental objective when considering blast loading. Unlike general loading conditions (e.g. wind and gravity loads), where a frame is designed to remain elastic, a blast resistant building, due to the magnitude and uncertainty surrounding the loading, must be analyzed to behave in-elastically. Subsequently, the assessment of a structure under blast loading requires heavy computational analysis to best capture the non-linear dynamic response.
As noted above, recent historic events have led to increased efforts to develop a common standard to assist engineers with implementing a resilient structural design capable of withstanding extreme loading conditions. In 2009, the DoD published UFC 4-023-03 'Design of Buildings to Resist Progressive Collapse' to better educate engineers on resilient and blast resistant design. The report offers guidelines on different design methods that can be adapted to re-distribute loads in the event of a support being removed. Two such methods include the Tie Force Method and Alternative Path Method. The former incorporates vertical, horizontal
and peripheral ties to redistribute loads axially while the latter relies on the ductility and continuity of the structure to bridge over removed structural components.
2nd Floor Be rms
.1
__________________________________________Iii
IIIiiiiz:\
Bay Widu. 1st Floor Level V7 Target column removed due to * * blast pressure (b) Bay WidthFigure 2.5 -Increased beam span due to column removal
The Alternate Path Method, which will be the primary focus of this research, exerts greater demand on the material of a building frame under extreme conditions, which in turn allows for greater performance levels of the members. The process can either be applied using linear static, non-linear static or non-linear dynamic analysis. With a non-linear dynamic analysis, non-linear properties of the structure are considered as part of a time domain analysis, and the assessment covers the complete loading process, from stress free state through to non-linear behaviour under extreme loading leading to collapse. This precision best calculates the dynamic nature of the structure and the damage-state behaviour of the structural elements.
3
Application Development
The proposed tool can be categorized into four primary components:
1. Frame Analysis & Design
2. Blast Loading
3. Element Response
4. Frame Stability
Java has been adopted as the software tool for coding the application. Java, an object-orientated interface, allows the user to create modular programs and reusable code, which is desirable for the requirements of this research.
To achieve the objective set out for this thesis within the given timeframe, it was necessary to simplify certain areas of the analysis while still maintaining the sensitivity of the results to the parameters. Throughout this chapter, the methods and calculations used in each stage will be presented in detail and any assumption will be documented.
3.1
Frame Design
To facilitate a parametric study of different building geometries, the first requirement of the application will be to assess a building topology, determine the design forces in the critical members under the relevant ASCE 7 loading combinations, and furthermore produce a section size adequate to cater for the loads in accordance with the AISC Construction Manual.
3.1.1
Design Loads
A critical parameter for the frame design will be wind loading. The MWFRS (directional Procedure), as outlined in ASCE 7, will be adopted to determine the magnitude of wind pressure acting on the frame. The design pressure, which varies with height, will be applied as equivalent point loads at each story level.
Wind Pressure (Directional Procedure), p = qGCp - qiGCpi (lb/f t2):
o Velocity Pressure (Directional Procedure), q = 0.00256KzKzt KdV2 (lb/f t2) o Risk category for the building = III
o Basic wind speed = User Defined (mph).
o Kd (Directionally Factor) = 0.85. o Kt (Topographic Factor) = 1.0.
o Exposure B, Surface Roughness B.
2
o K =2.01 (i a as 15ft z zg
Sa= 7,z. = 1200 zi = Height to floor i.
o Enclosed Building, GCp1 = T 0.18.
" G (Gust Effect Factor) = 0.85.
" Cp (External Pressure Coefficient) = 0.8, windward wall.
Table 3-1 -Wind loading calculation
Gravity loading is also considered with dead and live loads being input parameters in the application and can be adjusted to suit the occupancy and floor make-up of the building.
3.1.2 Element Design
3.1.2.1 Column Sizing
The frame will be idealized as having rigid stories for calculating the design forces in the columns. The shear stiffness method will then be applied to determine the base shear in both the internal and external columns under lateral loads. Table 3.2 shows the breakdown of the steps taken to calculate the moments in the columns.
* Total base shear, Vt, = zJoFloors p * Tributary Area.
* Resolving base shear, Vt0 = 2VE + jVI
* Applying the stiffness method to estimate moment in columns:
k - 3EICE 1 _ 2EICE
0 kE V3 h+3CEh a
k o k 3EICE 1 2.182ElcI
; ha u (ic/h h
~14\
lb/L)o As the floors are assumed infinitely rigid, the I ( portion goes to zero.
* Caculate approximate shear in exterior and interior columns using E kE
VI k1
* Mmaxa(nt) = V* Column Height (kip - ft)
* Mmax(ext) = VE * Column Height (kip - ft)
Notation
Number of internal columns E Young Modulus of Steel
V, Internal Column Base Shear ICI Internal Column Moment of Inertia
kE External Column Stiffness L Beam Length
1xx of Interior Column, Ic= 1. 5 * Ixx of Exterior Column, ICE Ic= 1.5 * ICE
Table 3-2 - Calculation of column forces
With the bending moment and shear and the axial forces obtained, the columns can then be designed to the requirements of the AISC manual and in accordance with the strength design-loading combinations
provided in ASCE 7.
Buckling Check:
* Design Load Case - 1.2DL + 1.6LL
* Column Design Strength for flexural buckling limit state, Pc = c n where Pn = AgIFr
KL Fy Ac E rn E o For < 4.71 J: Fcr = (0.658"c2 f KL f7 0.877) o For - > 4.71 -: Fcr 2fy ry EE Notation *t q j;
:A
TPn Nominal axial strength
Ac
Slendernessjc
N 77N
777171 P P
Fa, Buckling stress for the section
f7
Minimum steel yield stressCombined Bending & Compression:
Design Load Case - DL + 0.6W
o f + 'rx < 1.0 for Ip > 0.2 Pc 9 Mcx c " + M 1.0for
/P
<0.2 2PC Mcx c " Mcx =0.9fYZX NotationMrx Required flexural strength zX Column plastic section modulus
Table 3-3 - Column design procedure
The effective length factor for the column sizing will be set as an input parameter, and can be adjusted appropriately based on the user's best engineering judgement.
3.1.2.2 Beam Sizing
In the event of a column being compromised, the adjacent beams will need to work together as one member to bridge over the removed support and re-distribute loads to adjacent supports (see Figure 2.5).
26
Table 3.4 describes the procedure used to design an appropriate beam size based on the defined building geometry.
Flexural Check:
* Design Load Case - 1.2DL + 1.6LL
-< < 1.0 Mcx
Combined Bending & Compression:
* Design Load Case - 1.2D + 1.0W + 1.0L
* + 8 Mrx < 1.0
for
Pr/ > 0.2PC 9 Mcx 'PC
* + < 1.0 for Pr/p <0.2 2Pc Mcxc
o K - Factor = User Defined.
Serviceability:
* Beam Deflection < s for combination DL + LL and 4 in
250 5
6
midspan -384E
o w = distributed load /ft
'reqiredwL 4
* Irequire= 384E(a or in)
Table 3-4 -Beam design procedure
Similar to the column design, the beam effective length factor will be an input parameter.
3.2
Blast Loading
-
Empirical Method
The empirical method consists of published equations, graphs, tables, and figures to allow one to determine the principal loading of a blast wave on a building or a similar structure (O'Duesnberry, 2010). This system is favourable due to its simplicity. A blast weight and distance from the target are the primary inputs. From these, a common measure known as the scaled distance can be determined.
R Scaled Distance, Z =
1
W
-R = Standoff Distance (ft) W =Weight of TNT (lbs)
Table 3-5 -Scaled distance equation
From the above equation, it can be seen that Z is proportional to the standoff distance R and inversely proportional to the cube root of the weight of the explosives W, clearly identifying the standoff distance as a critical influence on the resultant magnitude of an explosion. Standoff distances are presented in Table 3.6 with varying Z and W. As can be seen, the closer the explosive is to the target, the lower the corresponding Z value. Scaled Distance 'Z 2.00 2.50 3.00 4.00 5.00 Wei ht of TNT'W' (lbs) 9 13 16 18 20 23 95 34 12 16 20 23 25 29 31 43 14 19 24 27 30 34 38 51 19 25 32 36 40 46 50 68 23 31 40 45 50 57 63 85
Table 3-6 -Standoff distance R with varying weight of explosive Wand Scaled Distance Z
The basic blast properties are firstly determined using Figure 3.3. It is then necessary to examine the
interaction of the blast wave with the target building. Depending on the angle of incidence with the building, a certain amount of reflection will ensue and the initial properties must be altered accordingly.
Typically, when a blast wave reflects off an object with zero angle of incidence, the wave returns towards the source of the blast. This reflection amplifies the blast pressure and produces a larger pressure force on the target. In some cases, the reflected pressure can be up to eight times larger than the peak incident pressure Pso.
28 V
P
PR ---
-pR
PS0
tA tA+to t
Figure 3.1 -Pressure difference due to reflection
0
0
0
0
PR = Peak Reflected Pressure Pso = Peak Incident Pressure
tA = Time of Arrival of Blast Wave to = Positive Phase Duration
To determine the reflected wave pressure and scaled impulse, Figure 3.4 and 3.5 are used. From this the equivalent fictitious blast duration can be determined.
2 i4
Fictitious Blast Duration : tE -
-ir - Reflected Impulse (psi - ms)
PR- Reflected Pressure (psi)
Table 3-7 - Equivalent reflected blast duration
The outcome of the above procedure produces the idealised loading conditions of the blast wave, which linearly decreases from the peak reflected pressure down to zero over the calculated duration.
P
PR
Pressure Load for
Structural Analysis
0
tE tFigure 3.2 -Idealised pressure loading
*0
0
PR = Peak Reflected Pressure
100000 50000 3M~ 20000 5M0 3000 2000 1000 Soo 300 200 100 50 30 20 10 S 3 2 0.5 0.3 02 0.1 0.05 0.03 0.02 0.01 0.005 0.1 ---P, psi --- Ps i ... 1O3 psifnf*b ... lr pWff 113 --- t W Sca*- D Wnce Z - R,
Figure 3.4 - Pressure coefficient versus angle of incidence (UFC 3-340-02)
4W PWAk Incdn 0-wp-sis, Pei
300 -- IOW - 50 -- 2 --- 7?W - 20 -- 1. 2W -.. 400 - 10 1.0 10--0 ...--... 7 70 50~ 0 10 20 30 40 so Aiqbi. a u~c.U(imp...)W0 70 W0 90 Figure 3.5 -Reflected scaled impulse versus angle of incidence (UFC
3-340-02) 30 2* -5000
~3000-
10so - aOm esm - si 2 2000~ 30 -- - 1000 30 --- 50 10 -00-0 - 3 - 2 200 1 10- -0. 100 -- 02 -- - - - -60 70 so goFigure 3.3 -Shock wave parameters for hemispherical TNT explosion (UFC 3-340-02) 1 .... ... ... ... . ... .... .. I 0 10 20 30 40 so
An&i of Wncdswwe a (DagmQs
3.3
Element Response
The next step will be to apply the loading conditions of the blast to the target structural components of the building frame. This will be evaluated by analysing the column as an equivalent dynamic single degree of freedom system (SDOF). The distributed mass of the element is lumped together and strain energy is stored in a weightless spring. It should be noted that some analyses based on this model require a non-linear spring.
Qe(t) e Qe (t) = External Loading
S Ime
e
ME= Equivalent Element MasskE = Equivalent Element Stiffness
Figure 3.6 - Idealised SDOF system
It is first necessary to determine the actual structural element properties.
" Total Element Load: Q = P(B)(L*bf)
" Boundary Conditions: Pin - Pin:
Q 384E1 o Actual Stiffness: k = - = L o Yield Displacement: u = 384 L2 _QL __48E] o Yield Displacement: M = - = - u 8 8 5L
* Boundary Conditions: Pin - Fixed
o Actual Stiffness : k = Q = u 03 o Yield Displacement: u, = 154 L2QL 185E1 o Yield Displacement: M = =1 = - u 8 8 8L
* Boundary Conditions: Fixed - Fixed
o Actual Stiffness : k = 384E
u 0
o Yield Displacement:uy = 34
o Yield Displacement: M = = = u
3.3.1 Elastic Behaviour
To capture the response of an elastic system, it is necessary to modify the actual column properties of the column. The kinetic energy and work done in the equivalent system are evaluated to calculate reduction factors, and these are applied to the column properties. Consequently, varying the type of loading and boundary conditions will impact the elastic performance of the SDOF.
* Stiffness of Equivalenet SDOF: ke = Qe
U
" Natural Period of Equivalenet SDOF: Tn = 2 e
* Boundary Conditions: Pin - Pin:
o Load Transformation Factor: aQ = e= 0.64
o Mass Transformation Factor: am =
$
m = 0.5* Boundary Conditions: Fixed - Fixed:
o Load Transformation Factor: aQ = 0.53
me o Mass Transformation Factor: am =
0
0.4Table 3-9 -Equivalent column elastic properties
With the characteristics of the equivalent SDOF and the idealized blast duration known, the response of the system can then be found using Figure 3.7. Based on the ratio of the duration of the loading with the natural period of the system, the dynamic load factor (DLF) and load duration is read
off the graph.
L5 L6 1.5 0.01 0m .0 .M&07o 0.1 0.2 0, 050.7 1 2 3 4 567810 1W5U
Notation
T, Elastic natural period of the column
Figure 3.7- Maximum Response of Elastic System due to
Triangular Load (UFC 3-340-02)
To check the adequacy of the column under elastic response, the following procedure is performed.
ur -- * us = Static Displacement
= D LF
us - u, = Yield Displacement
us* DLF < uy (for the system to remain elastic).
0 um = Peak Elastic Displacement
Table 3-10 -Elastic response check
3.3.2 Elasto-Plastic Behaviour
In the event the column is insufficient to remain elastic due to the blast loading, a check must be carried out on the plastic performance of the element. Similar to the elastic method, reduction factors are calculated through assessing the kinetic energy and work done by the SDOF, and applied to the actual column properties.
" Natural Period of Equivalenet SDOF: T', = 27rJejkfe * Boundary Conditions: Pin - Pin:
o Load Transformation Factor: aQ = Qe = 0.53
Q
%titLWIo
-I
o Mass Transformation Factor: am = = 0.41
m
" Boundary Conditions: Fixed - Fixed:
o Load Transformation Factor: aQ = = 0.5
Q
o Mass Transformation Factor: am =m m = 0.33 " x = Ductility Ratio = it
XE
0
0
Xm = Maximum Transient Deflection
XE =Equivalent Elastic Deflection = RU
KE
R- Ultimate resistance of the element.
- KE - Equivalent stiffness of elastoc system.
Table 3-11 - Column Equivalent Plastic Properties and Requirements
Figures 3.8 & 3.9 are used to estimate the behaviour of the column under a plastic, inelastic response. The ratio of the total deflection to the elastic deflection (Ductility Ratio) can be used to quantify the damage in the column.
0.1 02 0.3 0.4 0.8 0.7 1 2 3 4 5 6 76 10 T/Tw 0.9 '5 20 I-J C1 02 0.3 OA 0.6 0? 1 2 3 4 5 6 7 8 10
Figure 3.9 -Maximum response time of Elasto-Plastic SDOF (UFC 3-340-02) 34 61 01A " a 1i D. 0. ,7 BA* (2 20 00 0.7 00 OA 0S
0.05 LOGE Imme"l. Fwetl
02 Nublno m s P 0.4 023 /
~~K
.-
t7
02 T X1 aTkieoguI RIstowoo GIspIsneP
Mo, ied , Fetis FWAIstIe
Figure 3.8 -Maximum deflection of Elasto-Plastic SDOF (UFC 3-340-02)
3.3.3 Column Re-Design
Upon studying the response of the column for elastic and plastic behaviour, it may be required to upgrade the section size of the frame to resist the subjected blast loading. One of the design steps of the application will therefore be to increase the column section to achieve the plastic limits specified by the user.
Code fragments from the application, shown in Figures 3.10 and 3.11, indicate how the process is implemented. A factor of safety, initially set at a value of 1 for the blast response procedure, is increased in small increments until such time that the ductility ratio falls within the prescribed limits. This increased factor of safety is applied to the initial design loads and results in a larger section size after a number of increments. This upgraded section is then checked for the blast loading and the process is repeated until an adequate section for the blast pressure is determined.
if (ductJltyRotio > ductilityLimit) {
double %- 0;
while (ductllityRatio > ductilityLimit) {
, - 1 + 0.01;
columnFactorOfSofety - columnfoctor0fSafety + i;
columnixx - retrievingColumnSections.lxx(bayWidth,
tributory~idth. deadLood, liveLood, numberfStorys,
floorHeight, kFactor, yieldStrength, compressionf actor, numberOfBoys, torgetColumn, columnFoctorlficfety, Aindspeed);
columnSx - retrievingColumnSections.Sx(bysidth, tributoryWidth, deodlood, liveLood, numberlfltorys, floordeight, kractor, yieldStrength, compressionioctor,
numberOfBoys, torgetColumn, columnfactorlfSafety, eIndspeed);
colunnZx - retrievingColumnSections.Zx(baysidth,
tributory~idth, deadLood, 'iveLoad, numberOfltorys,
floorHeight, kFactor, yieldStrength, compressionFactor,
number0fBays, torgetColumn, columnfoctorOfSafety,
windspeed);
columnLinearWeight - retrievingColumnSections. Ngt(bayidth, tributoryidth, deadLood, liveLood, numberOfltorys,
floorHeight, klactor, yieldStrength, compressionfoctor,
numberOfBoys, targetColumn, columnfactorOflefety, eindspeed)
;
columnfl oneWidth - retrievingColumnections.8f(boysidth,
tributoryidth, deadLood, livetood, numberOfStorys,
floorHeight, kFactor, yieldStrength, compressionFoctor,
number0fBoys, torgetColmn, columnfactorOfSafety, *indspeed);
Figure 3.10 -(Application fragment) Column
re-design
if (slenderness - (4.71 * Moth.sqrt(29888 / fy))) {
double fcr - (Mothpow(G.658, (Moth.poe(londo(, 2))) *fy);
double pn - fc* a;
double PC - pn GA; double mc - 0.9 * fy * zx / 12; if (dedAxial / PC u- 0.2)
double check - deadAxial / pc + (9.8888889)
* (*indMoment / mcx);
if ((check * factorOflufety) < 1.0
&L (ultAxial * factorOfSofety) < pc) f return "48";
} else if (deadAxiol / pc .0.2) {
double check - deadAxial / (2 * pc) * (AindMoment / mcx);
if ((check * factortflafety) < 1.0 LL (ultAxial * factor~flufety) < pc) {
Sreturn "48";
I else if (slenderness, (4.71 * Moth.sqre(29do8 / fy)))
double fcr - (8.877 / Math.pow(landal, 2)) * fy; double an - fcr *a;
double pc - n 8.9; double mcx - 8.9 * fy * zx / 12; if (deodAccul / PC >- 8.2)
double check - deadAxal / pc + (8888889)
* (windoment / mcx);
if ((check * factorlfSafety) < 1.0 & (ultAxial * factorlflafety) c pc) {
return "48";
I else if (deadAxial / pc C 0.2) {
double check -deadAxial / (2 * Pc) + (*indMoment / mcx);
if ((check * factorlflofety) , 1.8
" (ultAxial * factorfSafety) c pc) {
return 49";
Figure 3.11 - (Application fragment) Column design
equations
As mentioned above, the limiting values used for the inelastic behaviour of the column (ductility ratio and the angle of rotation at the joint) are inputs required from the user. There are no set limiting
values utilized in the industry for plastic response, however recommendations are made. The UFC suggests the following limiting deformation criteria.
Table 5-4 WMMry Of C krm iN Crkerft
p
Btefoo 1 - a
p 8
p 20
6 mxnm nuner end ,otmtlan (dggrmes muuawud 1om the chord joinng the
p= atyored bc
Figure 3.12 - Deformation Criteria (UFC 3-340-02)
Research carried out by A. Nassr and presented in 'Strength and Stability of steel beam columns under blast loads' uses finite element software to analyse finely meshed columns under blast loads to better understand the response. Nassr also studied the interaction of a permanently deformed column and the compression forces it experiences, and his conclusions can be seen in Table 3.12.
"For a maximum ductility ratio of 3.0, the P/p < 32%"
"For a maximum ductility ratio of 2.5,the P/p < 40%"
"For a maximum ductility ratio of 1.6, the P/p < 60%"
* P = Axial Load Applied
* = Euler Buckling Load
Table 3-12 -Recommended plastic limits (Nassr, 2012)
Due to the uncertainty surrounding the allowable bounds for columns under plastic behaviour, the plastic limits are not fixed in the application and are required inputs. Figure 3.13 below shows a typical output for a re-designed column, based on a ductility limit of 2.5 and maximum joint rotation of
2*.
COLUMN RE-DESIGN Pin - Pin:
Blast Column Size - 132
Column Increase Factor 1.15
Updated Ductility Ratio 2.5 0 Column Size = 90 -+ W14x9O
Rotation 1.7536834015026037
Peak Displacement 2.3881346517197493
Figure 3.13 -(Application Extract) Re-design results
3.4
Frame Stability
A global appraisal is required if a target column fails. Three methods will be used to assess the
global state of the structure: a linear static analysis, linear dynamic analysis and non-linear dynamic analysis.
3.4.1 Linear Static Analysis
When a column fails in a structure, the beams of the adjacent bays must work to transfer the loads to adjacent supports (see Figure 2.5). In the case of this research, if the column is removed, the primary beams must effectively span twice their distance to the adjacent undamaged columns in the bay.
A combined linear check for the increased span will initially be carried out based on the
procedure outlined below. It should be noted that it is necessary to apply an amplification factor to better simulate the response of a system when carrying out a linear static analysis for a dynamic loading. The General Services Administration (GSA) and the Department of Defense (DoD) have recommended the value of 2 for the Dynamic Amplification Factor (DAF), however this software tool will keep the
DAF as an input parameter so it can be adjusted at the preference of the user.
P P+ cmxMx + CmyMy < 1.0 Pu (1- P/pM mx P/py)Mmy -* -+ Mx + M < 1.0 for 2p' > 0.15 Pp 1.18Mmx 1.18Mmy M MX+ -y < 1.0for P < 0.15 MPx MY /Pp
* Dnamic Design Stress ( p < 10 ), fds = fdy = c x a x fy
o p = Ductility Ratio
o fdy = Dynamic yield stress.
o a = average strength increase factor (for fy <= 50ksi, a = 1.1)
o
fy
= static yield stress* Ultimate dynamic moment, Mpu = fdsZ
o Plastic Section Modulus, Z =
Acm1 + Atm2 (for double - symmetric section)
A = area of cross section in compression
* ml = distance from neutral axis to the centroid of the area in compression
" At= area of cross section in tension
" m2 = distance from neutral axis to the centroid of the area in tension
* Design Plastic Moment, M = fds(Z+s)
MP 2
o S Elastic section moduli o Z =Plastic section moduli
* Slenderness limit check, c, =
(2r2E
0.5fds)
o E = modulus of elasticity of steel (psi)
* Ultimate strength of axially loaded compression member, P = 1.7AFa
o A = gross area of member /K 2
1- 2C2 fds
o Fa- ,where K = largest effective slenderness ratio
s 3(K) K'Ir r
3 8Cc C3
d412r [1 d 257 P
0 -a= -1.4-] when- <0.27 and -= -when - >0.27
tw fy Py Py tw fy Py
o P = Applied compressive load
23 23
S Px = -A * F'ex and Pey = -A * F'e
12 e ey 12 e
" F'ex = 12nE 2 and Fe = 12
2
E2 23 (Klbrx)
2 3(Klb/ry)
o lb Un-braced length in the plane of bending o rx / ry = respective radii of gyration
* Pp = Afds
Table 3-13 -Combined Beam Check with Column Removed