Detection of Improvised Explosive Devices at Long-Range Using Coded Aperture Imaging of Backscattered X-Rays with Dynamic Reconstruction
by
MASSACHUSETTS Jayna T. Bell OF= F C.. E I"L B.S., Environmental Science (2000)
AUG
1
9
2
The United States Military Academy
INSTITUTE tOGY
009
IES
Submitted to the Department of Nuclear Science and Engineering in Partial Fulfillment of the Requirements for the Degree of
Master of Science in Nuclear Science and Engineering at the
Massachusetts Institute of Technology May 2009
© 2009 Massachusetts Institute of Technology All rights reserved
ARCHIVES
Signature of Auth Certified by ... Certified by ... ... Certified by ... .... ... Accepted by ...Department of Nuclear Science and Engineering May 8, 2009
v1
Richard C. Lanza
Senior Res cientist i uclear Science and Engineering
S/ Thesis Supervisor
/
(4-
,...Jacquelyn C. Yanch Professor in Nuclear Science and Engineering Thesis ReaderBerthold K.P. Horn Professor in Electrical E gineering and Computer Science
L
6
,; Thesis Readerrofor "'c Tacquelyn C. Yanch rossor in clear Science and Engineering Chairman, Department Committee on Graduate Students
Detection of Improvised Explosive Devices at Long-Range Using Coded Aperture Imaging of Backscattered X-Rays with Dynamic Reconstruction
by Jayna T. Bell
Submitted to the Department of Nuclear Science and Engineering in Partial Fulfillment of the Requirements for the Degree of
Master of Science in Nuclear Science and Engineering
ABSTRACT
Standoff detection of improvised explosive devices (IEDs) is a continuing problem for the U.S. military. Current X-ray detection systems cannot detect explosives at distances above a few meters and with a source-detector system moving in relation to the target. The aim of this study is to determine the feasibility of a large-area, Coded-Aperture Imaging (CAI) system using X-Ray backscatter as the source of radiation. A moving source-detector system required development of a new reconstruction technique, dynamic reconstruction (DR), which continually back-projects detected events on an event-by-event basis. This research imaged multiple low-Z (polyethylene and water-filled), area targets with
backscattered X-rays using standard medical imaging equipment, coded aperture masks with ideal bi-level autocorrelation properties, and dynamic reconstruction (DR). Lower fill factor apertures were the primary metric investigated because contrast was shown to be inversely related to the mask's percentage of open area. This study experimentally determined the optimal mask fill factor, gamma camera imaging protocols, and experimental geometry by examining the resulting effects on image quality. Reconstructed images were analyzed for Contrast-to-noise ratio (CNR), Signal-to-noise Ratio (SNR), resolution,
sharpness, the uniformity of the background (artifacts). In addition to changing the fill factor, additional methods of improving the contrast included changing the experimental geometry, reducing the X-ray tube filtration, and widening the X-ray source's cone beam (FOV). 14 studies were performed that found 25% fill factor mask reconstructions had the highest average CNR (14.7), compared to 50% and 12.5% fill factor (CNRs 8.50 and 6.9, respectively) with a system resolution of 25 mm at the target. Thus, this study's techniques confirmed that large-area, low fill factor coded apertures could successfully be used, in conjunction with dynamic reconstruction, to image complex, extended scenes at 5 meters with capabilities of up to 50 meters or more.
Thesis Supervisor: Richard C. Lanza
Title: Senior Research Scientist in Nuclear Science and Engineering Department of Nuclear Science and Engineering
TABLE OF CONTENTS
A BSTR A CT ... ... 2
TABLE OF CONTENTS... 3
LIST O F FIG URES ... ... 5
LIST O F TABLES ... ... 7
LIST OF ACRONYMS... 7
1. INTRODUCTION... 9
1.1 Project Background and Motivation ... 9
1.2. Theory ... ... ... ... ... 12
1.21. Coded A perture Im aging. ... ... 12
1.22. M etrics Affecting an Ideal Image ... ... 16
1.23. D ynam ic R econstruction ... 20
1.24. Compton Theory... ... 21
1.3 A pproach and O bjectives of the Project ... 24
2. APPARATUS AND PROCEDURES ... 25
2.1. A pparatus... 25
2.1.1 Gamma Camera ... 25
2.1.2 C oded A perture M asks. ... ... 26
2.1.3 X -ray Tube ... 27
2 .2 . P ro c e d u re s...2 8 2.2.3. PHASE I Preparation for Imaging...28
2.2.2 PHASE II Point Source Tests... ... 34
2.2.3 PHASE III Area Source Tests ... ... 35
2.2.4 PHASE IV X-ray Backscatter Tests...37
3. R E SU LT S ... ...43
3.1 PHASE I. Preparation for Imaging ... ... 43
3.2 PHASE II. Point Source Tests ...47
3.3. PHASE III Area Source Tests ... 49
3 .3 .1 50% fi ll factor m ask ... 49
3 .3 .2 2 5% fill factor m ask ... 50
3.3.3 12.5% fill factor m ask ... ... 51
3.4. PHASE IV. X-ray Backscatter Tests ... 54
3.4.1. 50% fill factor m ask. ... ... 54
3.4.2. 25% fill factor mask ... ... 60
3.4.3. 12.5% fill factor m ask. ... ... 67
4. D ISC U SSIO N ... ... 72
4 .1. P H A S E I. ... 72
4 .2 P H A SE II ... 74
4.3 PH A SE III A rea Source T ests ... 75
4 .3.1 50% fi ll factor m ask. ... ... 76
4 .3 .2 25% fill factor m ask ... 75
4.3.3 12.5% fill factor m ask. ... ... 77
4.4. PHASE IV. X-ray Backscatter Tests ... 79
4 .4 .1. 50% fill m ask ... 79
4.4.2. 25% fill factor m ask. ... ... 83
4.2.3. 12.5% fill factor mask. ... 86
4.5 Contrast-to-noise and Resolution... ... 89
C O N C LU SIO N ... ... 94
ACKNOW LEDGEM ENTS ... 100
APPENDICES ... ... 101
Appendix A. An Addendum to Coded Aperture Imaging Mathematics... 101
Appendix B. Coded Aperture Mask Design ... 105
Appendix C. Addendum to X-Ray Experiments ... 110
LIST OF FIGURES
Figure 1. Encoding of the signal.. ... ... ... 14
Figure 2. Magnification effects from mask hole diameter ... ... 20
Figure 3. Hexagonal uniformly redundant array mask drill patterns ... ... 27
Figure 4. Coded aperture camera ... . ... ... 27
Figure 5. Geometry of initial gamma camera experiments ... 29
Figure 6. 4-quadrant lead phantom ... 31
Figure 7. Targets used for X-ray backscatter experiments...33
Figure 8. Area source during acquisitions...33
Figure 9. Geometry for Area Source tests... . . ... 36
Figure 10. Experiment geometry for X-ray backscatter tests. ... ... 39
Figure 11. Verification of Anger camera resolution ... ... 44
Figure 12. Signal-to-noise versus frequency ... 45
Figure 13. Gamma camera Modulation Transfer Function ... ... 46
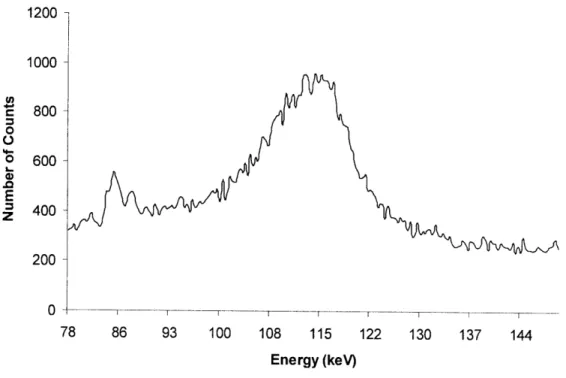
Figure 14. Backscatter Energy spectrum for 225 keV X-rays centered about 114 keV ... 47
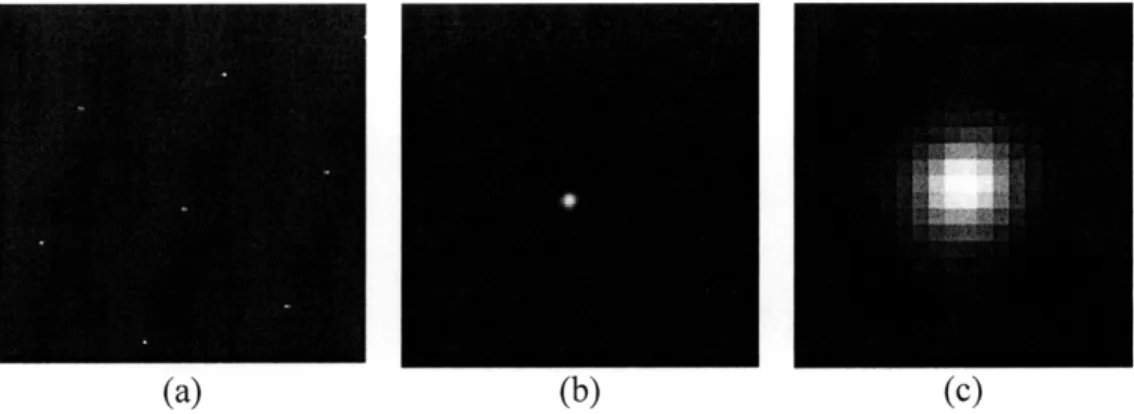
Figure 15. Reconstructed point source, 50% fill m ask.. ... ... 48
Figure 16. M agnified 50% fill factor mask shadow ... ... ... 49
Figure 17. Single-frame reconstruction of area source target imaged with the 50% fill mask. ... 49
Figure 18. Estimated lateral motion of the carriage (tug) ... ... 50
Figure 19. Reconstructed area source images, 25% fill mask... ... 51
Figure 20. Reconstructed area source images with artifacts, 25% fill mask ... 51
Figure 21. A rea Source target, 12.5% fill factor m ask ... ... 52
Figure 22. Gamma ray throughput as a function of mask-source distance ... 53
Figure 23. LOG of Count Rate versus LOG Distance ... ... 54
Figure 24. Determination of minimum total counts per image, water jug, 50% fill mask ... 55
Figure 25. Systematic error due to misalignment of mask-detector axis of symmetry ... 55
Figure 26. Water Jug Sequence reacquired with optical axis aligned., 50% fill mask ... 56
F igure 27. R ings, 50% fill m ask ... 57
Figure 28. Rings on Lead Bricks, 50% fill mask. ... 57
Figure 29. Reconstructed arrow after optimizing gamma camera imaging protocols, 50% fill masks...58
Figure 30. Water jug after changing experimental geometry, 50% fill mask. ... 58
Figure 31. Arrow with Mask-Anti-mask addition, 50% fill mask ... ... 59
Figure 32. Single frame reconstruction of the arrow, 25% fill mask ... .... 61
Figure 33. Reconstructed Water jug imaged on lead bricks and polyethylene, 25% fill mask ... 61
Figure 34. Rings with less X-ray tube filtration, 25% fill mask ... ... 62
Figure 35. Reconstructed arrow sequence after widening of cone beam ... 63
Figure 36. M ultiple Object scene, 25% fill factor mask. ... ... ... 64
Figure 37. Reconstructed arrow, high matrix detector output.... ... ... 65
Figure 38. Reconstructed arrow, lower matrix detector output... 66
Figure 39. System resolution calculation for 25% fill factor mask ... 67
Figure 40. Full Width at Half Maximum, point-source calibration, 12.5% fill factor mask ... 68
Figure 41. Reconstructed arrow, 12.5% mask. ... ... 68
Figure 42. Reconstructed multiple object scene, 12.5% fill mask ... 69
Figure 43. Smoothed multiple object scene, 12.5% fill mask... 70
Figure 44. Point Source Series showing presence of self-collimation effects. ... 71
Figure 45. Self-collimation effects increased background noise at closer distances.. ... 72
Figure B-1. Hexagonal Uniformly Redundant Array, 50% fill factor... 108
Figure C-2. Polyethylene rings sequence on poly sheets. ... . ... 111
Figure C-3. Arrow before and after a change in geometry, 50% fill mask ... 111
Figure C-4. Reconstructed arrow sequence with 50% fill mask ... ... 112
Figure C-5. Reconstructed arrow sequence with 50% fill antimask ... 112
Figure C-6. Calculation of mean intensity for Contrast-to-noise calculations ... 1... 14
Figure C-1. Calculation of mean background and standard deviation ... 114
Figure C-2. Reconstructed rings with 25% fill mask ... ... 115
Figure C-3. Arrow sequence, 25% fill mask... .. ... 115
LIST OF TABLES
Table 1. Gamma Camera Specifications ... . ... 26
Table 2. Mask Metrics for 50%, 25%, and 12.5% fill factor masks ... ... 26
Table 3. Acquisitions for the 12.5% fill factor mask. ... 37
Table 4. Summary of Experiments for X-ray Backscatter Experiments ... 38
Table 5. Determination of wavelength from four-quadrant bar phantom ... 43
Table 6. Contrast-to-noise ratio results for 25% fill factor reconstructions... ... 60
Table 7. Contrast-to-noise ratio results for 25% fill factor reconstructions ... 66
LIST OF ACRONYMS
CA: Coded Aperture
CAI: Coded aperture imaging
CNR: Contrast-to-noise ratio DR: Dynamic Reconstruction FOV: Field of View
FWHM: Full Width at Half Maximum
HURA: Hexagonal Uniformly Redundant Arrays
IED: Improvised Explosive Device
MTF: Modulation Transfer Function
MURA: Modified Uniformly Redundant Arrays PMT: Photomultiplier Tube
PSF: Point Spread Function SNR: Signal-to-noise Ratio
1. INTRODUCTION
1.1 Project Background and Motivation
1.11 Purpose of investigation. Detection of improvised explosive devices (IEDs) at a distance has
been and remains a pressing problem. One approach to this problem which has been proposed is to use backscattered X-rays to detect the low-Z materials of explosives. Backscatter has been previously used to detect contraband and explosives in vehicles and carried on individuals. The conventional approach, generally based on a variant of pencil-beam scanning, cannot be effectively used for two primary reasons. First, pencil-beam scanning rapidly degrades with distances of more than I or 2 m, so this approach is essentially useless for distances greater than 50 m which could provide the military with crucial standoff. Second, almost all of the work to date has assumed a fixed geometric relationship between the
interrogating source and the detector rather than the practical case where the source and the detector are moving relative to the target object lying at a distance in front of the system, as is typical of current
anti-IED, route reconnaissance missions.
Our approach addresses the aforementioned limitations of conventional X-ray imaging by illuminating the entire field of view with X-rays and imaging the backscatter using a coded aperture. Because the source-detector is in constant motion relative to the target, a new approach to coded aperture imaging with dynamic reconstruction was developed. Coded aperture imaging ameliorates the issue of having to image extended scenes. Large-area coded apertures are able to collect as much information as possible about the source while DR makes near real-time imaging possible by reconstructing on an event
by event basis while the imaging system is in motion.
This research attempts to image IEDs with backscattered X-rays using standard medical imaging equipment, coded aperture imaging (CAI), and dynamic reconstruction (DR). Though the process of CAI is not new in practice, reconstruction methods have principally been used in static situations, where the geometry is well defined and constant in time. In this application, we will determine how well low-Z materials can be imaged using coded aperture and DR when the photon source is lower energy,
backscattered radiation in the presence of background noise. Target distances for a proposed final system will be up to 50 m.
1.12 Background. At the current time (2009) IEDs cause the most casualties to military personnel in
both Operation Iraqi Freedom and Operation Enduring Freedom. A majority of IEDs are hastily
emplaced on the shoulder of frequented roads and are composed of low-atomic number explosives, such as C4, PE4, or TNT. Sizes range from military-grade munitions such as 155 mm artillery shells (605 mm in height and 155 mm in diameter) or blocks of civilian-grade explosives packed in a container with shrapnel or ball bearings. More information on IEDs can be found in [12], [17], and [18]. Though the material can be easily camouflaged to the naked eye, this material is visible when imaged with X-Rays. The blast radius of typical IEDs is about 35 to 50 m when the munition is a 155 mm shell. Accordingly, standoff detection systems are preferred. Assuming a military vehicle is moving at 30 mph, the driver has roughly 3.5 s to decide to stop if an IED is detected 100m away'. So, an imaging system must be in near-real time, have low failure rate, and provide image quality against inescapable background noise.
The main standoff IED detection system currently employed in the Joint Operating Environment is the Counter Remote Control Improvised Explosive Device (RCIED) Electronic Warfare (CREW) system which detonates remote-controlled IEDs prematurely by sending out initiation frequencies matching a wide variety of detonators. This system only works with RCIEDS and command-detonated
IEDs do comprise a sizeable portion of the IED threat. The CREW system cannot detect the actual explosives, so implementation of this system is hampered by enemy use of RCIEDs. The common denominator of all IEDs, however, is the use of explosives which can be detected by CAI of X-rays.
Current CAI systems, however, are limited by short interrogation ranges and the requirement to scan a target from the side with a fixed separation distance. The backscatter image is formed using a pencil beam to obtain spatial resolution. This is a highly inefficient use of source X-rays and generally is effective only over short distances. Additionally, images are subject to cumbersome artifacts due to near-field detector-target geometry. In kind, new techniques in both CAI and DR address these limitations.
1.13 Challenges. In this application, an X-Ray source illuminates the field of view with a cone beam
in order to maximize the amount of backscatter. Though CAI and DR make imaging with backscatter possible, they have challenges of their own. Additionally, the problem of spatially variant background noise is inescapable.
Because we are in a near-field geometry (compared to far-field applications in astronomy), care must be taken to avoid artifacts, with longer counting times to increase counting statistics. Increased signal implies using the largest hole-size possible, but the resolution of a coded aperture mask is
maximized by using the smallest possible hole-size. Because we are working with lower flux as the input to the CAI system, using masks with thousands of holes achieves high sensitivity combined with the
highest possible resolution. Signal throughput is increased, and a higher SNR ratio is the result provided the hole-size is kept small.
Newer techniques of DR do not use correlation and are fundamentally different from traditional coded aperture. In "fixed" CAI systems, the reconstruction technique uses correlation of the detector output pattern with the magnified mask pattern. This traditional static reconstruction technique does not work with a moving system because the CA allows radiation from multiple points on the target to reach a single point on the detector plane. So back-projection of that point on the detector would result in errors. On the contrary, dynamic reconstruction back-projects each event they accumulate provided there is known mask-source geometry.
Different fill-factor masks are tested to determine the relationship between the fraction of mask open area, reconstructed image resolution, and SNR. The drop in fill factor does not drastically reduce the received signal because the target is interrogated over a longer collection time while the detector system is moving. This collection time is proportional to the cross-track distance to the target's original mask-source separation distance, z. In traditional imaging, increasing z produces a drop off that varies as
1/z2. However, with DR the target is in the FOV longer (observed over a time proportional to z) and the accumulated signal on the detector used in only falls off as 1/z. This retention of sensitivity gives the DR
method the advantage when interrogating sources at a distance. A complete discussion on source-detector geometry and signal can be found in [21], [22].
Another distinct challenge is the removal of spatially-varying background noise. Even in head-on X-ray interrogation of an object with a detector on the opposite side there is background noise. Here, we are imaging from backscatter. An outgoing spectrum backscatters off a target, producing an incoming backscatter spectrum with a wider FWHM due to multiple Compton scattering events. Coded apertures are designed to collimate the desired X-rays (the ones traveling perpendicular to the mask plane) and the detector's energy windows can be set to filter out lower energy noise. However, with an outgoing and incoming beam air-scatter is a higher contributor of noise than in conventional X-ray imaging
applications. Additionally, this higher noise pedestal will have a higher standard deviation which produces a lower overall contrast-to-noise ratio (CNR).
1.2. Theory
1.21. Coded Aperture Imaging.
1.21.1. Introduction to CAI. CAI is traditionally used to image radiation that cannot be reflected or refracted, such as gammas and hard X-rays. Though single pinholes can be used, the typical tradeoff between signal and resolution for pinhole systems deter their usage. In ideal pinhole imaging there is a
1:1 correspondence between the object and image with perfect resolution.2
However, imaging times are long and there is little to no signal throughput. In 1961, Mertz and Young introduced the first CA for far-field imaging-which increased signal 10,000 times and allowed 3-D depth information gathering.3 CAs gain the resolution of a small pinhole but the increased SNR of a larger hole by having multiple small holes in a recognizable pattern called an array. CAI also allows imaging with higher energies and larger FOVs than focusing techniques. CAI has been mostly implemented in far-field geometry applications using long imaging times with point sources. Such applications produced nearly artifact-free images with
high SNR. However, when CAI is applied to near-field geometries the images are subject to artifacts and increased noise.
A CAI system consists of three components: a coded aperture mask, a position and energy-sensitive detector, and a back-projection algorithm. The first two components, when coupled, are collectively referred to as a coded aperture camera. Coded aperture masks have transparent and opaque areas (mask elements) sized according to the detector's spatial resolution limitations. Transparent and opaque mask elements will have values in the array of zero and one, respectively. The mask elements are spaced equidistant in a pre-determined basic pattern called an array. Arrays are 2-D compilations of repeating I-D binary sequences assigned to a grid. The basic pattern repeats itself with overlapping edges. CA basic patterns are further discussed in Appendix B. The detector used in this investigation is an Anger Camera, further discussed in Section 2.1.1.
Imaging a source with the coded aperture camera encodes the data by convolving the original image with the mask pattern. Specifically, each point in the source (source in this case refers to backscattered radiation from the target) casts an enlarged, shifted shadow of the mask on detector as shown in Figure 54. The size and location of the mask shadow depends on the mask-source distance and the source's lateral translation with respect to the mask's origin. Illumination will travel through transparent mask elements and be recorded on the detector. Opaque mask elements will correspond to
shadowed areas. Because an area source is a collection of N point sources, the detector accumulates a sum of N magnified, shifted mask shadows. As a result, spatial information about the source is first encoded for subsequent decoding by the back-projection algorithm.
1 00001100100011101010001 11001001111001
Figure 5. Encoding of the signal. Radiation from a single point casts an enlarged, shifted mask shadow
on the detector. Radiation pas ;ing through transparent mask elements will be accumulated on the detector
for later decoding by back-projection. Image is from [9].
The decoding process involves correlating the detector output with the same mask pattern which also
serves as a decoding array. Assuming known mask-source separation distance, each event on the detector
is geometrically "back-projected" by connecting rays from the x, y position on the detector to locations in
the target area. This target area is setup as an accumulator array which is incremented for each event
back-projected through a transparent mask element.
Ideal masks possess the bi-level impulse auto-correlation, where the mask serves as its own
decoding array. If the mask and decoding array are correlated such that the result is a delta function
(shown in the next section), the system output is the best possible estimate of the original object. CAI
fundamentals are reviewed in [2,[3],[],[7],[8].
1.21.2 Mathematics of CAI.
Encoding. Encoding spatial and depth information about a target involves convolving the
original object image with the CA mask. Let x denote convolution and
*
denote correlation. The
object's projection through the mask on the detector surface creates a distribution
P(x, y) = [Oz (x, y) x Mz (x, y)], (1)
where P(x, y) is the photon distribution on the detector, Oz (x, y) is the object distribution, and
M, (x, y) is the mask pattern. The mask pattern will be magnified according to the imaging geometry by an amount :
m (z
+
f)
(2)
z
where z is the source-mask separation distance, and f is the mask-detector separation distance. Mz (x, y) has values of 0 (opaque areas) and 1 (transparent areas). For each incoming photon, the projected mask pattern will be shifted relative to how much the photon's back azimuth has laterally translated away from the axis of symmetry. The detector accumulates P(x, y), whereby every shift encodes the position of the incoming photon and the strength encodes the intensity of the source.'
Decoding. To regain the image 0, P(x, y) must be correlated with a decoding array A(x, y), also magnified according to the geometry of the experimental setup where
O(x, y) = P(x, y) * A(x, y). (3)
Assuming a linear detector response and a planar source distribution we have a linear shift-invariant system where
O -- M -- A -- ) . (4)
In this application, the mask M is also used as the decoding array because masks with ideal bi-level autocorrelation properties are implemented. A mask with this property must auto-correlate where
M *M = 8,
(5)
where t is an impulse at the origin. The mask, M is related to the underlying ideal mask by
(1 + Mpattern )
M = (6)
2
where Mpaern has values of +1 and -1 and also retains ideal impulse correlation where auto-correlating results in S times the number of mask elements N (holes and no holes). Because correlations are commutative an ideal replica
0
is obtained from the original image O in the following manner, whereOxM*M =0.
(7)
The end result is the same when the object is correlated with the mask, convolved with itself. The convolution process and an extension of this imaging process where the mask is in an anti-mask (rotated60 degrees) configuration are described in Appendix A.
The correlated mask and decoding array, or point spread function (PSF), defines a CA system's imaging capability because it is the system's response to a point source.6 The resultant image will have some smearing because no imaging system is truly ideal. If the system input and PSF are known, the system output can be predicted. A complete discussion on the mathematics of CAI and DFTs can be found in [3], [7], [10].
1.22. Metrics Affecting an Ideal Image. Obtaining the best image quality drives the design of both
the mask and the reconstruction algorithm. Additionally, the limitations of the detector must be
considered. A complete discussion on mask design is in Appendix B. Ideal images have: high contrast, high resolution, and retain geometric accuracy with respect to the original image. This section defines these three measures of image quality, lists how they are optimized, and lists the applicable equations used in this research.
1.22.1. Contrast-to-noise ratio. The CNR is the primary way to quantify image quality and varies according to the amount of signal throughput and both the height and uniformity of the background pedestal. CNR is defined as difference of the peak signal response to a source and the background pedestal divided by the standard deviation of the background. CNR is generally high for point sources and lower for area sources or extended scenes. An empirical derivation for the decrease in contrast for area versus point sources is in Appendix A. Though the decoding process manipulates the signal, it is important to note the CNR is unaffected by these manipulations.
A similar measure of image quality is the signal-to-noise ratio, or the peak signal divided by the background pedestal. It has been shown that both the CNR and SNR give similar measures of image
quality and can be used interchangeably.7 In this experiment, both the CNR and SNR are evaluated because quantitative measures of both the contrast and the uniformity of the background pedestal were desired.
The amount of signal throughput, which affects CNR, is determined by the mask's fill factor. The fill factor is the ratio of open area to total area, also equal to the fraction of holes lit up when the detector is viewed from a position other than the actual source position.8 High fill factor masks produce better CNR ratios for point sources in the absence of excessive noise. On the contrary, lower fill factor masks produce the best CNR for non-point source targets and extended sources despite the loss in signal throughput.9
CNR is improved by reducing the fill factor because the signal is directly proportional, but the noise pedestal is proportional to the square of the fill factor. The contrast (peak - pedestal / pedestal) is given by
S1
, (8)where ff is the fill factor for N sources of equal strength. The CNR can also be empirically predicted from using the fill factor alone, equal to:
(1- f )
A
(9)Thus, reducing the fill-factor increases the contrast. For example, reducing ff from 50% to 25% increases contrast by a factor of three'0.
1.22.2 Resolution. Resolution is another metric used to analyze image quality that is chiefly dependent on hole size but also varies with mask thickness and the system's PSF. Resolution is defined as the minimum distance between two points on the object's surface where their image is resolved separately on the resultant image." Smaller mask holes improve resolution for an imaging system but decrease the available signal. The amount of signal also decreases as you move away from the
mask-detector axis of symmetry. The surface area experiencing gamma ray throughput in this situation is given by:
A
(= Xr2
t? )
(10)
AT 7r he (f + z)
where AP is the surface area receiving gamma throughput, AT is the full area of the hole, t is the mask thickness, rh e, is the hole radius, rd the distance from the center of the detector. Equation 10 assumes the source is an on-axis source and is a good approximation. In light of this tradeoff between CNR and resolution, choosing a large number of small holes is the first step in improving resolution at no cost to signal.
Another limit on resolution is mask thickness. 2
An ideal mask would have zero attenuation and be infinitesimally thin. However, real masks are made from high density metals with near perfect attenuation properties. For fabrication and cost considerations, masks are made from the highest density materials possible, but must be reinforced with stronger metals with lower attenuation coefficients to avoid warping. Thicker masks produce holes with collimation effects known as "thickness artifacts." The system PSF (and similarly Modulation Transfer Function) limits the achievable resolution because it determines how much smear is produced for a point (and similarly which frequency responses are imaged with good sharpness) in an imaging system. In the mask design process, using target array pixels smaller than the PSF only results in empty magnification."
The FT of the system PSF yields the system's Modulation Transfer Function (MTF). The system MTF describes an imaging system's spatial frequency measured in cycles (pairs of lines) per millimeter. The system's MTF (and PSF) are composed of three individual MTFs (PSFs) from the gamma camera, the mask, and target pattern. Hence, the individual MTFs must be known to determine the system MTF. Because the MTF of ideal masks and point sources are both flat, the MTF of the gamma camera is the main contributor to the overall system MTF. Determining at what cycles per mm the system MTF drops off in sensitivity (by 50%) optimizes the imaging system's capability to reproduce a sharp image with the
highest possible resolution.
1.22.3. Geometric Accuracy and magnification. An image with ideal geometric accuracy has appropriate dimensions according to the pixel size and the magnification factor of the image.
Furthermore, rigid lines in the object will not appear wavy in the image, nor is there any localized distortion.
The mask's hole diameter determines the magnification effects from source-mask geometry. If two points on an area source are separated a distance d, a distance z from the mask, they will project an
image of height D' through a hole of diameter D, as illustrated in Figure 6.
From geometrical relationships, the detector will display an image of height D' according to:
DO' =1+ f (11)
D z
Similarly, the best image possible is obtained when a source of height 8 is emplaced at a mask-source distance z, a mask-detector distance of f, using a detector with D' resolution (mm) according to the equality,
S D'
- -,
(12)
z
f
which optimizes the imaging geometry based on the FWHM of the gamma camera. Finally, the whole area being imaged must be projected onto the detector in such a way that it fits entirely inside the detector face plate. The target size, magnified by m (Equation 2), should be less than 0.42 m x 0.536 m for the Anger Camera.
detector
T
T
t---~-~-D
---
D
I--- z II f I
Figure 6. Magnification effects from mask hole diameter. An area source, with height 5 will project an image of height D' through a mask with hole diameter D.
1.23. Dynamic Reconstruction. Dynamic Reconstruction generates image sequences from data
obtained from moving radiation detection systems. Traditional reconstruction algorithms fail with moving systems because the back-projection is along a single axis and does not allow for relative motion between the imaging system and the target. Here, the process forms images computationally and can recover depth information with sensitivity that drops off with the inverse of distance versus the inverse of distance squared from solid angle calculations.14 For a complete discussion on DR, see [9].
DR has increased sensitivity and CNR because it affords longer imaging time of the target. Usually, radiation from a source decreases as i/d2 because the solid angle visible by a detector element decreases with increasing radius. But, the sensitivity does not fall off with l/d2 because the source is imaged over a time proportional to the distance between camera and target and thus, will fall off over I/d. Given a CAI system and known geometry, each point in the target illuminates the same total detector area through the mask and is then back-projected with an algorithm. Target areas called "accumulator cells" are created in the scene and are incremented or decremented based on input from the algorithm.
Back-projection algorithm. Every photon detected is deemed an "event" by the algorithm and is back-projected through each hole in the mask. The algorithm creates target areas called accumulator
cells located in a 2-D plane at a distance given by the known mask-to-target geometry. It creates vectors which connect all events on the detector surface back to the 2-D target plane. Each accumulator cell receives the same total contributions from the detector elements.
Weighting accumulator cells. Weights are given to the accumulator cells where cells closer to the event are weighted higher than cells further away. In positions away from the source, there will be some contributions to pixels in the back-projection algorithm. However, this "off-target" contribution is
lower through multiplication by the mask fill factor. Target cells visible through the mask receive a positive "vote" (one minus the fill factor) and cells not visible receive a negative vote (the fill factor). 5 This weighting scheme cancels the background pedestal because target cells not associated with a source will get equal numbers of positive and negative votes that cancel each other out. The selection of
weighting scheme relies on the desired system PSF, noise, and artifact suppression.'6 Error in the gamma camera- the detector readout did not give exact x, y location of events, but was off by 1 to 3 mm. As a result, this system limitation always introduced slight blurring to the reconstructed images.
1.24. Compton Theory. Arthur Compton redefined a more modern view of the photon as a particle
of electromagnetic radiation following his precise experiments measuring scattered X-rays' wavelengths. Qualitatively, physicists understood that X ray penetration decreased following a scattering event. Quantitatively, Compton's high-resolution X-ray spectrometry experiments showed that the incident and scattered X-rays occurred at two distinct spectral lines. Though Bragg reflection could explain the coherently scattered X-rays, Compton's theory proved that incoherent scattered occurred, which produced
a shift in wavelength proportional to the scattering angle. X-rays, being electromagnetic radiation of very short wavelength, interact with electrons like particles of zero rest mass. Their energy E = hv = hc/A and momentum p are related by the relativistic equation for particles of zero rest mass, namely p = E /c. Using relativistic mechanics and conservation equations for both energy and momentum, the interaction of an
X-ray quantum and a free electron could be modeled like an elastic collision. Thus, the formula for the "Compton shift" in the wavelength of incoherently scattered X-rays, is
A --h (1- cos 0), (13)
mc
where h is Planck's constant, m is the mass of the electron, and 0 is the angle between the trajectories of the incident and scattered photon.
Gamma rays are electromagnetic radiations produced by nuclear interactions. The attenuation of a beam of incident radiation through an absorber material of thickness x is expressed as an exponential
relationship:
I(x) = Io
e -(14)
where is the linear attenuation coefficient, which depends only on the energy of the incident radiation.t is the probability per unit path length of an interaction by Compton, photoelectric effect, coherent
scatter, or pair production. Each process has a dependence on the atomic number of the absorber and energy of the incident radiation. Compton scattering is defined as the inelastic, relativistic scattering of a photon by a free electron, treated relativistically. For Compton scattering to occur, it is assumed that a photon has energy comparable or greater than the rest mass of an electron.
The energy of a photon after a scattering event is determined by the Compton equation: E
E' = (15)
1+ a(1 - cosO)'
where Eo is the incident energy, E' is the final energy, a is the fundamental constant, and 0 is the scattering angle. The parameter a is a measure of the photon energy in units of the electron rest mass energy (511 keV) and is equal to
h co
S , (16)
where hco is the photon energy (keV), and me is the classical radius of the electron.
Lower energy photons are scattered with only a small change in energy, whereas high energy photons (>10 MeV) lose nearly all their incident energy. The minimum energy for the scattered gamma occurs at
180 degrees; it should also be noted that even in the limit of infinite incident energy gammas, the backscattered gamma can never be more than mc 2
/2 (255 keV) and never more than m c2 (511 keV) for a 90 degree scatter. Our radiation of interest (225 keV X-rays), after backscattering at an angle of
1800, produce final energy is 113 keV from Equation 13. Similarly, for the highest energy outgoing X-rays, the return energy will be a constant at 255 keV.
Klein-Nishina. The probability for Compton scattering at a given angle or energy can be determined by the Klein-Nishina formula. The differential cross section of photons scattered per electron is given by Equation 17:
du=
1a 2 2 2P(EO )2EP(EO,9)+P(EO)-r -lcos2(0)]
(17)d 2,
where r, ( is the Compton radius of the electron, and P(E,,O) is the ratio of photon energy before
and after collision. For an incident photon of energy Ey, the following relationship holds:
P(E,,O) E 1 (18)
1 + 2 -(1- cos 0)
mec
Thus, photons with lower incident energies have higher Compton scattering cross sections. A similar phenomenon relates the energy of scattered radiation to the angle of incidence. Near vertical angles of
incidence enable X-rays to attenuate deeper through objects before higher probabilities of scatter occur. In the opposite manner, X-rays with a high grazing incidence angle have a higher incidence of
backscatter.'7 When the incident X-rays hit a target plane at an angle, many of the scattered rays are not absorbed and can be deflected as useable backscatter.
Photons within the sodium iodide (Nal) crystal. The Nal detector detects incident photons by the photoelectric effect. Incident photons with energy E undergo a quantum mechanical transition. The photons' final state consists of an excited ion with a vacancy in one of its inner shells where the electron was formerly bound and a free "photoelectron" with kinetic energy E - W, where W is the binding energy of the electron in the neutral atom. The photoelectron undergoes multiple coulomb interactions with electrons and nuclei in the sodium iodide crystal and loses all of its energy within a fraction of a jtsec. A small percentage of the lost energy is converted into scintillation light. At the same time, the ion from which the photoelectron emerged loses its energy of excitation through a series of transitions that fill the vacancy in its electronic structure. This process results in lower energy photons or electrons that lose their energy in the crystal and generate additional scintillation light in a cycle.
The total amount of scintillation light in the crystal is closely proportional to the total amount of energy dissipated in the aforementioned processes. As a consequence the pulse height spectrum of a Nal scintillation counter exposed to mono-energetic gamma rays shows a distinct "photoelectric" peak whereby accurate calibration in terms of pulse height versus energy deposited is possible. The counters can then be used to measure the energies of scattered photons and recoil electrons.
1.3 Approach and Objectives of the Project. This research used a four phased method of
approach.
* Camera imaging protocols are optimized, a moving mono-energetic source proves that CAI with DR works in the simplest case
* A moving area source allows testing of non-point targets
* X-ray source tests SNR and how well we can image backscatter in the presence of background * SNR and resolution are optimized leading to final system design
The ultimate objective of this research is to prove that DR can successfully reconstruct extended
scenes with wide-area targets where there is relative motion between CAI system and target. Secondary to that main objective, the effects on image quality will be observed when the following parameters are altered:
* mask fill-factor (50%, 25%, 12.5%)
* the outgoing and incoming (backscatter) energy spectrum * reducing air scatter
After analyzing the image quality of the reconstructions, the optimal fill-factor mask and imaging parameters will be selected. The goal is to optimize resolution and CNR (and SNR) of the resultant images. A CNR above 15.0 (and SNR above 3.0) are desired for the optimized images.
2. APPARATUS AND PROCEDURES
2.1. Apparatus. This chapter introduces the apparatus common to all experiments. The gamma
camera, coded aperture masks, and X-ray tube. The gamma camera with mask affixed is the coded aperture imaging system.
2.1.1 Gamma Camera. The ISOCAM II gamma camera"8 has two detector heads, a gantry, a
SMARTSCOPE hand control, and an ISOSTATION user entry module. The gamma, or Anger, camera has a 419 mm x 536 mm field of view (FOV) and 2.7 mm spatial resolution (FWHM). The detectors are made of 12.7 mm thick sodium iodide crystal with thallium doping (Na-I (TI)). The crystals are optically coupled to an array of 86 photomultiplier tubes (PMTs), collectively known as "heads." Two detector heads are mounted on a rotating drum on the camera gantry. The ISOSTATION controls gantry and camera operation, acquisitions, and storage of acquired images. System specifications for the detector heads are shown in
Table 1.
Table 1. Gamma Camera Specifications.'19 Energy resolution and uniformity values were measured at 140 keV with a count rate of less than 20,000 cps.
Parameter Specification Value
Useful Field of View 3/8" Crystal 419 mm x 536 mm
Intrinsic Spatial Resolution FWHM 2.7 mm
FWTM 5.1 mm
Intrinsic Energy Resolution 9.5%
Intrinsic Flood Field Uniformity Integral ±2.0%
Differential ±1.5%
Multiple Window Spatial Maximum error within the 84keV <0.2 mm Registration Error to 330 keV Energy Window
Intrinsic Count Rate Performance 20% Window Maximum 230 kcps
(per detector) 20% window 150 kcps
Photomultiplier tubes directly behind the crystals detect each photon with x, y location
information and the ISOSTATION sums the total counts. The ISOSTATION displays a 2-D image of the relative spatial count density with positional readout quantized to multiples of 0.672 mm.
2.1.2 Coded Aperture Masks. Three coded aperture masks were designed with open areas of 50%,
25%, and 12.5% with associated metrics as shown in
Table 2. The mask design process is covered in Appendix B. Design parameters such as hole size and
spacing were experimentally determined as shown in Section 3.1.
Table 2. Mask Metrics for 50%, 25%, and 12.5% fill factor masks used in backscatter experiments. Mask Fill Hole Diameter Hole Spacing Residue p-value Total
Factor (mm) (mm) Holes
50% 3.1 3.5 quadratic 5419 10711
25% 3.5 3.9 bi-quadratic 4357 4357
12.5% 1.45 1.625 octic 26041 13021
All three masks shared the basic properties of a HURA with a central basic pattern surrounded by six halves of the same pattern as shown in Figure 7. Tilting the patterns 15' enabled the maximum p-value for each respective fill-factor. The masks were fabricated from 3.2 mm thick, 600 mm x 600 mm
lead alloy sheets chosen for its less than
1%
transmission rate for incoming 115 keV X-rays.
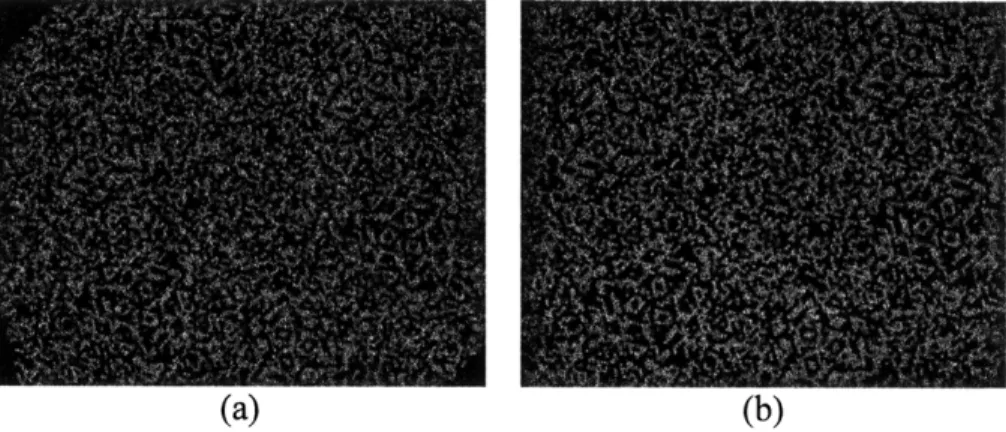
Figure 7. Hexagonal uniformly redundant array mask drill patterns for the a) 50% fill factor mask b) 25%
fill factor mask, and c) 12.5% fill factor mask based on quadratic, bi-quadratic and octic residues. Tilting
the patterns by 15' allowed the maximum number of holes per mask.
The masks were mounted parallel to the detector and object plane as shown in Figure 8. A
trapezoidal lead box shielded the detector from background noise. As shown in Figure 8, the gamma
camera with affixed mask constitutes the coded aperture imaging system described in all experiments.
Figure 8. Coded aperture camera with hexagonal mask affixed to the gamma camera's detector head
using a trapezoidal lead shield.
2.1.3
X-ray Tube. A
225
kV,
13.5 mA X-ray tube was provided by American Science & Engineering,
Billerica, MA. The pallet-mounted system consisted of the X-ray tube, a 220/240 V 60 A high voltage
':~~ : ""
I
.
.::: (;., !j:::::( )1 f ::~ 1~ ~ -~ I' i ; :- :i ; : .- . ~f~~:is li.l: 1" -sil "~~I -;:~J~ ~c~ Y:i~._.power supply (HVPS), a 230 V, 3.5 A chiller, and a 220 V, 0.5 A, controller. In order not to saturate the Anger camera (-250 kcps with no mask and -500 kcps with mask) the X-ray tube's output was reduced with lead filters with varying thicknesses ranging from 1/16 in to 3/16 in. Before daily operation, a 17.5-min warm up sequence was run in order to stabilize the system for operation. When the tube was not used for greater than 7 days a 75 min warm-up was run.
2.2 Procedures. This chapter reviews conduct of the 4 phases of this research: preparation for
imaging, proof-of-principle with a point source, proof of principle imaging an area source, and X-ray backscatter tests. The preparation phase included lab preparation and equipment calibration. Phase II used existing coded aperture masks to prove dynamic reconstruction (DR) would work with the simplest case of imaging a mono-energetic point source in a near field experiment. This phase also included tests to finalize the mask design. Phase III tested a mono-energetic area source to shape test non-point like objects in the absence of problems that would later be introduced by backscatter in Phase IV. Phase IV attempted to optimize the DR of an image produced by backscattered radiation by examining mask open area, effects of changing target parameters, and other spectral considerations.
2.2.3 PHASE I. Lab preparation consisted of cleaning and radiation protection hardening of the site.
Equipment preparation included gamma camera calibration, verification of camera imaging capabilities, selection of optimal imaging protocols, target fabrication, and confirmation of the X-ray backscatter spectrum.
2.2.3.1. Lab Preparation. The lab room was first prepared by removing unused equipment and given a thorough cleaning to remove particulates that could later interfere with backscatter. The
Figure 9. Geometry of initial gamma camera experiments. The X-ray tube (A) was positioned with the
cone beam illuminating a target (B) at the far wall. Backscattered X-rays were directed through the coded
aperture into the gamma camera's detector (C).
The coded aperture mask was mounted on a trapezoidal lead shield affixed to the gamma
camera's detector head. The X-ray tube was positioned with a 750 mm diameter cone beam illuminating
the target, approximately 5 m away at the wall. Targets were mounted on a remote-controlled carriage (or
tug) that moved the target from 5 m to 2 m from the detector surface during data acquisitions. The planes
of the detector head, mask, and target were checked to ensure they were parallel and level + 20 with
respect to both the horizontal and vertical. The camera's output data were collected at the ISOSTATION
for batching and subsequent input to the dynamic reconstruction algorithm.
A 195 mm thick, concrete radiation shielding wall was erected behind the target. This thickness
was determined from attenuation calculations to reduce the potential dose to the public to less than two
mrem/hr as required by RPO. The dose rate was never greater than two mrem per hour outside or inside
the vault except directly in the cone beam. Outside of the vault, the maximum dose rate was about one
mrem per hour behind the back wall in the path of the beam. To reduce backscatter from the concrete, a
2.5 mm thick plate of steel was placed against the concrete facing the target. A lead collimator was
fabricated to produce a cone beam that concentrated the X-rays on the target and reduced the dose to the
operator during operation. Additionally, a 150 A breaker was installed in the room to support the X-ray tube's power requirements.
2.2.1.2. Equipment Preparation.
Gamma Camera System Calibration and Quality Control Testing. To ensure the system was functioning properly and at the desired energy ranges, the manufacturer recommended calibrating the system. First, the PMTs in both heads were each calibrated with a 3.5 mCi Tc-99m source. Then, an internal energy correction was performed. Finally, uniformity corrections were run on both heads using 500 tCi of Tc-99m placed 3000 mm away. The system was calibrated for running at count rates between
10,000 to 30,000 cps. To confirm the system was calibrated properly, the aforementioned Tc-99m source was imaged. The camera's peak energy spectrum was confirmed at 140 keV by observing the displayed "quality assurance (QA) peak" at 140 keV with energy windows were set at 20%. QA flood field images were run to check for subtle non-uniformities and to ensure that the uniformity corrections removed them. Geometric accuracy and resolution were checked by imaging a four-quadrant bar pattern with known
separation distances, discussed in the next section.20 Finally, the ISOCAM workstations were replaced with SUNTM CPUs with increased memory because the gamma camera was being used in a manner for
which it was not originally designed. The camera would be used to take hundreds of data-intensive static images in a sequence.
Verification of Camera Resolution and MTF. The gamma camera's intrinsic spatial resolution was verified by imaging a mono-energetic source through a standard 4-quadrant bar phantom with 2.0, 2.5, 3.0, and 3.5 mm wide lead bars as shown in Figure 10. This experiment also tested for response uniformity and geometric accuracy. First, a background measurement was first taken for subtraction. The phantom was placed directly on the detector while imaging a 10 ml vial filled with 3.5 mCi of Tc99m. Gamma camera output header (.hdr) files from the test images quoted 0.672 mm per pixel. These trials experimentally confirmed this effective pixel size in mm. Three trials were conducted at matrix
information saved in a separate header file.
Figure 10. 4-Quadrant lead phantom used to verify gamma camera spatial resolution and linearity. The
quadrants have 2.0, 2.5, 3.0, and 3.5 mm wide lead bars.
Determining the gamma camera's MTF was vitally important for two reasons. First, knowing the
camera MTF is required to accurately restore the original image in the deconvolution process. Second,
the gamma camera's MTF needed to be analyzed to support the mask design's hole separation distance.
The MTF would be examined to see how the response dropped off with increasing frequency. From the
results of the grating experiments, a target hole separation distance of 3.5 mm was examined first.
The MTF was obtained by imaging a preexisting, coded aperture mask and taking the FT of the
magnified mask shadow. The mask was a 62 x 62 array, Modified Uniformly Redundant Array (MURA)
with square holes spaced 2.2 mm apart. The mask was mounted on a lead-shield with 356 mm
mask-detector separation distance. A magnification of 1.58 was required for the mask shadow to have 3.5 mm
hole spacing. Accordingly, Equation 2 required positioning of the source 610 mm from the mask surface.
The source was a full 10 mL vial of 3.5 mCi Tc99m, collimated in a lead cylinder with a small aperture.
The cylinder was placed on its side with the aperture directed toward the center of the mask. One 5
million-count acquisition was taken and the gamma camera output was given in 1024 x 1024 matrix size.
The MTF of the detector output pattern served as a close approximation to the MTF of the gamma
camera. The MTF was then analyzed for frequency response and rotational symmetry.
Determination of Imaging and Reconstruction Sequence. Each of the camera's preset internal imaging protocols was run to determine which imaging sequence best supported the metrics desired for the backscatter experiments. Three prefabricated masks and multiple point sources were used to perfect the imaging sequence and achieve the highest resultant image quality. The Anger camera's "Hepatobiliary" study type and "isotope" study mode were selected because multiple static acquisitions were possible with the detector heads in any user-defined position. The uniformity correction mode, "Single Isotope", was selected because it produced the clearest images. Tests were also run to determine which resolution to use for future imaging. Test images were taken at 256 x 256, 512 x 512 and 1024 x
1024 to qualitatively investigate what resolution was suitable. The optimal images had 1024 x 1024 matrix size and at least one million total counts.
The reconstruction sequence consisted of file saving, post-processing, decoding by an appropriate algorithm and analysis. All files were saved as Interfile 3.3 and burned to CD for transfer to a laptop computer. The interfile formats were converted to bmp images by an executable file. The bitmap images were inputs into the reconstruction algorithm, which output the reconstructed images of the original target. Those images were analyzed both in a stand alone format and as part of a gif sequence simulating relative motion. A final, fielded system of this type would have faster one-step processing. However, due to equipment and processor constraints post-processing was necessary. Of utmost importance was the successful demonstration of the DR technique.
Target Selection and fabrication. Targets for the backscattered X-ray experiment consisted of polyethylene and water because both materials have low X-ray attenuation coefficients. Backscatter count rates from successive additions of 250 mm-thick polyethylene sheets were measured to determine optimal target thickness. X-ray backscatter targets are shown in Figure 11. A 76 mm-thick polyethylene arrow (height 584 mm, arrowhead width 355 mm) and annulus (outer diameter 350 mm, inner diameter 80 mm) were fabricated in order to test resolution, depth perception, and sharpness along defined edges. A 5-gallon water jug (diameter 305 mm, height 560 mm) was added to explore backscatter from
cylindrical objects.
(a)
(b)
(c)
(d)
Figure 11. Targets used for X-ray backscatter experiments. Polyethylene was used to fabricate an a) arrow, b) an annulus, and a c) multiple object scene. Because of water's similar attenuation properties water-filled 5-gallon water bottle, shown in d) was also used.
Additionally, polyethylene resin beads and water were used to fill smaller objects such as a glove, a cylinder, and bottle for a multiple-object scene. For the area source tests, 6 mm-thick lead shapes partially occluded the surface of a 5 mCi, 610 mm x 419 mm active-area Co-57 area source as shown in Figure 12.
32.5 cm
32.5 cm
(b)
Figure 12. Lead shields used to partially occlude the area source during acquisitions. The same
hexagonal cutout shown was used in a) the 50% and 25% fill mask tests. The 12.5% mask tests added a smaller lead cutout in b) to aid in resolution testing.
Confirmation of X-ray Backscatter Spectrum. The energy spectrum of backscattered radiation was simulated and confirmed using an HPGe detector. First, the outgoing beam was simulated with the Monte Carlo radiation transport code Geant 4 9.021. Next, the spectrum was experimentally verified using a Canberra 3 in crystal intrinsic Germanium detector with MAESTRO software. The X-ray source was run at 225keV and 0.3 mA. The outgoing beam backscattered from 100 mm of polyethylene placed 5 m away. The HPGe detector crystal was placed directly in front of the mask.
2.2.2 PHASE II. Phase II consisted of proof of principle using a point source. Additional objectives
included: examine setup geometry, test the reconstruction algorithm's performance, test the FOV and system PSF, examine artifacting, and attempt to identify and remove any systematic errors. Phase II was complete when the CAI system, with 50% fill mask, had been optimized with a point source.
Preparation. The gamma camera was prepared for imaging by initializing the uniformity
corrections for 345 mCi of Tc99m. The imaging mode was set to dynamic, obtaining 106 total counts per image. A 10-ml vial of Tc-99m, collimated in lead cylinder (160 mm tall and 75 mm diameter with 5 mm-diameter aperture) was placed along a 3000 mm track running perpendicular to the mask at its centerline. A temporary mask holder, fabricated from lead and concrete, was used to shield background radiation. The mask-detector distance, f, was 450 mm for the duration of Phase II testing. The mask magnification and source activity was used to determine the optimal ranges of z to keep the count rate below 50,000 cps to not overwhelm the detector. A far sequence, with z-values between 2000 and 3000 mm, was examined. To test the effects of magnification on resultant images, a near sequence with z-values between 1000 and 2000 mm was also imaged.
Testing. 9 acquisitions were taken in dynamic mode at 1024 x 1024 matrix size. The far sequence (acquisitions 1 through 5) had z-values of 2000, 2250, 2500, 2750, and 3000 mm. Z-values were measured along the floor with a tape measure. The near sequence (acquisitions 6 through 9) had z-values of 1750, 1500, 1250, and 1000 mm. The average count rate for each set was 7800 cps.
Acquisitions lasted between 40 to 100 seconds per frame depending on z. Images were saved and reconstructed according to the method described in Section 2.1.
Analysis. The reconstructed image represented the system PSF. The image's SNR was also evaluated. Numerical tests were run to check mask-source alignment and sensitivity to errors in rotation or distance. Last, the reconstructed images were compiled as gif animations to examine drift.
2.2.3 PHASE III. Mono-energetic Area Source Tests
2.2.3.1 Objectives. The CAI system imaged a partially occluded mono-energetic area source to test non-point like imaging in the presence of background but not backscatter. Proving that imaging area sources was possible was necessary to demonstrate that this technique could image complex scenes prior to adding the problem of backscatter. The approach consisted of imaging the target, shown in Figure 12a, placed on the tug and imaged sequentially with varying z-values. The target was tested with each mask for proof of principle with a mono-energetic source in the absence of backscatter. Next, the target was imaged with the 25% fill mask to investigate system sensitivity to angle of incidence. Energy windowing was also investigated as a method to remove air scatter in support of future X-ray backscatter tests. Accordingly, image quality was further optimized during this phase of testing in preparation for X-ray tests. The experiment geometry is shown in Figure 13.
detector
((38cm
4.2cm)
(198.8cm)
laser mask Steel wall
0.7cm thick
Figure 13. Geometry for Area Source tests. The variables were the mask fill-factor, the energy windows, the shape of the lead cutouts, and the mask-source distance, z (mm). The mask-detector distance, f, remained fixed.
2.2.3.2 Experiments.
50% fill factor mask. 15 acquisitions of the 3.76 mCi area source target, see Figure 12a, were imaged. By default, the Anger camera's energy windows are ± 10% of the peak energy as per
manufacturer's recommendations. This default camera setting will be referred to as 20% open energy windows in all future references. The first nine acquisitions had z-values of 4211 mm through 4991 mm with 60 mm separation distance. Energy windows were set at the default 20% of peak energy window centered on 122 keV (110-134 keV). The next 6 acquisitions had z-values of 5055 mm through 5370 mm with 6% energy windows (116-128 keV). Count rates remained between 20,000 and 30,000 cps during the course of acquisitions.
25% fill factor mask. 10 acquisitions of the 3.4mCi area source target, Figure 12.a, were imaged. The first 5 acquisitions had 20% energy windows. Z-values ranged from 4750 through 4995 mm in 60 mm increments. The target was also re-imaged with 6% energy windows at the same z-values.