HAL Id: halshs-00919296
https://halshs.archives-ouvertes.fr/halshs-00919296
Submitted on 16 Dec 2013
HAL is a multi-disciplinary open access
archive for the deposit and dissemination of
sci-entific research documents, whether they are
pub-lished or not. The documents may come from
teaching and research institutions in France or
abroad, or from public or private research centers.
L’archive ouverte pluridisciplinaire HAL, est
destinée au dépôt et à la diffusion de documents
scientifiques de niveau recherche, publiés ou non,
émanant des établissements d’enseignement et de
recherche français ou étrangers, des laboratoires
publics ou privés.
The PBRM (perception-based regional mapping): A
spatial method to support regional development
initiatives
Mehdi Saqalli, Patrick Caron, Pierre Defourny, Ali Issaka
To cite this version:
Mehdi Saqalli, Patrick Caron, Pierre Defourny, Ali Issaka. The PBRM (perception-based regional
mapping): A spatial method to support regional development initiatives. Applied Geography, Elsevier,
2009, 29, pp.358-370. �halshs-00919296�
The PBRM (perception-based regional mapping): A spatial method to
support regional development initiatives
Mehdi Saqalli
a,*, Patrick Caron
b, Pierre Defourny
a, Ali Issaka
c aUniversite´ catholique de Louvain, Louvain-la-Neuve, BelgiumbCenter for International Research in Agronomy for Development (CIRAD), Montpellier, France cSave the Children Niger, Zinder, Niger
Keywords: Mental geography Niger Development strategies Local perceptions Regional mapping
a b s t r a c t
This paper examines the relevance of a perception-based regional level mapping tool in rural Niger. Two regions in Niger are examined. Results permit to assume that such a tool helped to fill several gaps: (i) a scale gap between local and nation wide studies; (ii) a scientific gap between biophysical and socio-anthropological sciences; and (iii) a meth-odological gap of integration between data sources. Moreover, this method is fast, cheap and action-oriented. Data are easily understandable and usable both by rural communities and development agencies. It provides information about human dynamics at a regional level, which cannot be achieved by other methods.
Ó2008 Elsevier Ltd. All rights reserved.
Introduction
Since the 1980s and the expansion of the humanitarian sector, development workers have revived mental geography in developing countries. The explosion of rural projects managed by different types of development agencies1(DAs) has led to new methods of spatial diagnostics. No real ex ante standard evaluation methodology exists to define the local determinants on which rural development projects should focus (Moss & Edmonds, 2005). One may consider, therefore, that there is a need for an action-oriented tool that captures the main local determinants at the relevant scale of action. Several tools have been developed, but one can observe several gaps:
The first gap concerns the geographical reference: It is not obvious how to integrate mental map results into a geographical positioning system (McNamara, 1992; Halfacree, 1993; Bailly, 2006). With no geographical reference, the information is conceptual and qualitative, but it cannot be expressed in a quantitative manner to estimate and compare situations without some preliminary knowledge of the local organization. This is the case with participatory rural appraisals (PRAs), one of the main tools used by development agencies in their development approach (Loader & Amartiya, 1999; Olivier de Sardan, 2003); PRAs are a combination of community-based tools including mental spatial representation through village territory and resource maps. PRAs are easy to integrate in a first-contact and programming methodology, are not expensive to adopt, and are well suited for the scales at which DAs are intervening on rural development issues at the village level (Chambers, 1994). However, mental maps that are used during PRAs are not geographically positioned, and further attempts to reposition them into geographic information systems (GIS) usually lead to failure. Combined computer-based GIS and mental cartography approaches have been tried (Campo, 2003) but have yet to be defined in terms of a standardized methodology: external data
* Corresponding author. Tel.: þ33 (0)6 1603 8037; fax: 32 10 47 88 98.
E-mail address:[email protected](M. Saqalli).
1 We define as development agencies institutions that are actually working on the field, as opposed to fundraisers. This term includes NGOs, UN agencies,
agencies from Western countries or farmers’ unions.
Contents lists available atScienceDirect
Applied Geography
j o u r n a l h o m e p a g e : w w w . e l s e v i e r . c o m / l o c a t e / a p g e o g
0143-6228/$ – see front matter Ó 2008 Elsevier Ltd. All rights reserved. doi:10.1016/j.apgeog.2008.11.003
are defined as the variables because they are geographically positioned. Therefore, these external data are the pattern where the local perception has to be inserted as data, reinforcing the dominance of external sources upon local ones in the deter-mination of research variables to investigate (Crosetto, Tarantola, & Saltelli, 2006). Moreover, such a method requires about half a year because these attempts need self-impregnating, collecting information and reformulating to adapt the qualitative information to a GIS system (Toure´, Bah, D’Aquino, & Dia, 2004). Approaches such as the one fromOliveira d’Antona, Cak, and VanWey (2008) fill this gap by using sketch maps to be reintegrated into a GIS; however, they work on spatial ‘‘objects’’ that are predefined, i.e., land properties, and such a method may not be efficient for collective ownership areas. Transforming a local perception-based map into a GIS-based data system requires defining first a system of coordinates and references to host qualitative geographical information, without an ex ante definition of the factors or ‘‘objects’’ to describe.
The second gap deals with the geographical scale: Because mental maps at the village level that are practiced during PRAs are focused on the village scale, they do not capture regional scale spatial organization. This factor increases the time needed for a regional assignment and reduces the low-cost advantage of the method (Jackson, 1993). Moreover, such village scale assessments focus on local context and resources as the main influencing factors, neglecting the position of the local site in the regional distribution of opportunities. Furthermore, complementary tools are required to bring a more dynamic point of view to the understanding of the local situation (McCarthy, Dutilly-Diane´, & Drabo, 2004). From an action-oriented point of view, one can notice that a majority of development agencies are progressively shifting from projects to programs, meaning that the extension of their development actions are growing in time and space.2There is, therefore, room for a regional-scale tool between national level tools and village level based tools, such as the PRA methodology.
The third gap is related to the scientific discipline sectorial oppositions: the lack of dialogue between social and ‘‘hard’’ sciences in the field of development points to the link between the scale gap and the discipline gap: National level tools usually largely rely on economic and geomatics analyses,3while village level based tools largely rely on socio-anthropo-logical methods.4 Several major paradigms and debates are not widely and pragmatically discussed because of this gap, such as the Malthus/Boserup controversy about the differential co-evolution between population and environment ( Mor-timore, Tiffen, Boubacar, & Nelson, 2001). Actually, facing the large number of unknown local factors and variables to investigate, and lacking the necessary time and money, and reliable and continuous local data provided by the local government or an other development institution (Mettrick, 1994), some rural development operators tend to rely on external data sources. These sources give the impression of reliability and are updated frequently, but they do not necessarily provide relevant information, especially regarding social and economic issues at the relevant scale, i.e., the regional level where development agencies are usually working. Such agencies, therefore, focus on the national level, setting aside the differentiations that may appear between and within the regions of a country. In contrast, because a lot of DAs, mainly NGOs, work at the level of a village or group of villages, they tend to rely on their own information, which is mainly qualitative due to the lack of time and money to dedicate to large and systematic inquiries (Lohmeier, 1997; Aubel, 2000). The ideological context of these institutions and the academic and social background of their agents and creditors also influence the points of view of these actors with regard to rural development issues (Olivier de Sardan, Boiral, & Lanteri, 1995), which may condition their definition of the factors on which to focus. Building a tool that derives the legitimacy of the selection of the factors and constraints to work on from local perception-based criteria may be useful. Once the selection legitimacy is defined in this way, such a tool can combine disciplines in an appropriate and legitimate manner and can facilitate filling the gap between disciplines.
Finally, the last gap is linked to the information accessibility: from a practical point of view, information acquisition capacity and databases are important pathways for international funding, which eventually also lower the will of agencies to share information (Biershenk, Chauveau, & Olivier de Sardam, 2000). Few institutions have the expertise, the dedication of assets and the time to generate information from field statistical surveys or high-resolution satellite image analyses, which reduces the number of information sources. Moreover, several DAs are funded by short-term contracts, meaning that they often have difficulty allocating funds and assets for evaluation purposes. Finally, such an evaluation can result in a redefinition of the project pattern itself (Bonnal, Chauveau, Lebas, & Lavigne-Delville, 1997; Watkins & von Braun, 2004; Audinet & Haralambous, 2005), which induces many development agencies to present their own criteria and proposals and reduces their support for indigenous evaluation. A tool that reduces the cost of obtaining access to relevant factors regarding development issues could support interest in clarifying the objectives of many development projects.
All these factors make the proposition of a low-cost, local perception-based regional map-making methodology (PBRM5) relevant.Caron (1998, 2001)andBonin, Caron, Cheylan, Clouet, and Thinon (2001)have proposed a methodology to collect local perceptions on a regional scale, placing a particular site in its agro-ecologic and socio-economic context. The main objective is the establishment of a dialogue between development agents and villagers through the map-making action: sites are described through separated spatial units that are identified through criteria cited by interviewees; each unit should be
2 Fundraisers increasingly consider that the regional level and more perennial funding are more relevant, mainly because trade and networks are
considered to be more important, enlarging the scale on which to focus.
3 Considered as the most relevant, mainly due to the fact they rely on data analyses based on external sources.
4 Usually considered as the most interesting discipline to acknowledge the multi-rationality and the complexity of a local society. 5 In French, ZADA (‘‘Zonage A Dires d’Acteurs’’).
spatially homogeneous6regarding these criteria in order to simplify the analysis by looking at the dynamic processes and fluctuations between the units as individual elements. We chose to use this method as it has both a geographic reference and a perception-based source, but we adapted it by making more explicit the different dimensions of each SHU.
This paper presents the methodology and the results of a method focusing on action-oriented factors and based on local-perception data collection and analysis. We evaluate the potentialities of this tool regarding the quantity and the quality of the harvested information, the contribution to development issues and the related information acquisition costs. This meth-odology has been applied to two zones of rainfed Niger, and the results are discussed in terms of the natural resources characteristics and access to these resources, access to infrastructures and means of communication.
Beyond apparent uniformity: realities of rural rainfed Niger
Niger is a landlocked African country that has the highest fertility rate (7.46 children born per woman), one of the lowest GDPs per inhabitant ($900 purchasing power parity), and the lowest ranking on the United Nations Development Fund index of human development (HDI). Distance is a difficult problem for development agencies since the country spans 1500 km from east to west (Poncet, 1973).
Rainfed agriculture can be practiced on less than 15% of the territory. It is the country’s main activity in terms of land occupation and manpower requirements during a single rainy season, which lasts from June to October (Tahirou & Low-enberg-DeBoer, 2000). Agriculture is managed with an anti-risk and extensive approach, given the low fertility of the soils and the uncertain rainfall (Graef & Haigis, 2001). Irrigated surfaces are located only along the Niger River valley and in areas where the water table is shallow. The locations of cash crop productions, such as groundnuts, onions or cowpea, are mainly governed by the history of commercial collecting networks. For generations, male farmers from the rainfed part of the country have been seasonal migrants during the dry season (Reardon, 1994; Timera, 2001).
The population has exploded from 1 to 14 million in a century (Guenguant, Banoin, & Quesnel, 2002). The population of rural rainfed areas has conquered its own internal ‘‘frontier’’ by cultivating more land and settling in new villages. The space colonization movement is fully complete in the south-central part of rainfed Niger (Region of Maradi), as described by
Mortimore, Tiffen, Boubacar, and Nelson (2001). The expansion is in a transient stage in the region of Damagaram (Eastern region). In the region of Zarmaganda (western region), this movement seems to have been slowed by an increasing migration rate.
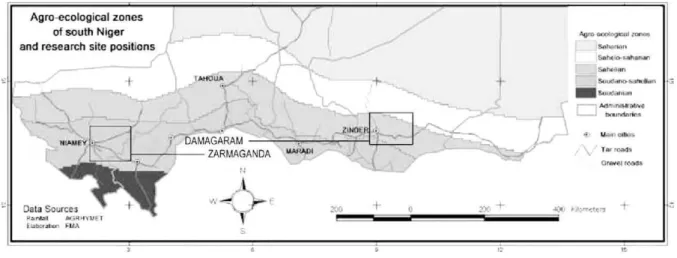
The choice of the two sites reflects the intention to represent part of the diversity encountered in rainfed Niger. The first one is close to Zinder (Central Niger), hereafter named the site of Damagaram. With an average rainfall between 250 and 400 mm, it is located at the northern limit of the rainfed arable zone. The second site, hereafter called the site of Zarmaganda,7 is close to Niamey (Western Niger), with higher rainfall (450–550 mm). As shown inFig. 1, these two regions: (i) are situated in areas with rainfed agriculture; (ii) receive an average to low rainfall; (iii) are close to a regional urban center; and (iv) are linked to the main farming ethnic groups of the country. The selected sites in these two regions: (v) are considered as poorly resource-endowed; and (vi) are both sites where research and development operators have worked for more than 10 years (Ge´rard, 2002).
Methodology Preparing interviews
The PBRM needed a legible geographical support on which mapping was done. In the two cases, we used a 1/200,000-recomposed map from the National Geographical Institute of Niger (IGNN) as the background for the drawings. Each map was centered on its site and scaled to about 60 km per side, or 3600 km2. Each site was split into a number of parts equal to the number of days available. Each sub-area was mapped each day.8We selected large, rural market-based centers as scattered as possible, in order to cover adequately the zone and to have access to a large variety of people. We contacted interview candidates in each of these villages when the widest variety of people with the most diverse backgrounds and the best knowledge was accessible9through the support of local resource-persons (teachers, association representatives, local chief representatives, etc.).10Table 1shows the distribution of professions and functions of interviewees for our survey in the
two sites.
6 Hereafter referred to as a Spatial Homogenous Unit (SHU).
7 Damagaram and Zarmaganda are the local social and former political names of the two regions, to avoid confusing them with urban and research
denominations.
8 In our case, six villages were chosen for each site, one per sub-area. 9 I.e., in our case, during market days.
10 In our case, this step took a week per site because it required a lot of time for preparatory contacts. We adapted our schedule by sending one member of
The PBRM mapping
Map-making was performed when interviewees were more free from other activities.11 Two research teams were composed of two interviewers and two interviewees. On every team, one interviewer wrote down information while the second asked questions and discussion. Each team had to make one interview including one map per half-day and per market-based village, meaning four maps per day, for a total of 24 maps and 48 people interviewed for each site.
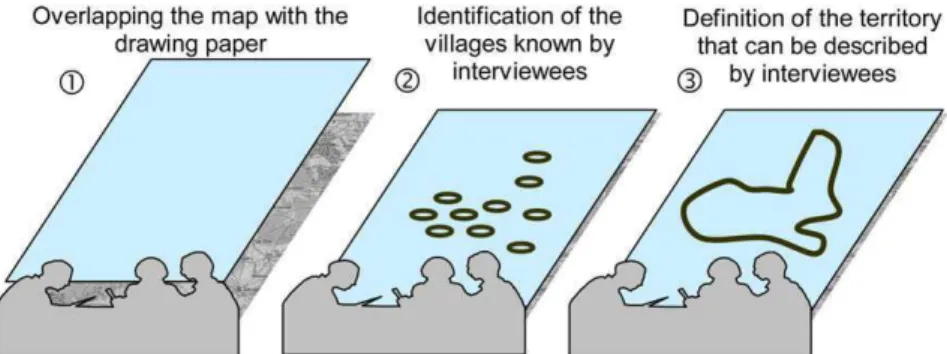
The principle was to interview simultaneously two people with different knowledge domains and social standings and, if possible, who do not know each other, in order to limit pre-status conflicts or dominance based on gender, age or other social issues. The results depend very strongly on the spatial size and the accuracy of the interviewees’ knowledge12and their will to participate in the discussion,13as well as the interviewers’ capacity to limit the influence of social stature between themselves and interviewees and between the interviewees. The methodology is summarized inFig. 2.
The interview began by putting the tracing paper on the 1/200,000 map
r
and giving pencils to the two interviewees. The first stage was the identification of the interviewees’ spatial domain of knowledge, by circling the villages that he/she recognizess
,14i.e., the territory that the villager can describe based on his/her domain of activityt
. Because the majority of interviewees are not familiar with maps, we started the identification by circling the name of the interview village on the map, and then we extended the area village after village around the first circled village. Limits are defined as separating villages that are included in the area and villages that are not but are not spatially precise.15To allow both interviewees to intervene, each interviewee traced his/her own domain of knowledge. Both domains were then combined, but the inter-viewer had to keep in mind the areas that are known by both interviewees and the areas that are known by only one interviewee.The second stage consisted of dividing the drawn territory into homogeneous units. These units can include different agro-ecological environments (both plateaus and plains for instance), but this combination has to be a homogeneous system of use and knowledge (Lewis and Sheppard, 2006), such as the same sequence of plateaus, slopes and plains. Only the interviewees defined the criteria of differentiation, without any suggestion on the part of the interviewer.16The origin of these criteria17 was noted, in addition to the discussions and reactions between the interviewees. In the case of areas that were known by the two interviewees, each interviewee had to answer on his/her own. The criterion that affects the biggest territory is integrated first, then the second one is added and used to open a debate between the two interviewees to define at what level it is included.
In the third and last stage, the interviewers questioned the interviewees ’’ for each identified SHU through a framework of factual questions
u
: what are the local infrastructure facilities in the SHU (markets, religious buildings, dispensaries &Fig. 1. Localization of the two sites within the ecological organization of Niger.
11I.e., in our case, outside market days.
12 For instance, a female gardener has a precise knowledge of a very spatially limited area while a Fulani semi-nomadic herder has a spatially wise
knowledge of natural resources but no detailed information about village particularities.
13For instance, a trader disregarded the fact that we were considering the female co-interviewee as an equivalent source of information as him and stayed
quiet.
14The related question during interviews is ‘‘What are the villages that you can talk about?’’. 15All the following limits of the maps have the same limitations.
16Here the biggest mistakes often appeared: facing hesitation and embarrassment from interviewees, the interviewer had to stop him/herself from
‘‘helping’’ people with suggestions.
hospitals, schools)? What are the main economic activities in the SHU and trade flows between it and the others? What are the dynamics of the population living in this SHU (settlements & emigration)?
Synthesizing and formalizing results
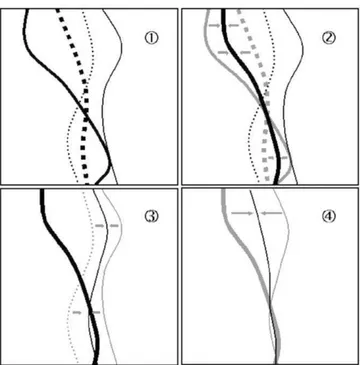
The final step for each site consisted in combining the twenty-four maps. The task is to get a map with a limited number of well-described and relevant units. The factors chosen to determine ambiguous cases and combine the maps were not only the repetition of a criterion throughout interviews18and the accuracy of an interviewee about that criterion, but also the amount of information produced by this criterion in order to get access to as much diversity and discriminative information as possible.19Once the maps that described a criterion were selected, the drawings of a limit were based on a simple in-between balance between the different specific delineations, as all maps are considered with an equal importance (Fig. 3). Once the final map was obtained, the SHUs were discriminated in different information layers to make more explicit the different dimensions of each SHU. The objective was their incorporation into GIS software for a further combination with secondary data.
Results
Criteria for spatial differentiation are defined locally. Therefore, the corresponding grids and legends for the cartographic results are obviously not similar. On the other hand, the order and the way in which these criteria appear during the map-making process provide information on the local hierarchy of factors. Here we present the results of the definitive maps of the two sites.
A first classification based on environmental characteristics
For all the interviewees in the site of Zarmaganda, the territory was first described according to biophysical criteria, as shown inFig. 4(left). Water availability in quantity and quality distinguishes the whole region. Interviewees clearly and rapidly delimited the two valleys (the Niger river valley and the dry Dallol Bosso valley20) and the plateaus. Valleys are described as enjoying the highest level of natural resources, mainly because of their very easy access to shallow and clear water but the delimitation with the plateaus depends upon the background of the interviewees, according to botanical (presence of Hyphaene thebaica or Balanites aegyptiaca), hydrological (shallow water at less than 3 m) or physical factors (visible presence of a valley).21Portions of the dry Dallol Bosso valley and other talwegs defined two SHU where gardening can be practiced and where wells are easy to dig. Meanwhile, the main tributary in the center of the Dallol is very salty.22
Water here is accessible but is only suitable for livestock, not humans or crops.23Finally, the plateaus between the two valleys and beyond the Dallol Bosso are defined as ‘‘dry and hard’’.24
In order to build some confidence on the PBRM methodology, one can compare the pedomorphological map from the well-documented IRD Niger Database (IRD, 1974) with the PBRM map compiling the biophysical dimensions. However, the latter was built using Spot-5 images to superimpose the surface occupied by the hardened lateritic plateaus in order to see
Table 1
Distribution of interviewees according to their professions.
% Type Government officersa Farmers & gardeners Herders Traders Men Women
Zarmaganda 27.1 27.1 20.8 25 68.75 31.25
Damagaram 25 37.5 14.6 22.9 62.50 37.50
aTeachers, nurses, chief representatives, agriculture officers, etc., over-represented for accessibility and diplomacy reasons.
18 In the case introducing this method, we hierarchized the criteria according to the number of repetitions multiplied by the level of hierarchization to
which the criterion has been assigned. Therefore, the more a criterion has been noticed and the more it has been noticed with a high level of hierarch-ization, the more frequently this factor is included in the final map with a high level.
19 In our case, the economic criterion was included as the third level of discrimination of the Zarmaganda firstly because this factor appears as the most
frequently notified by the interviewees as the first criterion of description but also because it allows defining several zones of an area that could have been otherwise relatively homogeneous on a biophysical point of view.
20Dallol Bosso is a north-south-oriented dry and large affluent valley of the Niger River.
21 For instance, Fulani herders define the dallol as more sandy and with Hyphaene thebaica, while female gardeners used the depth of the shallow water
as the main criterion.
22Natron in the north of the area, salt in the south.
23The 1/200,000 IGNN map in combination with post-map-making village history interviews leads us to conclude that all the villages founded before the
20th century are close to the valleys or talwegs. These pre-colonization founded villages are historically either composed of Fulani, at that time mainly semi-nomadic herders, or either composed of Zarma, at that time farmers. Toponymy supports the conclusion: villages with Fulani names are concentrated in the center of the Dallol Bosso valley, where only livestock raising can be practiced, and villages with Zarma names are located along the border of the valley, where gardening and dry cropping can be practiced.
their spatial distribution and coverage. As shown inFig. 3(upper left & down), the results are comparable; the IRD map (down) shows more geographical and pedological precision discriminating plateaus and plains, while the PBRM map (upper left) shows new information layers (the salinity and the valleys’ extension defined by the accessibility of shallow water) and is easier to present to development operators and villagers.
In the same way for the site of Damagaram (Fig. 3, right), for the majority of interviewees, the discrimination is based on combinations of biophysical factors25such as crop production indicators in combination with rainfall.
The two territories are different in their spatial and biophysical organization, but interviewees of both sites first described their areas according to factors that condition the primary and most structuring economic activity, i.e., biophysical charac-teristics, among them irrigation capacity for farming. Water access is ultimately the factor that most determines the orga-nization of both regions.
The organization of the economic activities, derived from the biophysical structure
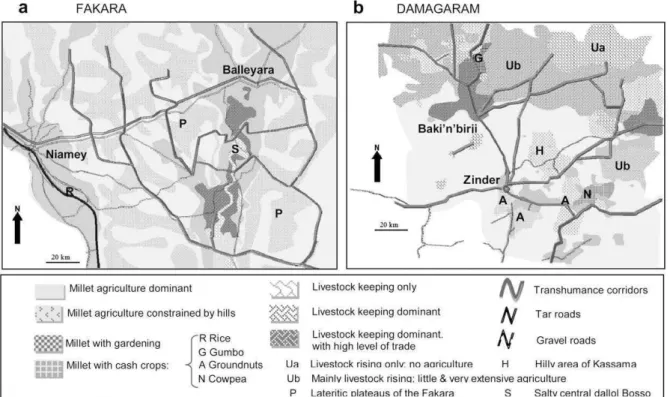
Both sites’ biophysical characteristics relate to a diversity of uses (Fig. 5): agriculture constitutes the dominant activity in places described as favorable based only on biophysical criteria. These same criteria determine, together with road access, the areas where agriculture is mixed with cash crops.26They are fully farmed and densely populated.
In both sites, keeping livestock is dominant in poorly endowed areas:
The livestock areas of the Damagaram site are the northernmost zones with low rainfall, sandy soils and where wells must be drilled excessively deep (>50 m). This area differentiates itself into one area where very extensive agriculture remains (Ub) and a second area (Ua) where no fields can be cultivated. Finally, the central, very stony hills (H) are not arable and very poor grazing areas, thereby considered by the majority of farmers whom we interviewed as the least favorable zones of the entire site. This is in agreement with the results of the PRA campaign of the NGO AQUADEV between 2000 and 2003 (AQUADEV, 2006).
The site of Zarmaganda has two types of livestock areas (Fig. 4left): plateaus are mainly allocated for livestock grazing, apart from small areas with sand deposits. The central natroned and/or salty dallol Bosso mainstream cannot be cropped but is favorable for livestock due to the ‘‘salty cure’’ it gives to the herds.
Fig. 2. The different steps of the PBRM-mapping process.
25Sand/clay ratio in the soil and presence of gravel or hills. Sandy zones are decribed to have better yields during dry years, while clay-rich zones are said
to be more productive than the sandy ones during rainy years. Hilly zones are described as the harshest places to live, since the land is too small for fields between the granite hills; water is very deep and grazing areas are rare.
26Rice in the perimeters along the Niger river (R) in the site of Zarmaganda; gumbo (G), peanut and cowpea, groundnut cropped in sandy soils (A) and
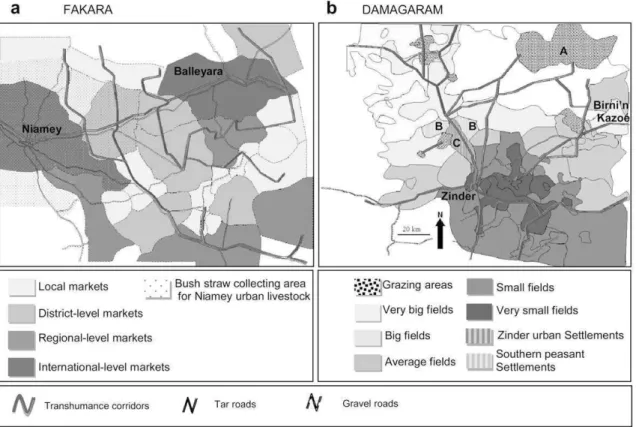
Both areas are zones of herd convergence. Transhumance corridors27are organized in a network often parallel to tracks, tar or gravel roads. They mainly link northern pastoral areas to the main markets, from which livestock is routed toward urban consumption centers (Niamey or Zinder) or dispatching centers (Balleyara in the site of Zarmaganda; Baki’n’Birji in the site of Damagaram). The latter are close to grazing places that we defined as livestock raising and trade areas.
One may suppose that the reason why biophysical factors first appeared as description criteria is that they condition some of the main income-generating activities. Meanwhile, further individual interviews have shown that seasonal migration is the second and sometimes even the first source of income within families but no related criteria have been notified during interviewees, such as access to roads.
The intensification of practices: a urban influence
The market census by the administrative authorities has fewer markets than we counted, particularly at the Damagaram site, where a lot of small markets are inter-related. The two sites were described along different organization patterns (Fig. 6): The site of Damagaram is on its way to being structured according to a gradient of demographic density from south to north. Interviewees considered there to be no free land left to settle south of the Zinder-Birni’n’Kazoe´ gravel road. South-originated rural settlers progressively colonize the land north of this road. Some spaces remained unsettled, as they are too far to the north (TO). The zone that borders the Zinder north road axis is particularly affected (B) by these rural settlements, but this movement competes with another urban-originated expansion: urban tradesmen from the city of Zinder are settling new intensive farms (C), preventing rural-originated settlements.
On the other hand, almost all the interviewed people of the site of Zarmaganda referred, after a long hesitation, to the hierarchical market structure.28Niamey is the main consumption market where products converge for urban needs. It also acts as an exchange node with coastal countries. The impact of Niamey city is lower than expected: the majority of interviews have shown no polarizing effect except for an urban straw collection area.29The second market, Balleyara, is mainly a live-stock trade market, since it is the crossing point between the northern nomadic herding territory, the dry valley livelive-stock road, and the roads leading to the Nigerian markets.
Thus, the interviewees’ description underlined the difference between the two sites: the site of Zarmaganda is structured in commercial networks but does not seem to be as affected by settlement dynamics as in the site of Damagaram.
Fig. 3. Synthesizing several delineations concerning the same criterion during the last map-combining stage of the PBRM.
27 These corridors are routes of travel for herds, so that herds can cross village territories and cause as little damage as possible to the surrounding fields
and therefore limit agro-pastoral conflicts.
28Only one interviewee described the area along a demographic pathway as in the Damagaram site.
29Bacae¨r, Bah, and Mahamane (2004)underlined the extension of the fuelwood collecting area of Niamey, which seems to include the whole area covered
The first step of the method, by identifying the global structure of the region, facilitated the next step, i.e. determines the local dynamics by the identification of the relations and movements within and between the SHU.
Access to basic infrastructure
The interviewees described access to infrastructure facilities (sanitation, schools and wells) according to the importance of each type of facility to them. The Damagaram interviewees underlined the almost universal access to wells and thus
Fig. 4. PBRM results of the biophysical organization of the two sites & IRD Morphopedological map of Zarmaganda (IRD ex-ORSTOM mapping service, 1974) using the FAO soil classification (Hiernaux, 1998).
eliminated this factor as discriminatory.30In the site of Zarmaganda, wells were mentioned as still in the stage of primordial infrastructure.31 Concerning the access to school facilities, there may have been confusion about the definition of these
facilities (school vs. high school; Moslem path vs. laic path), so we did not use schools and wells as comparative factors. The PBRM shows some civil society-built elements; for instance, local committees or private donors build ‘‘Friday mosques’’, i.e., important religious buildings, without notifying national services.
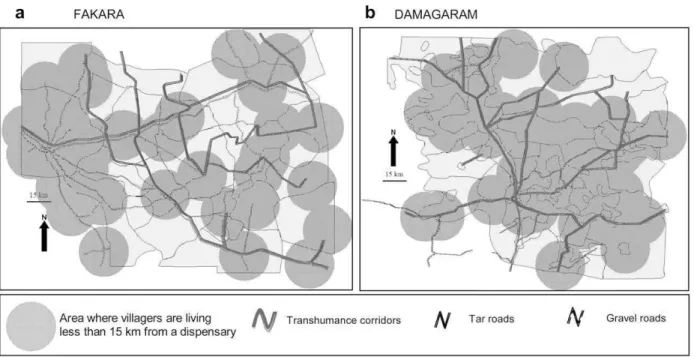
Dispensaries are clearly defined. For the Zarmaganda site, the number of recorded dispensaries agrees with lists from NGOs and the national administration (CARE, 2002). For the Damagaram site, our census and the administration’s did not correspond. Many governmental dispensaries are not actually active. Some that we recorded are not registered because NGOs cleared old dispensaries without notifying national services. We illustrated the medical services coverage within a 15 km radius of the recorded dispensaries,32as shown in Fig. 7. The site of Zarmaganda is para-doxically less covered (64.8% of the territory) than Damagaram (82.1%). We do not know why this difference exists. Thereby, this tool is useful to clarify the infrastructures that are ‘‘real’’ and already working from the ones that are only officially in place.
Discussion
As summarized inTable 2, the PBRM should be considered a complementary tool to include in a panel of methodologies according to each particular purpose. This method is low-cost, fast and explores human dynamics at the regional level. Moreover, it is a tool for a better dialogue between scientific disciplines and results:
Some of the results are counter-intuitive: For instance, sanitation coverage is less developed in the area of the capital city. The economic impact of this town is lower than expected. No criteria that can be related to seasonal migration have been noted during interviews. Finally, one may notice that the order on which factors appeared during interviews33were the same in both sites.
Fig. 5. PBRM results for the dominant activities organization of the two sites.
30NGOs and the government have launched an important well-construction program.
31 This is likely related to the fact that the main symbolic act for village foundation in the Zarma area is to dig a new well. In the Hausa area, founding
a village is more associated with new field clearings. Wells are then politically connoted infrastructures in Zarma areas.
32A distance of 30 km is the maximum distance a villager can walk in a day, and public transportation is not really affordable for a large majority of the
population.
Moreover, as a regional level tool, it allows us to underline new elements, such as the socio-economic importance of some biophysical factors: For instance, the salty characteristic of the Dallol mainstream in the Zarmaganda site determines the ethnic spatial organization and explains some of the livestock movements. Other elements were noticed, such as permanent fluxes (the bush straws’ collecting area and the market areas redefine the villages as interdependent and open systems), temporal human dynamics (the human settlements reposition the villages in their historical evolution). Finally, the tool helped to actualize the network of infrastructure facilities: In our case, civil society-originated buildings (Mosques, dispen-saries) were revealed and the dispensary networks have been actualized.
On a scientific point of view, these social results are based on reliable information, are able to be analyzed statistically, are replicable, and are comparable with other methods and between several zones. They can be integrated into a GIS to permit further analyses by combining them with other sources of quantitative data, such as pedological maps. The PBRM, as a modeling tool,34can help bridge the divide between the social and biophysical studies (Soini, 2001).
These results are action-oriented: because the discrimination factors are derived from interviewees rather than experts, one can suppose that planning development actions upon these factors will be more focused on indigenous issues. It is, therefore, also a tool of dialogue between researchers and development agents. Eventually, the method may be used as a tool for development agents, forcing them to better take into account the hierarchy of local constraints. This first PBRM step, thanks to the definition of the variables to look after and the objectives to realize, may then and only then be followed by a step dedicated to experts, i.e. problem-solving and planning along the usual development project process. The method is an interesting educational tool for new researchers, agents and students, and information is acquired more quickly than during PRAs. Finally, this tool, by focusing on geographical issues without asking about village boundaries as in the PRAs, reduces the risk of causing or exposing ambiguities and political problems within villages that an NGO may want to support (McCall, 2002).
Finally, as shown in the case introduced in this study, each PBRM mission costs V1925,35including wages and trans-portation costs. The PBRM is cheaper than several other data and criteria acquisition methods. It allows identifying
human-Fig. 6. PBRM results on human occupancy dynamics and organization in the two sites.
34A model can be assumed as ‘‘a finalized and theoretical representation of the reality, built on the basis of located observations, of a pre-defined pattern
which will then be re-used on the same situations or new ones to study in order to better describe and understand them’’ (Landais, 1992). For example, a map is considered a model.
35The money figures are kept in V because the change rate between this currency and the local one, i.e. CFA Franc is fixed, thereby avoiding the large rate
Fig. 7. PBRM results on dispensary access coverage for the two sites.
Table 2
Comparing observed investigation methodological tools in the context of rainfed Niger.
Remote sensing Field measure campaigns PRAs PBRM
Information sources
Medium Satellite images Field observations Population assembly
& interviews
Resource person interviews
Tools Image processing &
GIS
GIS None GIS
Topics Land cover, &
then Biophysics & land use
Biophysics & agro-ecology
All expressed dimensions All expressed dimensions
Input Cost V2750a V5150b V1330c V1925d
Required time 15 days 30 days 10 days 15 days
Required expertise Remote sensing, biophysics & agro-ecology Biophysics & agro-ecology
Mainly humanities Mainly humanities
Output Semantics Low High High Very high
Topology Low High High Very high
Spatial resolution
Very high High Very low Low
Repeatability High High Low Medium
Study area size Regional to national Local Local Regional
Quality assessment
Field campaigns & data correlations
Repetitions Crosschecking
within village
Crosschecking between maps, with external data
Purpose Data collection &
correlation
Data collection Variable collection Variable collection,
GIS crossing with various sources
Objective Science legitimacy,
research oriented for decision support
Science legitimacy, research oriented Local legitimacy, action-oriented Local legitimacy. Action-oriented
aAverage two images to analyze, with a cost of V1000 each, average minimum monthly salary V1500. b Average minimum monthly salary of a seven persons team: V4150; mission logistics & materials: V1000. c Average minimum monthly salary of a five persons team: V2650; mission logistics & materials: V450.
d Average minimum monthly salary of a five persons team: V2650; mission logistics & materials: V600. The present time change rate is: V1 for US$1.26
based development factors in a quicker and, thereby, cheaper way compared to long periods of anthropological participatory observation.
However, from a research point of view, the tool has several inconveniences, which are linked to its advantages: Firstly, as a perception-based tool, social factors can induce strong bias during sampling (seeTable 1) and mapping, which can reduce the representativeness of the interviewees.
Moreover, emic toponymy provides some fuzzy definition of the geographical limits, related to their richer semantic definitions. Local definitions may also bring confusion, such as in the case of schools. The SHU subdivision can rebuild the definition precision, but the step requires caution not to omit some elements due to oversimplification. Therefore, the last step of the method, map combining, is a very time-consuming step, which decreases the time efficiency of the field steps.
Finally, SHU limits are geographically precise regarding topology but not spatiality. For instance, gardening zones define the territories of villages where irrigated gardening is practiced but not the specific spatial territory of the irrigation schemes. As the PBRM marks out a relevant pattern for action by discriminating village units, it does not create spatially precise research-oriented outputs.
Conclusion
The PBRM cannot be considered a panacea; however, this tool provides a local perception-based guideline for reasoned development actions and research. It thus supports the objectives of development agencies or researchers as an assessment of the relevance of their activities. The strong interest in this tool by NGOs, farmers’ organizations and researchers in social and development studies in Niger may illustrate these is potentialities. Meanwhile, because the legitimacy of the factors to work on is attributed to the population’s perception, it will obviously open debates among the community of development actors. Such debates may be useful and fruitful within appeased institutions but may increase or reveal hidden conflicts between them. In any case, one may consider that such debates are unavoidable and even necessary in an action-oriented development program.
References
AQUADEV. (2006). Suivi de la se´curite´ alimentaire; Re´gion de Zinder: De´partements de Mirriah, Tanout et Goure´ Situation fin Octobre 2006. AQUADEV Zinder. Bulletin Trimestriel. 6.
Aubel, J. (2000). Manuel d’e´valuation Participative de Programme: Comment assurer la participation des exe´cutants de programme dans le processus d’e´valuation.
Child survival technical support. Washington: USAID Publications. catholic relief services.
Audinet, J.-P. & Haralambous, S. (2005). Achieving the millennium development goals: rural investment and enabling policy. IFAD Governing Council. 28. Bacae¨r, N., Bah, A., & Mahamane, A. (2004). Fuelwood harvesting in Niger and a generalization of Faustmann’s formula. Working paper IRD 1–10. Bailly, A. S. (2006). Subjective distances and spatial representations. Geoforum, 17(1), 81–88.
Biershenk, T., Chauveau, J.-P., & Olivier de Sardan, J.-P. (2000). Courtiers en de´veloppement. Les villages africains en queˆte de projet. Paris: APAD-Karthala. Bonin, M., Caron, P., Cheylan, J.-P., Clouet, Y., & Thinon, P. (2001). Territoire, zonage et mode´lisation graphique: recherche action et apprentissage.
Geo-carrefour, 73(3), 241–252.
Bonnal, J., Chauveau, J.-P., Lebas, P., Lavigne-Delville, P. (1997). La Dynamique des Socie´te´s Rurales Face aux Projets Participatifs de De´veloppement Rural: Re´flexions et Propositions d’Action a` Partir d’Expe´riences d’Afrique de l’Ouest. Rome, FAO. 11.
Campo, P.C. (2003). Multi-agent systems modeling integrating geographic information systems and remote sensing: Tools for Participatory Natural Resource Management (Prototype for Loon in Bohol, Philippines). Manila, M.Sc. in Remote Sensing, College of Engineering, University of the Philippines. CARE. (2002). Household Lifestyle inquiries result for Niger. Niamey: CARE Project.
Caron P. (1998). Espaces, Elevage et Dynamique du changement: analyse, niveaux d’organisation et action: Le cas du Nordeste semi-aride du Bre´sil.Paris, PhD in Geography, Universite´ Paris 10.
Caron, P. (2001). Mode´lisation graphique et chore`mes: la gestion des parcours collectifs a` Massaroca (Bre´sil). Mappemonde, 62(2), 1–21. Chambers, R. (1994). Participatory rural appraisal (PRA): analysis of experience. World Development, 22(9), 1253–1268.
Crosetto, M., Tarantola, S., & Saltelli, A. (2006). Sensitivity and uncertainty analysis in spatial modelling based on GIS. Agriculture. Ecosystems and
Envi-ronment, 81, 71–79.
Ge´rard, B. (2002). Projet Aide a` la de´cision full proposal. Bruxelles: DGCD.
Graef, F., & Haigis, J. (2001). Spatial and temporal rainfall variability in the Sahel and its effects on farmers’ management strategies. Journal of Arid
Envi-ronments, 48(2), 221–231.
Guenguant, J.-P., Banoin, M., & Quesnel, A. (2002). Dynamique des populations, disponibilite´s en terres et adaptation des re´gimes fonciers: le cas du Niger. In F. Gendreau, & M. Lututala (Eds.), De´veloppement durable. . Rome: FAO. (Chapter 3).
Halfacree, K. H. (1993). Locality and social representation: space, discourse and alternative definitions of the rural. Journal of Rural Studies, 9(1), 23–37. Hiernaux, P. (1998). The soils in villages’ lands in western Niger, opportunities and constraints for rural development. Niamey: ICRISAT. Report.
IRD. (1974). Pedomorphological maps of Niger: 1/100 000. Paris: IRD.
Jackson, C. (1993). La gestion d’e´quipes de recherches interdisciplinaires: l’expe´rience de l’ICRA. Wageningen-Montpellier: CTA-ICRA.
Landais, E. (1992). Principes de mode´lisation des syste`mes d‘e´levage. Approches graphiques. Cahiers de la Recherche De´veloppement, 32, 82–95. Lewis, J. L., & Sheppard, S. R. J. (2006). Culture and communication: can landscape visualization improve forest management consultation with indigenous
communities? Landscape & Urban Planning, 77(3), 291–313.
Loader, R., & Amartiya, L. (1999). Participatory rural appraisal: extending the research methods base. Agricultural Systems, 62(1-3), 73–85. Lohmeier, J. (1997). Atelier de formation planification Participative et gestion du Cycle de Projet: Le Manuel. Dakar: COMiT Publications.
McCall, M. K. (2002). Seeking good governance in participatory-GIS: a review of processes and governance dimensions in applying GIS to participatory spatial planning. Habitat International, 27, 549–573.
McCarthy, N., Dutilly-Diane´, C., & Drabo, B. (2004). Cooperation, collective action and natural resources management in Burkina Faso. Agricultural Systems,
82(3), 233–255.
McNamara, T. P. (1992). Spatial representation. Geoforum, 23(2), 139–150.
Mettrick, H. (1994). Recherche Agricole oriente´e vers le de´veloppement, le cours ICRA. Wageningen: ICRA.
Mortimore, M. J., Tiffen, M., Boubacar, Y., & Nelson, J. (2001). Synthe`se sur les e´volutions a` long terme dans le de´partement de Maradi, Niger 1960–2000. Montpellier: Drylands Research/CNEARC.
de Oliveira d’ Antona et al. (2008). The related reference is: de Oliveira d’Antona, A´. Cak, A.D. VanWey, L. K. (2008). Collecting Sketch Maps to Understand Property Land Use and Land Cover in Large Surveys. Field Methods. 20 (1), 66–84.
Olivier de Sardan, J.-P. (2003). L’enqueˆte socio-anthropologique de terrain: synthe`se me´thodologique et recommandations a` usage des e´tudiants. Etudes &
travaux du LASDEL, 13.
Olivier de Sardan, J.-P., Boiral, P., & Lanteri, J.-F. (1995). Paysans, experts et chercheurs en Afrique noire, sciences sociales et de´veloppement rural. Paris: CIFACE KARTHALA.
Poncet, Y. 1973. Cartes ethno-de´mographiques du Niger au 1/100 000e`me. Etudes nige´riennes 32.
Reardon, T. (1994). La diversification des revenus au Sahel et ses liens e´ventuels avec la gestion des ressources naturelles par les agriculteurs. In M. Benoit-Cattin (Ed.). Promotion de syste`mes agricoles durables dans les pays d’Afrique soudano sahe´lienne. (pp. 65–77). Montpellier: FAO CTA CIRAD. Soini, K. (2001). Exploring human dimensions of multifunctional landscapes through mapping and map-making. Landscape & Urban Planning, 57, 225–239. Tahirou, A., & Lowenberg-DeBoer, J. (2000). Intensification of Sahelian farming systems: evidence from Niger. Agricultural Systems, 64(1), 67–81. Timera, M. (2001). Les migrations des jeunes sahe´liens: affirmation de soi et e´mancipation. In R. Collignon, & M. Diouf (Eds.), Les jeunes: hantise de l’espace
public dans les socie´te´s du Sud? (pp. 37–49). Paris: KARTHALA.
Toure´, I., Bah, A., d’Aquino, P., & Dia, I. (2004). Savoirs experts et savoirs locaux pour la coe´laboration d’outils cartographiques d’aide a` la de´cision. Cahiers
d’e´tudes & de recherches francophones/Agricultures, 13, 546–553.