ANALYSIS OF APPROACH STABILITY AND
CHALLENGES IN OPERATIONAL IMPLEMENTATION OF
RNP APPROACH PROCEDURES
Sandro Salgueiro and R. John Hansman
This report is based on the Masters Thesis of Sandro Salgueiro submitted to the Department of Aeronautics and Astronautics in partial fulfillment of the requirements for the degree of
Master of Science at the Massachusetts Institute of Technology.
Report No. ICAT-2017-04 May 2017
MIT International Center for Air Transportation (ICAT) Department of Aeronautics & Astronautics
Massachusetts Institute of Technology Cambridge, MA 02139 USA
Analysis of Approach Stability and Challenges in Operational
Implementation of RNP Approach Procedures
by
Sandro Salgueiro Rodrigues Filho
Submitted to the Department of Aeronautics and Astronautics 25 May 2017
In Partial Fulfillment of the Requirements for the Degree of Master of Science in Aeronautics and Astronautics
Abstract
Required Navigation Performance (RNP) instrument procedures guarantee high levels of navigation precision through highly accurate navigation sources (e.g. GPS) and real-time monitoring of position estimation accuracy. In recent years, the Federal Aviation Administration (FAA) has developed and published public RNP approach procedures at airports across the country. These RNP procedures offer unique capabilities such as curved segments (radius-to-fix, or RF legs), narrow containment areas, and constant descent profiles that are not seen combined in other categories of instrument approaches. Because of these capabilities, RNP approaches are regarded as highly flexible procedures that can be designed to meet specific stakeholder requirements (e.g. lower minimums in mountainous areas, minimizing fuel burn during approach, avoiding flight over populated areas for noise abatement, etc.) at the airport level. Among the various proposed benefits of RNP approaches, this study analyzed potential safety benefits related to improvements in approach stability. In total, 11,062 individual approaches at four airports were analyzed using radar (ASDE-X) data, of which 364 (3.29%) were identified as RNP procedures. Of all approaches analyzed, two non-RNP cases were identified as unsafe, while there were no unsafe RNP cases. However, due to the relatively low number of RNP approaches observed, no statistically significant evidence of improved stability on RNP approaches was found. Given the low utilization of RNP approach procedures found from radar data, further work was done to identify barriers to operational use of these procedures and to investigate strategies to accelerate the adoption of RNP across the National Airspace System (NAS). Potential factors driving the low utilization of RNP procedures were found to be the low levels of equipage and operational approval among air carriers, and difficulties in air traffic management stemming from mixed equipage operations.
Thesis Supervisor: R. John Hansman
Acknowledgements
This work was sponsored by the Federal Aviation Administration (FAA). Opinions, interpretations, conclusions, and recommendations are those of the authors and are not necessarily endorsed by the United States Government.
Table of Contents
ABSTRACT ... 3 ACKNOWLEDGEMENTS ... 4 TABLE OF CONTENTS ... 5 LIST OF FIGURES ... 7 1 INTRODUCTION ... 9 1.1 BACKGROUND ... 91.2 APPROACH STABILITY AND SAFETY ... 10
1.3 WHY RNP APPROACHES MAY BE MORE STABLE ... 12
2 APPROACH AND METHODS ... 18
2.1 OVERVIEW ... 18
2.2 THE AIRPORT SURFACE DETECTION EQUIPMENT MODEL X(ASDE-X) ... 19
2.3 DATA SAMPLE AND LIMITATIONS ... 20
3 RADAR (ASDE-X) ANALYSIS RESULTS ... 22
3.1 UTILIZATION OF RNP PROCEDURES ... 22
3.2 ANOMALOUS APPROACH CASES ... 23
3.3 GLIDEPATH TRACKING PERFORMANCE ... 25
3.4 DISCUSSION OF APPROACHES ... 27
3.4.1 Approaches at Chicago Midway (KMDW) ... 27
3.4.1.1 RNAV (RNP) X RWY 22L ... 27
3.4.1.2 Visual Approach RWY 22L ... 29
3.4.1.3 ILS RWY 4R... 31
3.4.1.4 Approaches at New York JFK (KJFK) ... 34
3.4.1.5 VOR RWY 13L ... 34
3.4.1.6 RNAV (RNP) RWY 13L ... 36
3.4.2 Approaches at Denver (KDEN) ... 38
3.4.2.1 ILS Approaches ... 39
3.4.2.2 RNAV (RNP) Approaches ... 39
3.4.3 Approaches at Seattle (KSEA) ... 40
3.4.3.1 ILS Approaches ... 41
3.4.3.2 RNAV (RNP) Z RWY 16C/R ... 41
4 CHALLENGES IN OPERATIONAL IMPLEMENTATION OF RNP APPROACH PROCEDURES ... 43
4.1 BARRIERS TO OPERATIONAL USE OF RNP ... 44
4.1.1 ATC barriers ... 44
4.1.2 Operator barriers ... 47
4.1.2.1 Aircraft qualification ... 47
4.1.2.2 Operator and aircrew qualification ... 48
4.2 INITIATIVES TO ACCELERATE THE OPERATIONAL ADOPTION OF RNP ... 50
4.2.1 Advanced RNP (A-RNP) ... 50
4.2.2 Time-based separation ... 52
4.3 SUCCESSFUL ATTEMPTS TO INCREASE THE UTILIZATION OF RNP ... 53
4.3.1 New York JFK (KJFK) ... 53 4.3.2 Chicago Midway (KMDW) ... 55 4.3.3 Denver (KDEN) ... 56 5 CONCLUSION ... 58 6 REFERENCES ... 60 APPENDIX A ... 61 APPENDIX B ... 62 APPENDIX C ... 63 APPENDIX D ... 64 APPENDIX E ... 65 APPENDIX F ... 66 APPENDIX G ... 67 APPENDIX H ... 68
List of Figures
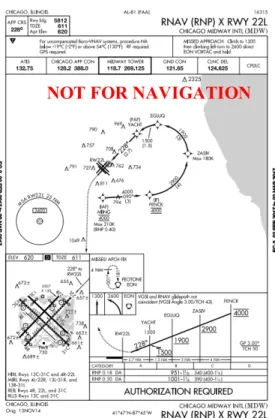
Figure 1. A public RNP procedure at Chicago Midway (MDW). ... 10
Figure 2. Flight Safety Foundation’s criteria for a stable approach. ... 12
Figure 3. The angular nature of the glideslope means that, for the same altitude deviation from
the prescribed glidepath, the pilot sees a bigger angular deviation in his/her onboard tracking instrument the closer he/she is to the runway. ... 13
Figure 4. The dashed red lines indicate the accuracy limit of the RNP track. In the flight deck,
the pilot sees a constant sensitivity in the equipment displaying the vertical guidance. ... 13
Figure 5. Top: in an ILS approach, the aircraft must be on the final approach to receive course
guidance. Bottom: in an RNP approach, guidance is provided continuously, including in turns.14
Figure 6. Top: lateral accuracy limits of an RNP approach. Bottom: vertical accuracy limits of
an RNP approach. A missed approach is required if the aircraft ever exceeds either limit. ... 15
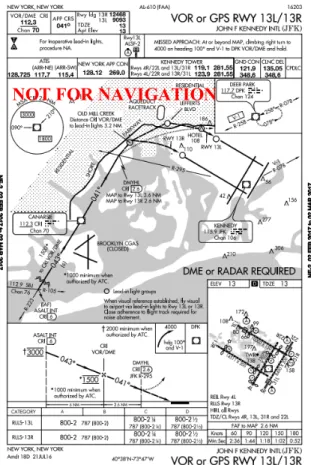
Figure 7. VOR or GPS approach to runway 13L at JFK, which has a visual segment starting at
the DMHYL intersection. The procedure is popularly known as the “Canarsie” approach. ... 17
Figure 8. Airports analyzed were in the intersection of airports equipped with ASDE-X and
airports with RNP AR approach procedures. ... 20
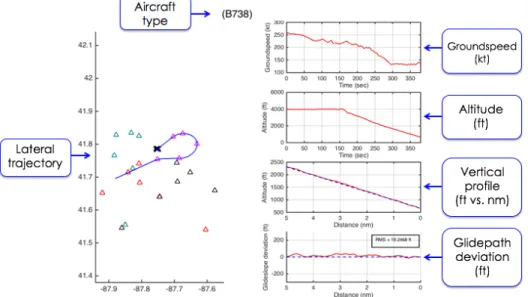
Figure 9. A sample plot of ASDE-X data for a single approach flown into Chicago Midway
(KMDW). ... 20
Figure 10. An unsafe case in which a Boeing 767 flying the Canarsie approach starts a descent
from the MDA while below the nominal 3-degree visual glidepath. ... 24
Figure 11. An unsafe case in which a Challenger 300 flies the ILS approach to 4R and descends
below the glideslope while 4 miles out. ... 25
Figure 12. Histograms of RMS (cumulative) glidepath deviation for aircraft flying RNP, ILS,
and visual approaches. ... 26
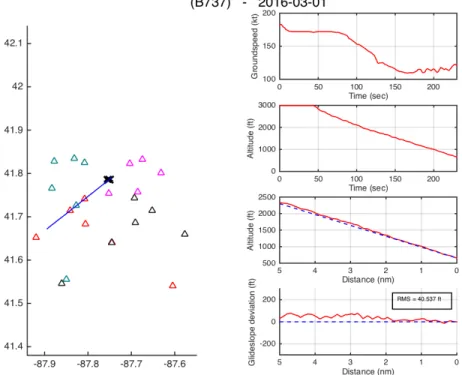
Figure 13. A representative case of an aircraft (a Boeing 737-700) flying the RNAV (RNP) X
RWY 22L at MDW. ... 28
Figure 14. An outlier case showing a Boeing 737-700 leveling off monetarily at 1500 feet while
flying the RNAV (RNP) X RWY 22L. ... 28
Figure 15. Representative cases of aircraft flying visual approaches to runway 22L on different
days. Notice the variability in lateral trajectories and vertical profiles. ... 30
Figure 16. An outlier case showing a Boeing 737-700 on a visual approach to runway 22L
climbing during a turn to final. ... 31
Figure 17. A representative case of an aircraft (a Boeing 737-700) flying the ILS RWY 4R at
MDW. ... 32
Figure 18. An unsafe case showing a Challenger 300 descending well below the glideslope while
4 miles out on the ILS for 4R. ... 33
Figure 19. A representative case of an aircraft flying the Canarsie approach for runway 13L at
KJFK. Notice the level-off at the MDA of 800 feet. ... 35
Figure 20. An unsafe case in which a Boeing 767 starts a descent from the MDA while below the
glidepath. ... 36
Figure 21. A representative case of an aircraft flying the RNP approach for runway 13L at
KJFK. Notice the continuous descent from 3000 feet. ... 37
Figure 22. An outlier case in which a ERJ 190 flying the RNP approach to 13L levels off
Figure 23. A representative case of an aircraft flying an ILS approach at Denver. ... 39
Figure 24. Representative cases of RNP approaches at Denver. ... 40
Figure 25. A representative case of an aircraft flying an ILS approach at Seattle. ... 41
Figure 26. A representative case of an aircraft flying an RNP approach at Seattle. ... 42
Figure 27. Barriers to operational implementation of RNP stem from challenges faced by individual stakeholders. ... 43
Figure 28. Illustration of in-trail vectoring for parallel runway approaches. ... 44
Figure 29. Aircraft being vectored on approach to Chicago O’Hare (cyan). Source: FlightAware. ... 45
Figure 30. The RNP Z RWY 16R at KSEA (Seattle) prescribes a turn-to-final at a specific location along the “downwind leg” of the procedure (red circle). ... 46
Figure 31. Left: RNP approach. Right: ILS approach. Note the identical ground track. ... 49
Figure 32. Left: RNP procedure at KMDW. Right: RNP procedure at KDEN. Both procedures have fuel burn benefits in comparison to other available instrument approaches and encourage the use of RNP. ... 50
Figure 33. ATC display showing TSAS features. On the left, a vertical timeline bar tells the terminal controller when aircraft are expected to arrive at a certain metering fix or position (in this case, the threshold of runway 25L at KPHX). Speed commands can be issued to aircraft in order to adjust their arrival times. Source: MITRE. ... 53
Figure 34. The “Canarsie” approach to runway 13L at JFK. ... 54
Figure 35. RNP approaches to parallel runways at DEN... 56
Figure 36. Utilization rate of RNP approaches at Denver. Note the increase in utilization rate after the EOR waiver was adopted in March 2015. Source: FAA. ... 57
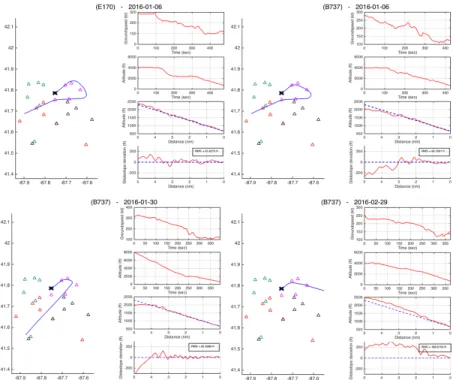
Figure B1. Sample plots showing Boeing 737-700 aircraft flying the RNAV (RNP) X RWY 22L on different days. ... 62
Figure C1. Four different RNP approaches on the left and four different visual approaches on the right. All approaches flown to runway 22L at MDW. ... 63
Figure D1. Plots showing aircraft flying the ILS for runway 4R at KMDW. ... 64
Figure E1. The Canarsie approach as flown by four additional aircraft. ... 65
Figure F1. The RNAV (RNP) RWY 13L approach as flown by four different aircraft. ... 66
Figure G1. Representative cases of ILS approaches at Denver. ... 67
1 Introduction
Required Navigation Performance (RNP) approach procedures offer performance benefits such as reduced fuel burn and shorter flight times. These benefits are enabled primarily by the use of more precise navigation technology that allows for the highly precise tracking of three-dimensional flight paths. This study was initiated with the goal of investigating potential safety benefits that were speculated to exist as a product of this increased navigation performance. Such a study was motivated by the hypothesis that, due to the fact that RNP approaches are required to be flown with an autopilot and have tighter navigation containment, aircraft flying these
procedures may be more stable on their final approaches.
Following analysis of radar data that was used to investigate approach stability benefits, it was discovered that RNP utilization was remarkably low at the airports analyzed. This prompted further research into the barriers to operational use of RNP procedures and initiatives to
accelerate their adoption across the National Airspace System (NAS).
This thesis introduces the methodology used to investigate approach stability benefits in RNP approaches, discusses results of radar data analysis, and investigates reasons for the
observed low utilization of RNP approach procedures at four major airports in the United States.
1.1 Background
Required Navigation Performance (RNP) instrument procedures guarantee high levels of navigation precision through highly accurate navigation sources (e.g. GPS) and real-time monitoring of position estimation accuracy. First used by Alaska Airlines in 1996, RNP approaches were originally designed to improve access to airports located in mountainous regions during times of instrument meteorological conditions. Due to the availability of curved segments (Radius-to-Fix, or RF legs), RNP approaches were found to offer relatively high design flexibility, with the potential of also being used in areas of non-challenging terrain to meet specific local stakeholder requirements. In recent years, the Federal Aviation Administration (FAA) has developed and published several RNP AR (Authorization Required) approach procedures at airports across the country (Figure 1). Many of these new procedures offer lower fuel burn to operators by making use of RF legs to reduce path length as well as constant descent profiles.
Figure 1. A public RNP procedure at Chicago Midway (MDW).
Because RNP AR approaches offer reduced lateral obstacle evaluation areas that are predicated on specific aircraft and aircrew performance requirements, they require special authorization similar to Category II and Category III ILS approaches. At the time of writing of this thesis, all RNP approaches (393) published in the United States were of the AR type. Among the potential benefits of RNP approaches, this study analyzed potential safety benefits that are directly connected to approach stability.
1.2 Approach Stability and Safety
In its 2010-2014 accident report, the International Air Transport Association (IATA) showed that runway excursions today represent the largest source of accidents in commercial aviation, and the third largest source of fatal accidents (90 accidents and 174 fatalities between 2010 and 2014). The Flight Safety Foundation has identified that many of these excursions are the result of unstable approaches where the aircraft was not in proper landing configuration prior to touchdown. Two of the most common elements that appear in runway excursion events are: 1) aircraft too fast on final approach, and/or 2) aircraft too high on final approach. Therefore,
runway excursions during landing can often be traced back to high energy states in the approach phase.
The occurrence of a second category of accident, Controlled Flight Into Terrain (CFIT), is also seen to correlate with unstable approaches. A CFIT event is one where a fully functioning aircraft is inadvertently flown into the ground by the crew, often due to spatial disorientation during an instrument approach. Because CFIT during an instrument approach is more likely to occur when the aircraft is low and close to the ground, approaches in which the aircraft is found to be significantly below the nominal glidepath present increased risk.
Finally, another category of accidents, Loss of Control (LOC) on approach, can be
correlated with aircraft being in a lower-than-normal energy state during final approach (i.e. low airspeed and/or altitude), a scenario that can evolve into an aerodynamic stall and lead to loss of aircraft controllability.
Given the various deviations in aircraft states discussed above that could lead to an increase in risk, the commercial aviation industry takes a methodical approach to preventing unstable approaches by training crews to identify an unstable approach according to formal criteria. Perhaps the most widely recognized set of criteria defining a stable approach is the one published by the Flight Safety Foundation [1], shown below in Figure 2.
Figure 2. Flight Safety Foundation’s criteria for a stable approach.
The stability of an approach can be affected by various factors, such as the availability of onboard vertical guidance and the type of vertical profile being flown (e.g. step-down descent vs. continuous descent). The Flight Safety Foundation has proposed that unstable approaches are often caused by flight-handling difficulties that arise from rushed approaches, attempts to comply with demanding ATC clearances, adverse wind conditions, and improper use of automation.
1.3 Why RNP approaches may be more stable
Today, the ILS approach is the standard precision approach utilized in all major airports in the United States. ILS provides both lateral and vertical guidance along the final approach path by means of a localizer and glideslope beam, respectively. The localizer and the glideslope
provide a straight final approach segment that is tracked for about five nautical miles prior to touchdown. Also noteworthy is the fact that the localizer and the glideslope signals are angular, and change in width as the aircraft approaches the runway. This, in turn, causes the onboard guidance equipment to have variable sensitivity and requires variable control gains from the pilot or autoflight system. Figure 3 below illustrates the angular nature of the glideslope beam, which guides the aircraft along a prescribed glidepath.
Figure 3. The angular nature of the glideslope means that, for the same altitude deviation from
the prescribed glidepath, the pilot sees a bigger angular deviation in his/her onboard tracking instrument the closer he/she is to the runway.
In an RNP approach, the lateral and vertical guidance is instead computed by the aircraft Flight Management System (FMS), which usually relies on GPS and inertial reference sensors for lateral navigation and barometric data for vertical navigation (baro-VNAV). Since the lateral and vertical guidance do not not rely on physical ground infrastructure such as in an ILS, the guidance can be provided to the pilot in a linear fashion (as opposed to angular).
Figure 4. The dashed red lines indicate the accuracy limit of the RNP track. In the flight deck,
RNP approaches differ from ILS approaches in another key way. To begin an ILS approach, aircraft are usually vectored out of their arrival routes and towards an ILS intercept point. During the period when the aircraft is being vectored, no onboard path guidance exists since the aircraft is not following a predetermined trajectory. The crew must therefore make use of tools such as moving maps and approach plates to build a mental picture of the aircraft’s motion and position to maintain situation awareness. Because an RNP approach is, on the other hand, commonly initiated at a GPS waypoint that coincides with a waypoint that is also part of an arrival route, vectoring is not required and the aircraft is able to continuously follow a predetermined path all the way to touchdown. The ability to fly this preconceived RNAV path provides continuous lateral and vertical guidance to the crew during the arrival and approach phases of flight, with no changes in situation awareness. Figure 5 illustrates the situation described above.
Figure 5. Top: in an ILS approach, the aircraft must be on the final approach to receive course
In order to be approved to fly RNP approaches, an operator is required to implement specific operational mitigation practices. For a flight crew, this comes in the form of additional training. During an RNP approach, the crew has the additional task of monitoring the aircraft navigation system performance in real-time, as well as taking appropriate action if navigation accuracy or path tracking becomes compromised. In the United States, the FAA maintains that all deviations from the assigned path during an RNP approach be kept within 1x RNP laterally and within 75 feet vertically. If either of these values is exceeded at any point in the approach, a missed
approach must be initiated (Figure 6). Because of this requirement, along with the fact that RNP approaches are captured “earlier” than ILS approaches and connect directly with arrival routes, it is hypothesized that a crew flying an RNP approach will generally be more aware of path
deviations and have improved situational awareness.
Figure 6. Top: lateral accuracy limits of an RNP approach. Bottom: vertical accuracy limits of
an RNP approach. A missed approach is required if the aircraft ever exceeds either limit. Finally, because the aircraft itself also needs specific approval to fly RNP AR procedures, aircraft manufacturers will normally engage in flight trials to demonstrate a specific aircraft’s ability to maintain a specified navigation accuracy level (i.e. RNP value) [2]. Because all errors (navigation system error, path definition error, and flight technical error) are taken into account when an aircraft is being certified for its lowest possible RNP, these flight trials are often performed with the autopilot engaged during the approach in order to minimize flight technical
error (FTE). As a result, if the demonstration is done using the autopilot only, all subsequent operations of that aircraft in environments requiring the same RNP value must be performed with the autopilot engaged. Typically, aircraft are certified to be flown with either the autopilot or the flight director when the RNP is 0.3 or greater. For RNP values lower than 0.3, the autopilot is generally required to be engaged during the approach. As a result of this requirement, it is
expected that aircraft flying RNP approaches to show more consistent and precise tracking of the approach course due to the use of automation.
Because of the unique characteristics of RNP approaches mentioned above, three hypotheses for how RNP approaches could contribute to more stable approaches and therefore higher levels of safety were raised:
1. The required use of automation minimizes flight technical error (FTE), minimizes crew workload, and puts the crew in a monitoring role where more time can be invested in managing situational awareness. The additional requirement to monitor the aircraft navigation performance in real time as part of the operational mitigation aspect of RNP AR further brings situational awareness into focus.
2. When RF legs are used, aircraft are established on procedure profile before turning to final. It is hypothesized that an early “capture” of the profile could translate into a more stable final approach. In the procedure shown in Figure 1, the aircraft will typically be established in the lateral and vertical profile of procedure at the MIING waypoint.
3. When no instrument procedure offering digital vertical guidance is available for a given runway, an RNP approach can yield a more stable descent by providing onboard vertical guidance. It is hypothesized that approaches to runways that commonly rely on visual segments (e.g. JFK 13L) could benefit from the added vertical guidance that RNP offers. Figure 7 below shows the popular Canarsie approach to JFK 13L, which has a visual segment starting at the DMYHL position. An RNP approach that mimics the visual segment of the Canarsie was developed and implemented by JetBlue.
Figure 7. VOR or GPS approach to runway 13L at JFK, which has a visual segment starting at
the DMHYL intersection. The procedure is popularly known as the “Canarsie” approach. The initial goal of this study was therefore to investigate the stability of RNP approaches flown across the National Airspace System (NAS) and establish a comparison between the stability of flown RNP procedures and that of other types of procedures. The main questions being asked were:
1. Do RNP approaches show benefits in approach stability or safety in general? 2. If yes, can the safety benefit be quantified?
2 Approach and Methods
2.1 Overview
In order to analyze the stability of approaches, high resolution radar data that included aircraft altitude, speed and position data was required. By plotting an aircraft’s descent profile (i.e. altitude vs. distance from runway), glidepath tracking was to be evaluated for the purpose of analyzing approach stability. After experimenting with both terminal radar (PDARS) data and ASDE-X data, it was determined that ASDE-X was the better data source as it had a higher update rate on final approach because of the additional ground multilateration (MLAT) sensors available to the ASDE-X system. While terminal radar provided updates every ~4.5 seconds, ASDE-X was able to update the data up to once per second.
In an initial analysis, dates of radar data for four airports with RNP approaches (KJFK, KMDW, KDEN, KSEA) were randomly selected. During this first round of data analysis, 7,640 approaches were analyzed, with only 64 (0.84%) of them being identified as RNP procedures. As a result of the small number of RNP procedures identified, a new strategy to choose specific dates on which operators were most likely to fly RNP procedures at the specified airports was developed to increase the number of RNP samples. This was done by using the website
FlightAware to search for dates when a runway with a published RNP procedure was being used at a given airport, and finally selecting dates from that subset in which at least one RNP
procedure was observed to be flown in the FlightAware tracking data. At the end of a second round of data analysis using the new selected dates, 11,062 approaches had been analyzed and a total of 364 RNP approaches (3.29%) identified. It is important to point out that the 0.84% RNP utilization found in the first round is likely representative of the average RNP utilization at the four specified airports, while the 3.29% value is biased by the fact that it was obtained with data from days when RNP procedures were known to be used.
Using the ASDE-X data, each arriving aircraft’s trajectory, speed, and altitude were plotted. Each plot generated was then individually reviewed for any anomalies that may represent an increase in risk (e.g. significant deviations from approach glidepath). Each approach analyzed was labeled as either representative (normal), outlier, or unsafe. Each approach received its designation following an analysis of glidepath tracking performance under the following criteria:
• If glidepath tracking showed excursions exceeding 1 dot of glidepath deviation (> 0.35 degrees) below 500 ft AGL, or if at the initiation of an instrument approach the aircraft failed to capture the proper glidepath, the approach was labeled as unsafe.
• If glidepath tracking showed excursions exceeding 1 dot of glidepath deviation (> 0.35 degrees) between 1000 ft AGL and 500 ft AGL that were corrected before the aircraft reached 500 ft AGL, the approach was labeled as an outlier.
• If none of the criteria above were met, the approach was labeled as representative (i.e. normal).
The flagging of outlier and unsafe cases was assisted by algorithms that searched for significant deviations in approach profiles, such as an aircraft being well below glideslope in an ILS approach. The results of this analysis provide the basis for the discussion presented in
Section 3 of this thesis.
2.2 The Airport Surface Detection Equipment Model X (ASDE-X)
The ASDE-X system is available at 36 major U.S. airports and is used to track aircraft movement on both airport surfaces and in the air within a 10-nautical-mile radius of the airport control tower. ASDE-X is an integrated surveillance system that fuses data from primary radar, secondary radar, surface movement radars, and ADS-B [3].
In the United States, the FAA collects and stores ASDE-X data from all of its major sites and makes the data available upon request. This data was the basis for the analysis performed in this work. The data that was obtained covered the period from April 2015 to April 2016, as well as a few days from 2013 and 2014. Airports that were chosen for the analysis were selected based on the availability of ASDE-X data and published RNP AR procedures. Based on the intersection of these two sets, the airports selected for the analysis were Chicago Midway (KMDW), New York JFK (KJFK), Denver (KDEN), and Seattle (KSEA). These four airports were selected from the intersection subset based on the availability of curved RNP approach procedures that would be easy to detect from trajectory data, as well as prior knowledge of operators flying RNP procedures at these locations.
Figure 8. Airports analyzed were in the intersection of airports equipped with ASDE-X and
airports with RNP AR approach procedures.
2.3 Data Sample and Limitations
A sample from the ASDE-X data is shown in Figure 9 and further explained below. This sample shows the profile flown by an aircraft flying the RNAV (RNP) X RWY 22L at Chicago Midway (KMDW).
Figure 9. A sample plot of ASDE-X data for a single approach flown into Chicago Midway
(KMDW).
• Lateral trajectory: This box shows a top-down view of the aircraft as-flown lateral trajectory. The colored triangles indicate waypoints from RNP approach procedures available at the airport, and each color represents a different procedure. Runways are illustrated as solid black rectangles.
• Groundspeed: This box shows the aircraft groundspeed in knots as a function of time. The plot starts (t = 0) at the first available data point, and ends when the aircraft crosses the runway threshold.
Airports available for analysis (29)
• Altitude: This box shows the aircraft altitude above mean sea level in feet as a function of time. The plot starts (t = 0) at the first available data point, and ends when the aircraft crosses the runway threshold.
• Vertical Profile: This box shows the aircraft altitude above mean sea level in feet as a function of along-path distance from the runway threshold (in nautical miles). The blue dashed line indicates a reference 3-degree glidepath. The plot starts when the aircraft is 5 nautical miles away from the runway threshold on approach, and ends when the aircraft crosses the threshold.
• Glidepath Deviation: This box shows the deviation in feet from the reference 3-degree glidepath shown in the Vertical Profile box. The plotted values are calculated as the difference between the aircraft actual altitude and the reference glidepath altitude at a given distance from the runway threshold. A box in the upper right corner of this window shows the cumulative root mean square (RMS) deviation.
Each approach analyzed was labeled as either representative, outlier, or unsafe. Each approach received its designation following an analysis of glidepath tracking performance. If glidepath tracking was considered normal throughout the entire descent, the approach was labeled as representative. If glidepath tracking showed momentary excursions that were not considered dangerous, the approach was labeled as an outlier. Finally, if glidepath tracking showed excursions that were considered dangerous, the approach was labeled as unsafe.
In this study, groundspeed was not used as a parameter to gauge the stability of an approach. There were two reasons for this decision: 1) the groundspeed in the ASDE-X data is derived from the rate of change of position, and can be noisy at times. In fact, the ASDE-X system requirement for groundspeed accuracy is only ± 20 knots; 2) the groundspeed does not directly reflect the energy state of the aircraft, which is instead dictated by airspeed. Because no high-resolution data on wind speed and direction was available, it was not possible to accurately calculate airspeed from groundspeed. Therefore, although it is recognized that a stable airspeed on final approach is an important characteristic of a stable approach, this study limits its analysis of approach stability to the inspection of altitude data (i.e. vertical profile). For any future studies that necessitate reliable airspeed numbers, data from aircraft quick access recorders (QAR) or flight data recorders (FDR) would need to be obtained.
3 Radar (ASDE-X) Analysis Results
3.1 Utilization of RNP procedures
In total, 11,062 individual approaches were analyzed, of which 364 (3.29%) were identified as RNP procedures. It is important to point out that the 0.84% RNP utilization found in the first round is more representative of the average RNP utilization at the four specified airports, while the 3.29% value is biased by the fact that it was obtained with data from days when RNP procedures were known to be used. The dates analyzed for each airport are shown in Appendix
A. Among the 10,698 non-RNP approaches, two unsafe cases were identified, while none was
found among the 364 RNP approaches. Despite the fact that unsafe cases were only seen among non-RNP approaches, the results may be skewed by the much larger number of non-RNP samples. Therefore, a statistically significant safety benefit could not be claimed for RNP approaches. If an equivalent number of 10,000 RNP approaches were to be analyzed,
approximately 300,000 approaches would have to be analyzed in total when a 3% utilization rate of RNP procedures is considered.
Different airports were seen to have different utilization levels of RNP procedures, with New York JFK having the highest utilization (7.56%) on the days that were analyzed, and Seattle having the lowest (0.30%). The RNP utilization level was found to be strongly correlated with the level of RNP equipage of the fleet operating at each airport, with a higher RNP equipage rate yielding higher utilization. At JFK, JetBlue is responsible for the majority of RNP procedures flown into runway 13L, and the airline’s entire fleet is approved for RNP approaches. At MDW, Southwest drives the utilization of RNP procedures by making use of the RNP to runway 22L, a runway with no ILS approach. In the Southwest fleet, all 737NG aircraft are approved for RNP approaches. The overall breakdown of RNP utilization by airport is shown in Table 1.
Airport # of RNP appr. # of appr. (total) RNP percentage
KJFK 203 2684 7.56%
KMDW 117 1725 6.78%
KDEN 39 5003 0.78%
KSEA 5 1650 0.30%
Table 1. Breakdown of RNP procedures usage by airport.
The low utilization levels come in spite of the fact that, according to the FAA, 62% of all Part 121 aircraft currently in service are equipped for RNP AR operations. It is important to point out, however, that only half of the RNP-equipped fleet (35% of the Part 121 fleet) have sought approval for operational use of RNP AR approaches [4]. Operators that were observed to be flying RNP procedures on the days that were analyzed are shown in Table 2 below.
Airport Carriers observed flying RNP procedures
KMDW Southwest
KJFK JetBlue, American, Delta, Cathay Pacific KDEN Frontier, Southwest, United, Alaska KSEA Alaska
Table 2. Breakdown of carriers observed to be flying RNP procedures.
3.2 Anomalous approach cases
Each approach analyzed was labeled as either representative (normal), outlier, or unsafe. Each approach received its designation following an analysis of glidepath tracking performance under the following criteria:
• If glidepath tracking showed excursions exceeding 1 dot of glidepath deviation (> 0.35 degrees) below 500 ft AGL, or if at the initiation of an instrument approach the aircraft failed to capture the proper glidepath, the approach was labeled as unsafe.
• If glidepath tracking showed excursions exceeding 1 dot of glidepath deviation (> 0.35 degrees) between 1000 ft AGL and 500 ft AGL that were corrected before the aircraft reached 500 ft AGL, the approach was labeled as an outlier.
• If none of the criteria above were met, the approach was labeled as representative (i.e. normal).
Among the 11,062 approaches analyzed, 2 were identified as unsafe, and 3 were identified as outliers. The first unsafe case was a descent below glidepath during the visual segment of the VOR RWY 13L at JFK (Canarsie approach), shown below in Figure 10.
Figure 10. An unsafe case in which a Boeing 767 flying the Canarsie approach starts a descent
from the MDA while below the nominal 3-degree visual glidepath.
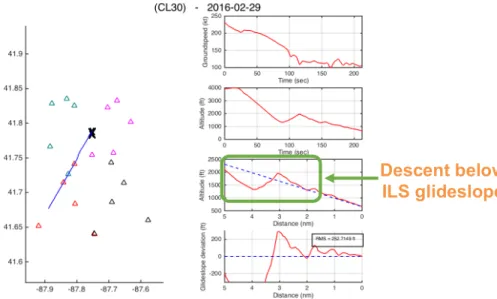
The second unsafe approach case observed was that of a Challenger 300 flying the ILS RWY 4R at MDW. In the approach, the aircraft descended 600 feet below the glideslope before starting a climb to re-intercept the glideslope (Figure 11).
Descent below visual glidepath
Figure 11. An unsafe case in which a Challenger 300 flies the ILS approach to 4R and descends
below the glideslope while 4 miles out.
It is noted that both of the unsafe cases reported above were non-RNP approaches, which might suggest a safety improvement in RNP approaches. However, it is important to note that, because of the very different sample sizes (10,698 non-RNP approaches vs. 364 RNP
approaches) caused by the low utilization of RNP procedures, statistical significance to support this conclusion was not reached.
Among the three outlier cases, which displayed momentary glidepath deviations with no safety impact, there were two RNP approaches and one visual approach. The two RNP
deviations consisted of level-offs observed during the RNP procedure descent, which is designed as a continuous descent profile with no level-offs. These are hypothesized to have occurred due to mismanagement of autopilot descent modes. The final outlier case was identified in a visual approach, in which the aircraft experienced an altitude gain of 300 feet during its base-to-final turn. Outlier cases are discussed further in subsequent sections.
3.3 Glidepath tracking performance
A comparative analysis of representative (normal) cases of RNP, ILS, and visual approaches was performed by comparing the RMS value of glidepath deviation on final approach of 60 randomly selected approaches of each type (the anomalous cases mentioned previously were excluded from this analysis). This metric, which was calculated for each of the 180 approaches,
Descent below ILS glideslope
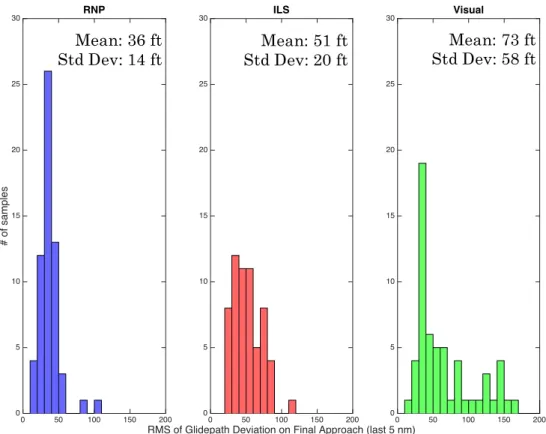
indicates the cumulative deviation from an ideal 3-degree glidepath on final approach for an individual aircraft. A histogram of the results is shown in Figure 12.
Figure 12. Histograms of RMS (cumulative) glidepath deviation for aircraft flying RNP, ILS,
and visual approaches.
RNP approaches had a mean RMS deviation of 36 ft, while the same metric was 51 ft for ILS approaches and 73 ft for visual approaches. This is consistent with the hypothesis of enhanced stability in RNP approaches. Only RNP approaches are required to be flown with an autopilot (i.e. coupled), whereas ILS approaches can either be flown with an autopilot or hand-flown, and all visual approaches are hand-flown. Therefore, the differences in glidepath deviation found for the three different approach types provide an indication of typical Flight Technical Error (FTE) values for coupled (flown with autopilot) and uncoupled (hand-flown) approaches. RNP approaches also had the lowest standard deviation from the mean, confirming the expectation of highly repeatable profiles with consistently small deviations.
A detailed discussion of the data analyzed at the four selected airports (KMDW, KJFK, KDEN, KSEA), as well as outlier and unsafe cases is given in subsequent subsections.
0 50 100 150 200 # of samples 0 5 10 15 20 25 30 RNP
RMS of Glidepath Deviation on Final Approach (last 5 nm)
0 50 100 150 200 0 5 10 15 20 25 30 ILS 0 50 100 150 200 0 5 10 15 20 25 30 Visual Mean: 36 ft
Std Dev: 14 ft Std Dev: 20 ft Mean: 51 ft
Mean: 73 ft Std Dev: 58 ft
3.4 Discussion of approaches
This section presents a discussion of the stability of various approach procedures identified at the four selected airports. For each approach type being discussed, sample plots of
representative approaches are shown, as well as any outlier and unsafe cases.
3.4.1 Approaches at Chicago Midway (KMDW)
As summarized in Table 1, a total of 1725 approaches were analyzed, where 117 of these were identified as RNP AR approaches (6.78%). The higher than average use of RNP AR approaches at MDW can be attributed to the use of the RNAV (RNP) X procedure for runway 22L. This is in part due to the fact that runway 22L has no ILS and because MDW is
predominantly used by Southwest Airlines, which has all of its Boeing 737NG fleet equipped for RNP AR approaches. When runway 22L is used for arrivals, non-RNP aircraft are usually vectored for either a visual approach or for the RNAV (GPS) Z RWY 22L.
Among the 1725 approaches reviewed at MDW, one was identified as unsafe, and two were identified as outliers. The following subsections discuss the stability of aircraft flying specific approach procedures at KMDW.
3.4.1.1 RNAV (RNP) X RWY 22L
Aircraft flying this approach predominantly showed very precise tracking of the approach profile. The approach is easily recognizable by the use of RF legs (constant-radius turns) and the constant descent from 4000’ along a 3-degree glidepath. In the approximately 100 RNP
approaches to runway 22L observed, overall approach stability was excellent. A representative case is illustrated in Figure 13. Additional plots of aircraft flying this approach can be found in
Appendix B. As can be seen, the lateral tracks and vertical profiles show very high repeatability
Figure 13. A representative case of an aircraft (a Boeing 737-700) flying the RNAV (RNP) X
RWY 22L at MDW.
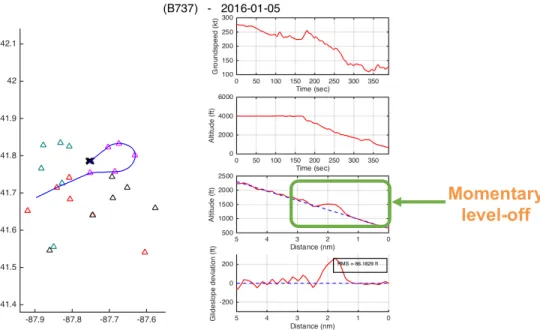
In the outlier case displayed below, a Boeing 737-700 flying the same procedure had its descent interrupted at 1500’ at the final approach fix. The approach was labeled an outlier due to the aircraft being more than “one dot” away from glidepath at 1000 ft AGL.
Figure 14. An outlier case showing a Boeing 737-700 leveling off monetarily at 1500 feet while
flying the RNAV (RNP) X RWY 22L.
Momentary level-off
A hypothesis explaining the momentary level-off at 1500’ is that the altitude selector in the Mode Control Panel (MCP), which gives inputs to the autoflight system, was set to 1500’ (the altitude constraint at the final approach fix) early in the approach, and not changed to the procedure MDA as the aircraft approached the final approach fix. In this case, due to the nature of the VNAV mode used for an RNP approach in the Boeing 737NG, the aircraft would have leveled off at the MCP altitude of 1500’ instead of continuing its descent along the computed VNAV path. In this case, the VNAV mode, which is used to guide the aircraft along the vertical profile of an RNP procedure, acts differently from the APPR (approach) autoflight mode used in ILS approaches in the 737, which are more commonly flown by crews.
While on an ILS approach with the APPR mode engaged instead, the autoflight system ignores any altitude selected in the MCP, and continues to descend along the glideslope regardless of whether MCP-selected altitudes have been reached. This difference in how the APPR and VNAV modes treat vertical navigation on an instrument approach might create room for confusion, as a crew may inadvertently apply their mental model of the APPR mode when flying RNP approaches with the VNAV mode instead. In such an event, crews might be faced with unexpected level-offs as the aircraft reaches altitudes that had been previously entered in the MCP altitude selector. Such a level-off would be consistent with that observed in Figure 14. 3.4.1.2 Visual Approach RWY 22L
Visual approaches to runway 22L were very common on the days that were analyzed. Because the only other instrument approach to runway 22L besides the RNP approach is the RNAV (GPS) Z, it is easy to identify a visual approach by observing the length of the final approach segment (the RNAV GPS approach requires a minimum final approach segment of 5.5 nautical miles, whereas aircraft flying a visual approach will usually fly a base leg well within a 5-mile radius of the airport). The RNAV GPS final approach segment is also offset from the runway extended centerline by 10 degrees, which further helps with differentiating approach types.
Figure 15. Representative cases of aircraft flying visual approaches to runway 22L on different
days. Notice the variability in lateral trajectories and vertical profiles.
As can be seen in Figure 15, visual approaches do not show the same consistency and repeatability of flight trajectories as RNP approaches due to the use of ATC vectors. In most cases, they also include step-down descents instead of a continuous 3-degree descent as seen in the RNP case. Tracking of a 3-degree glidepath on final approach was observed to be good, albeit generally less precise than the tracking observed in RNP approaches, as expected. A side-by-side comparison of trajectories flown by aircraft in RNP and visual approaches is shown in
Appendix C. Among the set of visual approaches, the case shown in Figure 16 below was the
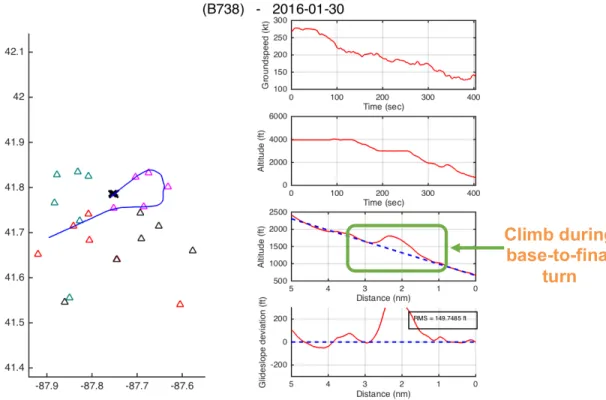
Figure 16. An outlier case showing a Boeing 737-700 on a visual approach to runway 22L
climbing during a turn to final.
In this case, a Boeing 737-800 climbs about 300 feet during its base-to-final turn in a visual approach to runway 22L. It then proceeds to recapture the nominal 3-degree glidepath at a distance of 1 nautical mile from the runway threshold. The approach was labeled an outlier due to the aircraft being more than “one dot” away from glidepath at 1000 ft AGL. Due to the shallow rate of climb leading to the maximum glidepath deviation, the climb likely happened during a time when the aircraft was being hand-flown during its turn-to-final. The glidepath was recaptured within a mile of the runway threshold, and safety was not affected.
3.4.1.3 ILS RWY 4R
When the winds favor operations on runways 4L/R, the ILS for runway 4R is the approach of choice at MDW. Like RNP approaches, ILS offers onboard vertical guidance in the form of a glideslope. As discussed in Section 2, one key difference between RNP approaches and ILS approaches is that the latter usually requires the aircraft to be vectored to an intercept course from its original arrival path. RNP approaches, on the other hand, are usually connected to arrival routes via waypoints, meaning there is continuous lateral and vertical guidance provided by the flight management system (FMS).
Climb during base-to-final
The average ILS approach to runway 4R showed excellent tracking of the localizer and glideslope on final approach, as illustrated by the plot in Figure 17 below. Additional plots of aircraft flying this approach can be found in Appendix D.
Figure 17. A representative case of an aircraft (a Boeing 737-700) flying the ILS RWY 4R at
MDW.
One case that stood out from the rest, and which was flagged as unsafe, was an approach to 4R by a Challenger 300 followed by a side-step to runway 4L. In this approach, shown in Figure
18, the aircraft descends 600 feet below the glideslope before initiating a climb to recapture the
3-degree glidepath. The approach was labeled as unsafe due to the aircraft’s failure to capture the proper instrument procedure glidepath upon initiation of the approach.
Figure 18. An unsafe case showing a Challenger 300 descending well below the glideslope
while 4 miles out on the ILS for 4R.
The radar data alone gives us no explanation of what may have caused this event, but it is hypothesized that the crew identified and corrected the error after receiving a “Glideslope” warning from the aircraft’s EGPWS. Such warning is triggered when, on an ILS approach, the aircraft is 1.3 dots or greater below glideslope while below 1000 ft AGL. In this approach, the aircraft is seen to start a climb back to glideslope when at approximately 800 ft AGL and 1 degree below glideslope (greater than 1.3 dots deviation). Therefore, the conditions for an EGPWS “Glideslope” warning would have been met and an aural warning would have sounded in the cockpit. Ultimately, this event portrays a case in which the availability of positive vertical guidance (the glideslope) did not prevent a crew from losing situational awareness on approach.
If it is assumed that the aircraft was vectored to the ILS approach (as was most likely the case), then the crew was likely given simple headings and altitudes to follow in order to intercept the localizer and glideslope. In such scenario, no onboard guidance existed during the time the airplane was being vectored, and the crew was responsible for transitioning to ILS guidance once the proper signals (localizer and glideslope) were received. In an RNP approach, the crew would have been provided continuous onboard guidance during the transition from the arrival
environment to the approach environment. Despite these differences, it is not possible to
Descent below ILS glideslope
conclude whether the use of RNP could have prevented the deviation as it is impossible to determine the exact circumstances of this event from radar data alone.
3.4.1.4 Approaches at New York JFK (KJFK)
As summarized in Table 1, a total of 2684 approaches were analyzed at JFK, where 203 of these were identified as RNP AR approaches (7.56%). The higher than average use of RNP AR approaches at JFK can be attributed to the use of the RNAV (RNP) procedure for runway 13L. At JFK, the Canarsie approach (VOR RWY 13L) is used to deconflict traffic from LaGuardia and JFK and to provide noise abatement over populated areas. This procedure requires a visual turn at low altitude (~500 ft), and historically has been the primary procedure used at JFK when winds favor the use of runway 13L. Today, the RNP approach for 13L, which mimics the path of the Canarsie, has become the approach of choice for RNP-equipped carriers. Not only does it provide the ability of having the turn-to-final flown by the autopilot, but it also offers lower approach minimums than the VOR procedure (500 feet AGL versus 800 feet AGL). The high usage of this RNP procedure can be explained by two factors: first, the procedure’s trajectory matches that of the alternative VOR procedure flown by non-RNP aircraft, which relieves the approach controller from dealing with mixed equipage. Second, carriers such as JetBlue have equipped their entire fleet for RNP AR approaches and can therefore be assigned the procedure by ATC instead of having to make a request on a flight-by-flight basis. JetBlue claims that its pilots used the RNP procedure 97.8% of the time in 2015 (equivalent to 5,939 RNP approaches) whenever runway 13L was the arrival runway [5].
Among the 2684 approaches reviewed at JFK, one was flagged as identified as unsafe, and one was identified as an outlier. The following subsections discuss the stability of aircraft flying specific approach procedures at KJFK.
3.4.1.5 VOR RWY 13L
The VOR approach to runway 13L at JFK, also known as the Canarsie approach, is a famous instrument approach requiring a 90-degree turn at low altitude during its visual segment. Although runway 13L is equipped with an ILS, the Canarsie approach helps deconflict traffic from JFK and LaGuardia (LGA) and therefore increases the capacity of the New York
Figure 19 below shows a representative case of an aircraft flying the Canarsie approach in
its most traditional way: a descent to the MDA of 800 feet followed by a level-off and a visual descent to the runway.
Figure 19. A representative case of an aircraft flying the Canarsie approach for runway 13L at
KJFK. Notice the level-off at the MDA of 800 feet.
Altogether, the descent profiles of aircraft flying the Canarsie approach generally show a larger degree of variability than other approaches analyzed in this study. Reasons for this variability include differences in pilot technique in the visual segment of the approach and differences in aircraft avionics, which translate into different levels of situational awareness among crews. A few additional approach plots that highlight the different vertical profiles flown by different crews are shown in Appendix E.
One instance of the Canarsie approach was flagged as unsafe. In this case, a Boeing 767 flying the approach (Figure 20) initially leveled off at the MDA of 800 feet, but started its descent from the MDA while still below the 3-degree visual glidepath. The approach was labeled as unsafe due to the aircraft being more than “one dot” away from glidepath at 500 ft AGL. The aircraft reached a maximum glidepath deviation of 200 feet in the visual segment of the
approach, while 1.5 nautical miles from the runway threshold. The descent profile was later corrected. At that time, the crew would have seen the VASI/PAPI as “all red.” This case
illustrates a potential safety benefit that could be had from the availability of onboard vertical guidance in a procedure that requires a turn in the final approach segment. With the exception of the Microwave Landing System (MLS), no other instrument approach other than RNP is able to provide vertical guidance when the procedure includes a low-altitude turn such as the one seen in the Canarsie.
Figure 20. An unsafe case in which a Boeing 767 starts a descent from the MDA while below
the glidepath. 3.4.1.6 RNAV (RNP) RWY 13L
The RNP approach to runway 13L is a relatively new procedure that mimics the traditional Canarsie approach, but that adds extra RNP features such as precise lateral and vertical guidance. The procedure can be flown in instrument meteorological conditions (IMC) whenever the ceiling is higher than 500 feet. According to the FAA, the procedure usage increased from 30.6% in 2014 to 65.3% in 2015 for times when runway 13L is the active runway at JFK. This is a much higher usage rate than other RNP procedures evaluated in this study, most likely due to the fact that the lateral trajectory of the RNP to 13L matches that of the alternative procedure available to non-RNP equipped aircraft (VOR RWY 13L) almost exactly. This means that little to no extra workload is required on the part of the approach controller to sequence aircraft flying the two
Descent below visual glidepath
different procedures. This is most often not the case at other airports, as seen by the fact that RNP approaches with RF legs at Chicago Midway (MDW) and Seattle (SEA) have specific lateral trajectories that do not match those of any non-RNP approaches.
Aircraft flying the RNP to 13L generally flew smoother approaches with significantly better tracking of the 3-degree glidepath. Since the RNP approach employs a continuous descent from 3000 feet MSL to the ground (~0’ MSL), no level-offs are observed. Figure 21 below shows a representative case of an aircraft flying the RNP to 13L. More plots are shown in Appendix F.
Figure 21. A representative case of an aircraft flying the RNP approach for runway 13L at
KJFK. Notice the continuous descent from 3000 feet.
All RNP approaches showed extremely repeatable flight profiles, as seen in the plots above. In one case, an Embraer ERJ 190 seemed to level off momentarily at 1300 feet while flying the approach (Figure 22). The approach was labeled an outlier due to the aircraft being more than “one dot” away from glidepath at 1000 ft AGL. Since the approach has a continuous descent profile, this behavior is unexpected and is very similar to the one observed in Figure 14 at Chicago Midway (MDW). The same hypothesis discussed in the MDW case applies here: if the autopilot altitude selector in the guidance panel was set to 1300 feet and not changed as the aircraft approached that altitude, the aircraft would have captured the selected altitude instead of continuing its VNAV descent. In the approach chart, there is indeed an altitude crossing
restriction of 1374 feet at the waypoint WIRKO. Ultimately, no increase in risk is thought to have occurred as the aircraft was once again following the nominal glidepath at 1000 feet AGL.
Figure 22. An outlier case in which a ERJ 190 flying the RNP approach to 13L levels off
momentarily at 1300 ft.
3.4.2 Approaches at Denver (KDEN)
As summarized in Table 1, a total of 5003 approaches were analyzed at DEN, where 39 of these were identified as RNP AR approaches (0.78%). The low usage of RNP AR procedures comes in spite of the fact that data reported by the FAA suggests that RNP utilization at DEN represents 6.6% of all arrivals. It is therefore possible that a large variation in daily utilization of RNP procedures at the airport exists, although this was not further investigated. Operators that used these procedures on the days that were analyzed included Frontier Airlines, Southwest Airlines, United Airlines, and Alaska Airlines. It was noticed that RNP AR procedures were used mainly at times of little to no terminal congestion. In all other situations, air traffic control
generally relied on vectors to an ILS approach. No anomalous approaches were identified in all of the 5003 approaches that were analyzed. The following subsections discuss the stability of aircraft flying specific approach procedures at KDEN.
Momentary level-off
3.4.2.1 ILS Approaches
Denver has 12 runway ends, and each one is served by one or more ILS approaches.
Because no significant differences exist among the different ILS approaches, they are all grouped in this section.
In the 12 days of data that were analyzed for DEN, all aircraft using ILS approaches were stable on final approach and there were no anomalies to report. Vectors to an ILS approach were found to be the primary method by which approach controllers managed arriving traffic (visual and ILS approaches together represented 99% of all approaches). Figure 23 below shows a representative case of an aircraft flying an ILS approach at Denver. Additional plots are shown in
Appendix G.
Figure 23. A representative case of an aircraft flying an ILS approach at Denver.
3.4.2.2 RNAV (RNP) Approaches
Every runway at Denver has a published RNP approach. Because no significant differences exist among the different RNP approaches, they are all grouped in this section.
In the 12 days of data that were analyzed for DEN, all aircraft using RNP approaches were observed to be stable on final approach and there were no anomalies to report. RNP approaches were fairly rare, and accounted for only 39 of the total 5003 arrivals analyzed (0.78%). The
figure below shows a representative case of an aircraft flying an RNP approach at Denver. Additional plots are shown in Appendix H.
Figure 24. Representative cases of RNP approaches at Denver.
3.4.3 Approaches at Seattle (KSEA)
As summarized in Table 1, a total of 1666 approaches were analyzed at SEA, where 5 of these were identified as RNP AR approaches (0.30%). The low usage of RNP AR procedures comes in spite of Seattle having been the stage for the “Greener Skies” project, in which the FAA partnered with Alaska Airlines and Horizon Air to prove the benefits of RNP AR
approaches through flight trials. Despite positive results showing reduced fuel burn for the airline and shorter flight times, this study indicates that these RNP procedures have not been fully adopted operationally since the end of the Greener Skies project. Operators that used the RNP procedures on the days that were analyzed included Southwest Airlines, Horizon Air, and Alaska Airlines. No anomalous approaches were identified in all of the 1666 approaches that were analyzed. The following subsections discuss the stability of aircraft flying specific approach procedures at KSEA.
3.4.3.1 ILS Approaches
In the eight days of data that were analyzed for SEA, all aircraft using ILS approaches were stable on final approach and there were no anomalies to report. Vectors to an ILS approach were found to be the primary method by which approach controllers managed arriving traffic (visual and ILS approaches together represented 99.7% of all approaches). Figure 25 below shows a representative case of an aircraft flying an ILS approach at Seattle.
Figure 25. A representative case of an aircraft flying an ILS approach at Seattle.
3.4.3.2 RNAV (RNP) Z RWY 16C/R
In the eight days of data that were analyzed for SEA, only five aircraft (0.30%) were seen to fly RNP procedures, and they all flew the RNAV (RNP) Z for either runway 16C or runway 16R. Figure 26 below shows a representative case of an aircraft flying the RNAV (RNP) Z RWY 16R approach at Seattle.
4 Challenges in Operational Implementation of RNP Approach
Procedures
Because of their unique requirements and capabilities, RNP approaches face unique
implementation barriers that may have contributed to the low utilization of these procedures. As a result of the low utilization, many of the benefits expected from the investment in RNP have not been fully realized, such as lower fuel burn to operators due to shorter path length in procedures with RF legs. Therefore, as a step towards realizing the benefits of RNP, it is useful to identify and mitigate implementation barriers.
Operational implementation of RNP procedures is dependent on three main stakeholders: the FAA (from a regulatory standpoint), operators, and Air Traffic Control (ATC). Each stakeholder faces unique challenges in adapting to the concept of operations introduced by RNP. For
instance, operators must equip their aircraft with new hardware and software in order to use RNP approaches, and ATC must be able to accommodate aircraft flying predetermined 3D trajectories in the terminal airspace.
Figure 27. Barriers to operational implementation of RNP stem from challenges faced by
individual stakeholders.
The next few sections of this thesis will focus on identifying the challenges affecting each of the stakeholders mentioned above, which directly impact the degree to which RNP procedures are utilized across the NAS. Mitigation strategies being developed to accelerate the adoption of
RNP and PBN procedures across the NAS are then introduced, as are cases of successful RNP implementation.
4.1 Barriers to Operational Use of RNP
At the time of writing of this thesis (2017), 35% of all Part 121 aircraft in the United States were approved for RNP operations. Notwithstanding, daily utilization of RNP AR approach procedures was much lower than the approval level, and ranged from 0.3% to 7% at the airports analyzed in an earlier section of this thesis (KJFK, KMDW, KDEN, and KSEA). The following subsections describe the main barriers to widespread adoption of RNP in everyday operations.
4.1.1 ATC barriers
When vectoring traffic for an ILS final approach, controllers typically employ in-trail vectoring to achieve the desired separation between arriving aircraft. This consists of vectoring aircraft in the trail of other aircraft, thus reducing the separation problem to a single dimension. The diagram below illustrates a common case of vectoring aircraft through a “downwind leg” before issuing a turn-to-final vector.
Figure 28. Illustration of in-trail vectoring for parallel runway approaches.
In the case illustrated in Figure 28, the approach controller is able to keep aircraft
sequenced with two main control strategies: by issuing speed commands, and by commanding when aircraft should turn to intercept the final approach. By commanding the turn-to-final, the approach controller is able to either extend or shorten an aircraft’s “downwind leg” on the
approach in order to meet spacing requirements on the final approach. The image below shows actual radar data from Chicago O’Hare, in which in-trail vectoring can be observed. Aircraft labeled in cyan are arriving aircraft, and can be clearly seen being vectored in trail of other aircraft.
Figure 29. Aircraft being vectored on approach to Chicago O’Hare (cyan). Source: FlightAware.
The yellow arrow in Figure 29 points to an aircraft that had its downwind leg extended by the approach controller in order to satisfy spacing requirements on the final approach. The red arrow points to aircraft that received an early turn-to-final vector. By vectoring aircraft,
controllers have control over where turns-to-final are made, and therefore are able to manually meter the traffic merging into the final approach.
In RNP approaches with RF legs, the procedure itself often prescribes a “downwind leg” followed by an RF turn-to-final at a predetermined position. In this case, the aircraft is cleared for the instrument approach while still on the downwind leg, meaning that vectoring (beyond speed restrictions) cannot occur without removing the aircraft from its RNP approach.
Late turn-to-final vector
Figure 30. The RNP Z RWY 16R at KSEA (Seattle) prescribes a turn-to-final at a specific
location along the “downwind leg” of the procedure (red circle).
Therefore, when using RNP AR approaches with RF legs, approach controllers lose the ability to extend or shorten an aircraft’s downwind leg, which results in fewer degrees of
freedom by which the controller is able to sequence the arriving traffic. This is comparable to the loss of tactical state control in RNAV CDA arrivals discussed by Reynolds et al. [6], and has similar implications on controller workload. In a mixed equipage environment where only part of the arriving traffic is able to fly RNP procedures, clearing RNP aircraft to fly an RNP approach at the same time as non-RNP traffic are vectored for a different approach can therefore present a significant challenge to the controller. In such a scenario, RNP aircraft will always make their turns to final at the same location, while non-RNP aircraft must be vectored to intercept their final approach. Because the two approach streams composed of RNP and non-RNP aircraft will not necessarily be flying in trail of each other, merging them in the same final approach segment presents a spacing challenge. By listening to approach control frequencies, multiple controller-pilot transmissions that pointed to the hesitancy on the part of some approach controllers to clear an aircraft to fly an RNP approach were identified, such as the following: “Alaska 321, cleared RNAV M RWY 16R approach. Looking good with spacing right now, we’ll let you know.”
Ultimately, given the difficulty of sequencing both RNP and non-RNP traffic at the same time using legacy air traffic control procedures, terminal controllers often prefer when aircraft are flying the same approach procedure. Because a visual or an ILS approach preceded by vectors can be flown by all commercial aircraft, they take precedence over an RNP approach as the common denominator. This ultimately results in low utilization of RNP procedures, which often have their use restricted to times of low demand.
4.1.2 Operator barriers
Because RNP AR approaches offer reduced lateral obstacle evaluation areas that are predicated on specific aircraft and aircrew performance requirements, they require special authorization similar to Category II and Category III ILS approaches. Operator guidance for approval to use RNP AR procedures is provided by FAA Advisory Circular 90-101A in the United States. The requirements for authorization apply to both the aircraft and the operator, and are discussed next.
4.1.2.1 Aircraft qualification
The most critical aircraft component required for RNP AR authorization is the ability of the aircraft navigation system to both monitor navigation performance and alert the pilot when RNP requirements are not being met. The monitoring of real-time navigation performance involves the calculation of the aircraft’s Actual Navigation Performance (ANP), which is an estimate of the Navigation System Error (NSE). The NSE is equivalent to the distance between the aircraft’s estimated position and its actual position.
RNP AR approaches can require an RNP value of 0.3 or lower, with the lowest possible value being 0.1. The aircraft manufacturer must demonstrate the aircraft’s ability to meet its lowest possible RNP value, and upon certification this value is recorded in the Airplane Flight Manual (AFM). Approaches requiring an RNP value lower than that recorded in the AFM may not be flown, and approaches with a higher RNP value may be attempted if the actual
performance at the time of the operation, as indicated by the ANP value, meets or exceeds the RNP requirement (i.e. ANP < RNP). If RF legs are to be used, the avionics must also have the ability to display curved segments in a navigation display, and the aircraft must be equipped with a roll steering autopilot (AP) and flight director (FD).
Although new aircraft purchased by airlines today are almost always equipped with the systems required to fly RNP AR procedures, older aircraft in the fleet often do not have the necessary equipment and require retrofits. According to a study by the NextGen Advisory Committee (NAC), a retrofit to equip older aircraft to fly RNP AR procedures can cost up to $750,000 per aircraft [8]. Operators have voiced concerns about the high cost of retrofitting older aircraft in light of the current realized benefits of RNP, with American Airlines calling retrofit options for some of the types in its fleet prohibitively expensive. Similarly, the high cost associated with the certification process to authorize an aircraft to fly RNP approaches has