Can the Phased Array Stimulation Strategy be Implemented
Using the Advanced Bionics Cochlear Implant?
by
Matthew V. Crema
B.S. Biomedical Engineering
Boston University, 1998
SUBMITTED TO THE HARVARD-MIT DIVISION OF
HEALTH SCIENCES AND TECHNOLOGY
IN PARTIAL FULFILLMENT OF THE REQUIREMENTS FOR THE DEGREE OF
MASTER OF SCIENCE IN HEALTH SCIENCES AND TECHNOLOGY
AT THE
MASSACHUSETTS INSTITUTE OF TECHNOLOGY
SEPTEMBER 2016
0 2016 Massachusetts Institute of Technology. All rights reserved.
Signature of Author:
Certified by:
Signature redacted
Harvard-MIT Division of Health Sciences and Technology
Program in Speech and Hearing Bioscience and Technology
r\ September 6, 2016
Signature redacted
Donald K. Eddington, Ph.D.
Director, Cochlear Implant Research Laboratory, Massachusetts Eye & Ear Infirmary
Associate Professor of Otology and Laryngology and Health Sciences and Technology
Thesis Supervisor
Accepted by:
Signature redacted
Emery N. Brown, MD, Ph.D.
Directo,arvard-MIT Program in Health Sciences and Technology
Professor of Computational Neuroscience and Health Sciences and Technology
OF TECHNQL0GY
OCT
lI1
2161
LIBRARIES
ArCniFS
Can the Phased Array Stimulation Strategy be Implemented
Using the Advanced Bionics Cochlear Implant?
by
Matthew V. Crema
Submitted to the Harvard-MIT Division of Health Sciences and Technology on September 6, 2016 in Partial Fulfillment of the
Requirements for the Degree of Master of Science in Health Sciences and Technology
ABSTRACT
Cochlear implants are devices that aim to restore a measure of hearing to the deaf by converting acoustic signals to electric stimuli delivered to electrodes implanted in the inner ear. Theoretically, the phased array stimulation strategy described by van den Honert and Kelsall (2007) provides much better control over the neural excitation patters elicited by electric stimulation by taking advantage of potential field superposition in the implanted cochlea, to construct stimuli for optimally selective excitation of auditory nerve fibers.
If the phased array strategy can be implemented using a commonly-implanted commercial
cochlear implant system, the strategy could be effectively evaluated in a relatively large sample of patients to determine whether it provides better speech reception than currently available systems. This thesis investigates whether the phased array strategy can be implemented using the Advanced Bionics Clarion CH or HiRes90k cochlear implant.
It is shown that for realistic cochlear implant electrode impedance magnitudes, the Advanced Bionics cochlear implant current sources will deliver monopolar current suitable for the necessary measurement of transimpedance with less than 7% error.
Transimpedance matrix estimates were obtained in 11 ears in 10 cochlear implant subjects. Measurements reveal that in some test subjects, low impedance current paths exist between implanted electrodes that may cause current leakage through unintended electrodes. Researchers and clinicians should consider using this transimpedance matrix estimation technique to screen for patients or research subjects who could benefit from compensatory changes to their speech processors.
The results of this thesis suggest that the phased array strategy can be implemented successfully when the limitations of the internal power supply documented in this document are taken into account. It is recommended that the transimpedance matrix in a given test subject be measured on the day of any psychophysical testing because of the potential impact of variability in transimpedance over time.
Thesis Supervisor: Donald K. Eddington
Acknowledgements
I would like to thank Professor Donald K. Eddington for his guidance throughout this
project. I also acknowledge the scientific contributions of Victor Noel. I thank the
research subjects for their time and efforts, and for often arriving at the lab in the
evenings after work.
I am grateful to have had the loving support of my family throughout this process,
especially Dee Dee, Rosco, Levon, and Maggie Crema. I am grateful for the support
of my parents Matthew and Barbara Crema, Jack and Amy Ives, Doug and Laura
Kokanovich, as well as Gregory Crema, Angela Benefiel, Anthony Crema and Kristen
Franzese.
I wish dedicate this work to the memory of Victor and Carmella Crema, Frank and
Grace Barker, Margaret Anderson, Valdeva Burnham, David Mountain, Kevin
MacKinnon and David Alling.
Table of Contents
I
B ackground and Significance ... 131.1 C ochlear Im plants ... 13
1.2 Design Considerations for Speech Coding in the Auditory Nerve ... 15
1.2.1 Speech Recognition Requires a Neural Representation of Spectral Shape... 16
1.2.2 Conveying Spectral Shape Information by Restoring the Place Code...16
1.2.3 Conventional Sound Processing in Cochlear Implants ... 17
1.3 Performance With Cochlear Implants Needs Improvement ... 21
1.4 Identifying Limitations on Speech Recognition in Cochlear Implant Listening .. 22
1.4.1 Potential Sound Processor-Related Limitations (Friesen et al., 2001)...22
1.4.2 Potential Implantee-Related Limitations (Litvak et al., 2007b)...26
1.5 Hypothesis: Poor Spatial Selectivity Limits Spectral Resolution...29
1.5.1 Evidence for Broad Excitation Relative to Electrode Spacing ... 30
1.5.2 Channel Interactions Reduce Spectral Shape Information...33
1.5.3 Effects of Channel Interaction on Speech Reception...39
1.6 "Current Focusing" Methods to Improve Spatial Selectivity ... 41
1.6.1 Current Focusing: Previous W ork ... 41
1.6.2 Phased Array Stimulation (van den Honert & Kelsall, 2007)...44
1.7 Principles of Phased Array Stimulation ... 45
1.7.1 Transimpedance Relates Electrode Currents to Scala Tympani Voltages .... 45
1.7.2 Computation of Phased Array Currents Using the Transimpedance Matrix 47 1.8 S u m m ary ... 50
2 Advanced Bionics Hardware Characterization ... 53
2.1 Rationale for Choice of Advanced Bionics CII and HiRes90k Devices...53
2.2.2 Im planted Com ponents ... 56
2.3 CII/HiRes90k ICS Hardware Characterization...59
2.3.1 CII/HiRes9Ok Laboratory Bench Setup: The Clarion Research Interface .... 60
2.3.2 Electric Circuit Models for CII/HiRes9Ok Current Sources ... 62
2.3.3 Measurements and Analysis of a Single Current Source in One Device...69
2.3.4 Evaluation of 16 Current Sources in One Device...84
2.3.5 Measurements and Analysis of Simultaneous Stimulation (All Sources) .... 87
2.3.6 Comparison of Voltage Compliance for Single vs. All-Source Stimulation 90 2.3.7 Current Source Performance for a Realistic Load (Electrodes in Saline)...94
2.3.8 Performance of Telemetry System...96
2 .4 S um m ary ... 98
2.4.1 Monopolar Stimulation and Transimpedance Estimation...98
2.4.2 Recording Voltage with Telemetry System...99
2.4.3 Use of the CII/HiRes9Ok for Phased Array Stimulation...100
3 Transimpedance Estimates and Implications for Phased Array Stimulation...101
3 .1 M ethod s ... 10 2 3.1.1 R esearch Subjects ... 102
3.1.2 Estimation of Transimpedance Matrices in Cochlear Implant Subjects ... 102
3.1.3 The Inverse Transimpedance Matrix and Phased Array Stimulation ... 109
3.1.4 Assessing the Impact of Variability in Transimpedance Matrices...110
3 .2 R esu lts... 1 12 3.2.1 Representative Measurements of vn, k in One Ear (C223, Left)...112
3.2.2 Transimpedance Matrix for Subject C223 Left Ear Measured at 25 pVA .... 121
3.2.4 Effect of Stimulus Level on Transimpedance Matrix for C223 Left Ear.... 128
3.2.5 Variability in Transimpedance Matrix Over Time for C223 Left Ear...130
3.2.6 Inverse Transimpedance Matrix for Subject C223 (Left)... 131
3.2.7 Transimpedance Data Across Subjects ... 137
3.2.8 Impact of Across Subject Variability on Phased Array Stimuli ... 145
3 .3 D iscu ssion ... 14 8 3.3.1 Measurements of Electrode Voltages During Monopolar Stimulation...148
3.3.2 A typical Electrode Pairs ... 148
3.3.3 Transim pedance M atrices ... 149
3.3.4 Transimpedance is a Nonlinear Function of Stimulus Amplitude ... 150
3.3.5 Variability With Time and Phased Array System Implementation ... 151
4 Summary and Recommendations for Future Work ... 153
5 Appendix: Analysis of CII/HiRes9Ok ICS Current Source with Resistive Load.... 155
5.1 Simplified Circuit M odel with Resistive Load ... 157
5.2 Derivation of State Differential Equation for vCBt... 158
5.3 Expressions for vCBt, ILoadt and vOt for a Current Step Input... 159
5.3.1 Step Response with Initially Uncharged Capacitor ... 160
5.3.2 Short-Time Approximations of vCBt, ILoadt and vOt for a Step Input .161 5.3.3 Short-Time Approximation of Step Response with Uncharged Capacitor. 162 5.3.4 Plots of Exact Solutions and Short-Time Approximations...163
5.3.5 Validity of Short-Time Approximations of vCBt, ILoadt and vOt... 165
5.4 Expressions for vCBt, ILoadt and vOt for a Biphasic Pulse Input ... 168
5.4.1 Cathodic-Leading Biphasic Pulse Response with Uncharged Capacitor.... 169
5.4.2 Plots of Exact Solutions for vCBt, ILoadt and vOt... 171
5.5 Sum m ary ... 176 5.5.1 Note on the Ideal Current Source M odel ... 177
Table of Figures
Figure 1-1: A Typical Cochlear Implant ... 14
Figure 1-2: A Cochlear Implant Sound Processor... 18
Figure 1-3: Cochlear Implant Patient Performance... 21
Figure 1-4: Stimuli for Spectral Modulation Detection Experiment...27
Figure 1-5: Conceptual Model for Simultaneous Channel Interaction...36
Figure 1-6: System Representation -Electrode Currents to Scala Tympani Voltages...46
Figure 1-7: Monopolar vs. Phased Array Stimulation at Electrode Position 8 ... 49
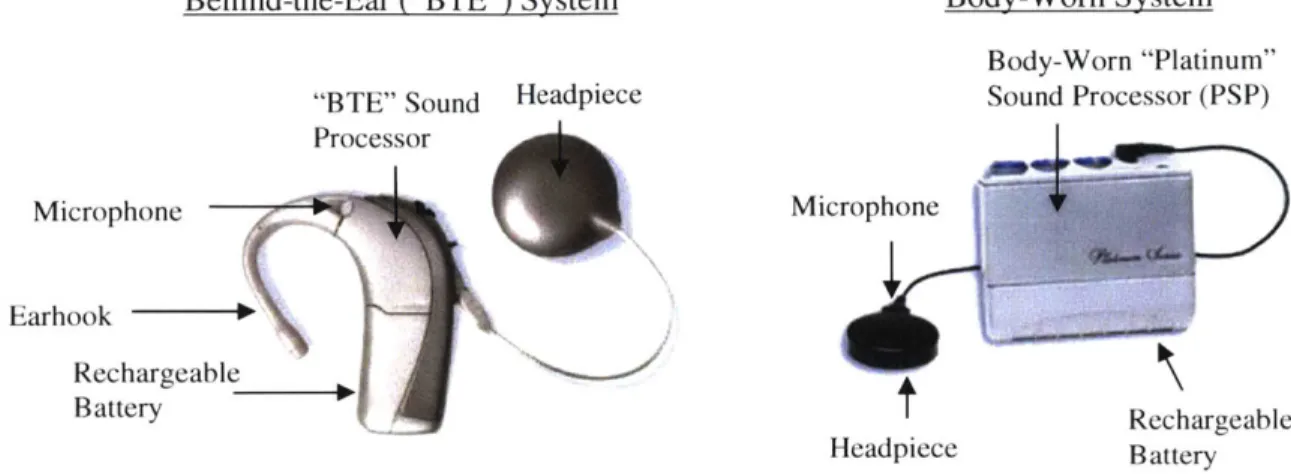
Figure 2-1: CII/HiRes9Ok External Components ... 56
Figure 2-2: CII/HiRes9Ok Implanted Components ... 57
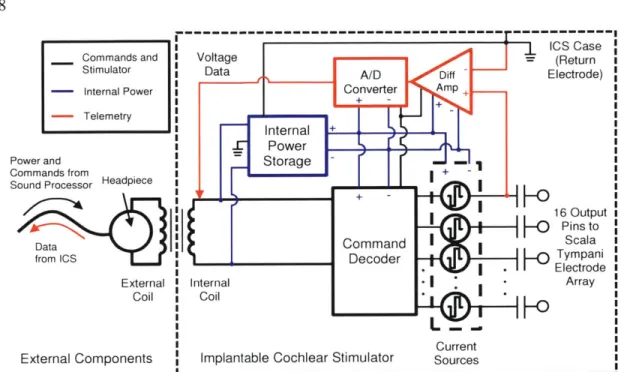
Figure 2-3: CII/HiRes9Ok Implantable Cochlear Stimulator ... 58
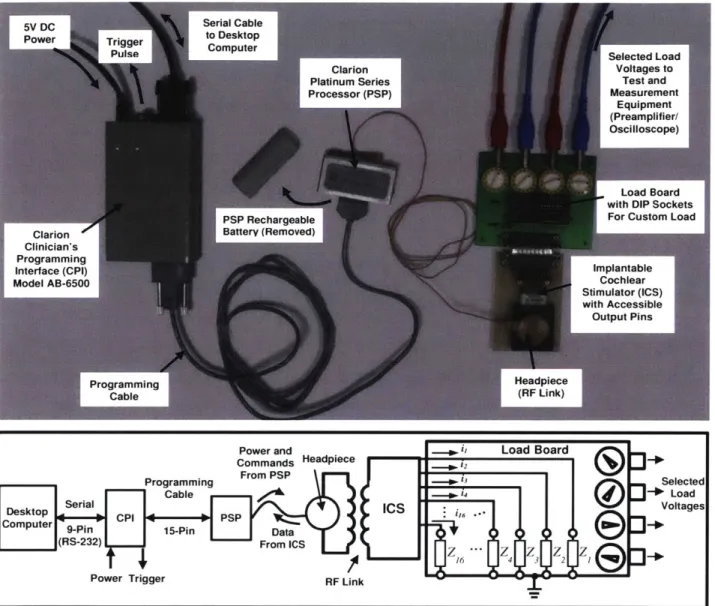
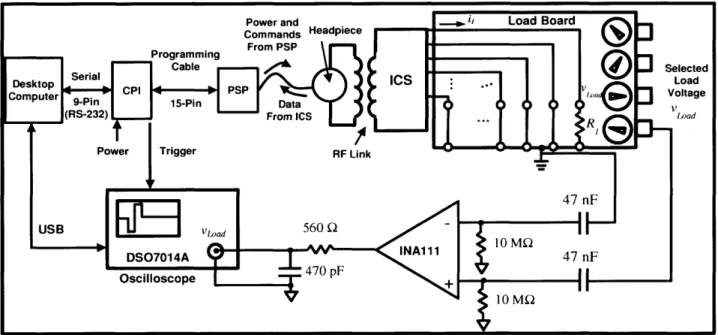
Figure 2-4: Experimental Setup -The Clarion Research Interface ... 61
Figure 2-5: Ideal CII/HiRes9Ok Current Source ... 63
Figure 2-6: Realistic CII/HiRes9Ok Current Source ... 64
Figure 2-7: Experimental Setup for Measurement of Load Voltage ... 69
Figure 2-8: Fixed Amplitude Waveform Delivered to Various Load Resistors...71
Figure 2-9: Waveforms Delivered to Fixed Load Resistor as Current Varied...77
Figure 2-10: Voltage and Current Delivered as a Function of IRequested...80
Figure 2-11: Determining Current Source Dynamic Range...82
Figure 2-12: Current Delivered as a Function of IRequested Across 16 Sources...85
Figure 2-13: Setup for Load Voltage Measurement under Simultaneous Stimulation ... 88
Figure 2-14: Voltage and Current Delivered Under Simultaneous Stimulation ... 89
Figure 2-15: ICS Current Source Performance at Compliance Limits...91
Figure 2-16: Performance vs. Total Charge Delivered at Compliance Limits...93
Figure 2-17: Measurements Across an Electrode in Saline... 95
Figure 2-18: Current Amplitudes Delivered to an Electrode in Saline ... 96
Figure 2-19: Voltage measured Between Electrodes with Scope and Telemetry ... 97
Figure 3-1: Monopolar Stimulus Waveform Used During Voltage Measurements...104
Figure 3-2: Typical Voltage Measurements at Unstimulated Electrodes...113
Figure 3-3: Typical Voltage Measurements at a Stimulated Electrode...117
Figure 3-6: Coefficients of Variation for Z Measured at a Low Stimulus Level (C223).125
Figure 3-7: Transimpedance Computed Using a High Stimulus Level for C223 (Left).. 126
Figure 3-8: Coefficients of Variation for Z^ Measured at a High Stimulus Level (C223)128 Figure 3-9: Transimpedance Measured Across Two Levels for C223 (Left) ... 129
Figure 3-10: Transimpedance Variability over Time for C223 (Left) ... 130
Figure 3-11: Phased Array Currents for Focusing at Each Electrode (C223, Left) ... 132
Figure 3-12: Worst-Case Impact of Measurement Variability (C223, Left)...134
Figure 3-13: Simulated Distribution of Error in Voltage C223 (Left)...135
Figure 3-14: Impact of Stimulus Level on Phased Array Currents ... 136
Figure 3-15: Transimpedance Data for All Subjects Measured at High Level...138
Figure 3-16: Transimpedance Data for All Subjects Measured at High Level...139
Figure 3-17: Impact of Variability Over Time...144
Figure 3-18: Phased Array Currents for Focusing At Electrode 8 Across Subjects...146
CHAPTER ].BACKGROUND AND SIGNIFICANCE
1
Background and Significance
1.1
Cochlear Implants
The cochlear implant is a neural prosthesis designed to convey acoustic information to a sensorineural deaf listener via electric stimulation of surviving auditory nerve fibers. In today's "multichannel" cochlear implants, stimulation of the auditory nerve is accomplished with a multiple-electrode array that is surgically inserted into the scala tympani at the base of the cochlea to a depth of approximately 20-30 mm (Adunka & Kiefer, 2006). The electrode contacts are distributed along the spiraling (longitudinal) axis of the scala tympani, in parallel with the tonotopically organized array of surviving auditory nerve fibers. High characteristic frequency fibers are located at the cochlear base, and progressively lower characteristic frequency fibers are located toward the apex (Liberman, 1982; Greenwood, 1990). By controlling the stimulus waveforms at each electrode site, cochlear implants attempt to differentially excite discrete regions of the auditory nerve independently (each region consisting of fibers having a narrow range of characteristic frequencies) to encode spectral information as a function of cochleotopic position.
The components of a typical commercially available cochlear implant are illustrated in Figure 1-1. Sound is captured by a microphone positioned behind the ear or at the entrance to the ear canal. A sound processor analyzes the sound signal, coarsely imitating the frequency analysis that occurs in the normally functioning cochlea (Loizou, 1998). The sound processor then sends instructions across a transcutaneous radio-frequency link to a package of electronics surgically placed just under the skin. The implanted circuitry receives and decodes commands from the sound processor that control the stimulator containing current sources that deliver electric current into the scala tympani through the implanted electrode array.
Today's electrode arrays contain up to 24 intra-cochlear electrodes intended to produce excitation at distinct cochleotopic sectors along the auditory nerve. However, under monopolar stimulation (the most commonly used stimulation strategy today), where all stimulus current from individually activated scala tympani electrodes is returned to an extracochlear ground electrode, broad excitation patterns across the array of auditory nerve
fibers arise due to current spread in the ionic fluids of the cochlea (van den Honert & Stypulkowski, 1987). This is thought to limit the spatial selectivity of electric stimulation, and ultimately to reduce spectral resolution in cochlear implant listeners (Friesen et al., 2001; Litvak et al., 2007b).
External Internal
Coil Coil
Microphone and Stimulator
S o u nd P rocesso r A d t r
Auditory
Nerve
Electrode Array
Figure 1-1: A Typical Cochlear Implant The external components of a cochlear
implant are a microphone and sound processor to receive and analyze sound signals respectively. Communication with the implanted components is accomplished through a radio-frequency link across the skin. The implanted portion of the device consists of a stimulator containing current sources, and an electrode array with electrode contacts arranged along the scala tympani. (Illustration courtesy of the National Institute on
Deafness and Other Communication Disorders)
In this thesis, the feasibility of implementing a multipolar stimulation strategy termed "phased array" stimulation by van den Honert & Kelsall (2007), is evaluated in patients wearing commercially available Clarion CH or HiRes90k cochlear implants manufactured by
the Advanced Bionics corporation (Advanced Bionics, Valencia, CA). The phased array strategy involves activating all scala tympani electrodes simultaneously with waveforms of specified magnitudes and phases designed to accomplish "current focusing" to achieve improved spatial selectivity relative to monopolar stimulation. Advanced Bionics implants were considered exclusively in this study, because unlike other available devices, these contain 16 independently programmable current sources to control each of 16 scala tympani electrodes.
In the following section (Section 1.2), the design strategies and signal processing techniques used today's cochlear implants are described. In Sections 1.3 through 1.5,
CHAPTER 1.BACKGROUND AND SIGNIFICANCE
performance-limiting factors in cochlear implant listening are identified, and the hypothesis that spatial selectivity and spectral resolution are degraded under conventional cochlear implant stimulation is developed. In Section 1.6, the theoretical principles underlying the phased array stimulation strategy are then described, and the concept of the transimpedance matrix (van den Honert & Kelsall, 2007), which must be known for the successful implementation of this strategy in an implanted ear, is introduced.
In Chapter 2, measurements obtained using an Advanced Bionics cochlear implant stimulator mounted on the laboratory bench are presented to characterize the hardware, and to document the degree to which phased array stimulation might be implemented (and, therefore, tested) in the current population of patients who are implanted with a similar device.
In Chapter 3, estimates of transimpedance matrices are presented for 11 cochlear implants in research subjects, and recommendations are made to aid in the future development of phased array cochlear implants. All of the measurements made in human subjects described in Chapter 3 were approved by human studies committees at both the Massachusetts Institute of Technology and at the Massachusetts Eye and Ear Infirmary.
1.2
Design Considerations for Speech Coding in the Auditory Nerve
The most important goal for the designers of today's cochlear implants is to provide or restore an understanding of speech to the listener. To this end, electric stimulation patterns computed by the cochlear implant sound processor, and presented through the electrode array, must elicit neural discharge patterns that represent acoustic-phonetic information in the speech waveform, mimicking the information-bearing discharge patterns that are produced across auditory nerve fibers during acoustic hearing. It is thought that if normal patterns of auditory nerve activity could be elicited with a cochlear implant (i.e. those same patterns that would occur in a the auditory nerve of a normal hearing listener during acoustic listening), and if the patient's central auditory system is intact and receptive to afferent neural activity, normal levels of speech recognition could theoretically be achieved (Kiang & Moxon, 1972; Moore,
2003; Rubinstein, 2004).
Today's cochlear implant signal processing strategies attempt to either preserve all spectro-temporal information in the speech waveform as reliably as possible (Kiang & Moxon, 1972; Eddington, 1980; Wilson et al., 1991), or extract the "features" thought to be most relevant for speech recognition (Clark et al., 1987; McDermott et al., 1992; Skinner et al., 1994). Patterns of current are then presented through the electrode array to elicit spatio-temporal patterns of auditory nerve activity that encode the processed information (Moore,
2003; Rubinstein, 2004). Today's implants attempt to match acoustic excitation patterns along
the length of the electrode array, but dot not attempt to match excitation at apical nerve fibers having characteristic frequencies less than a few hundred Hertz.
1.2.1 Speech Recognition Requires a Neural Representation of Spectral Shape
Speech recognition in normal hearing requires the listener's auditory system to identify the time-varying configuration of the speaker's vocal tract during speech production. The vocal tract's transfer function contains essential information for speech-sound discrimination, such as instantaneous vocal tract formants (Flanagan, 1972; Stevens & House, 1972) and dynamic formant transitions (Delattre et al., 1955). This phonetic information is accessible in the time-varying spectral shape of the acoustic speech signal (i.e. the peaks and valleys in the amplitude spectrum). The normal ear performs a complex mechanical analysis of the acoustic signal and encodes this essential spectral shape information in the spatio-temporal population response of auditory nerve fibers (Sachs & Young, 1979; Young & Sachs, 1979).
1.2.2 Conveying Spectral Shape Information by Restoring the Place Code
To extract spectral shape from a sound signal, cochlear implant signal processing strategies are usually informed by some simplified model of normal peripheral auditory physiology (Kiang et al., 1979; Eddington, 1980; Wilson et al., 1991; McDermott et al., 1992; Skinner et al., 1994; Loizou, 1998). One straightforward model for speech coding in the auditory nerve, which most conventional cochlear implant sound processors adopt, is based on the place principle, which views the cochlea as a mechanical analyzer that separates frequencies along its tonotopic axis. This model predicts that each auditory nerve fiber will respond to low-level speech by increasing its firing rate primarily during times when energy is
CHAPTER 1.BACKGROUND AND SIGNIFICANCE
present in the speech signal near the fiber's characteristic frequency (Kiang & Moxon, 1972; Sachs & Young, 1979)'.
Cochlear implants attempt to encode spectral information along the tonotopic axis according to the above place principle by producing electric stimulus waveforms derived from the time-varying spectral shape of the acoustic signal at each spatially separated (cochleotopic) electrode location (Kiang et al., 1979; Eddington, 1980; Loizou, 1998). Much of today's cochlear implant research, including the work presented in this thesis, is directed at modifying cochlear implant stimulus patterns to achieve more precise stimulus coding in the auditory nerve, and to better represent the spectral shape information essential for
speech-sound discrimination and labeling.
1.2.3 Conventional Sound Processing in Cochlear Implants
The major components in a typical cochlear implant sound processor are illustrated in Figure 1-2. An acoustic signal is first captured in the listening environment by the externally-worn microphone. Because the dynamic range for loudness in cochlear implants is much smaller than the range of sound levels present in everyday listening situations (Shannon, 1983a), the incoming sound signal is compressed using some nonlinear mapping function (Loizou, 1998). The compression stage is either applied at the front-end (as depicted in Figure
1-2) or at the output stage prior to each current source, or at both the input and output stages.
This first-order approximation ignores many complex features of mechanical processing in the normal cochlea, including the high sensitivity and frequency selectivity resulting from the "active" non-linear amplification by outer hair cells, as well as the effects of two-tone suppression, neural responses to distortion products and efferent inhibition (Robles & Ruggero, 2001). The place model does not realistically account for the precise temporal discharge patterns found across auditory nerve fibers in response to speech sounds (Young & Sachs, 1979), nor does it account for neural adaptation (Kiang et al., 1965), or the stochastic response patterns across fibers (Litvak et al., 2003). Finally, no distinction is made between populations of auditory nerve fibers which normally differ in spontaneous firing rate, threshold, and dynamic range (Liberman, 1978). Because all of these aspects of normal physiology are incompletely understood, and the ability to reproduce them with a small number of scala tympani electrodes is limited, they will not be considered further. See Kiang & Moxon (1972) and Moore (2003) for thorough considerations of the major differences between stimulus coding in acoustic and electric hearing.
Nonlinear Compression
SPL
Microphone
Band-pass Envelope PulseCurrent
Filters Detectors Generators Sources LA LI Time Rect/ Fre low-pass Freq uA ... ... Time Rect/ Fre low-pass JLTime Rect / Freq low-pass * \I CS c s. s .n.y..k.n. I FreT I
CIS processors only Skin
L
---Figure 1-2: A Cochlear Implant Sound Processor Sound processing in a cochlear implant involves compressing an acoustic signal into a narrow dynamic range, and separating the energy in the signal into discrete frequency bands using an array of band-pass filters. In early Compressed Analog processors, the waveforms at the outputs of the band-pass filters were presented directly to individual electrodes in the array. In the Continuous Interleaved Sampling (CIS) processing strategy, the envelopes of the band-pass signals are used to modulate electric pulse trains, which are temporally interleaved and sent to the electrodes. Each electrode, E1, E2, E3, etc., is positioned to excite local
populations of auditory nerve fibers with a narrow range of characteristic frequencies.
A bank of band-pass filters is employed to separate the signal into distinct frequency
"analysis channels." This spectral analysis mimics normal cochlear function, where frequency components are mechanically separated along the basilar membrane. The total number of analysis channels used by a sound processor (16 in today's Advanced Bionics implants) represents an upper limit for the spectral resolution of the device2. The number of channels necessary for adequate speech recognition remains an open question, and the degree to which channel independence is limited during electric stimulation using conventional methods is of particular interest to this work.
2 In some sound processors, only a subset of available channels (those with the highest energy) is selected for use during a given "temporal frame" (e.g. McDermott et al., 1992). In such processors, the number of channels in this subset represents an additional limit on spectral resolution.
Auditory Nerve Apex Low Freq. High Base Freq.
CHAPTER 1.BACKGROUND AND SIGNIFICANCE
For each frequency channel, an electrode contact is positioned along the tonotopic axis of the cochlea, as shown on the right side of Figure 1-23. This spatial separation of electrodes
allows for the production of electric stimuli near the cochlear base when high frequency energy is present in the acoustic signal and for the production of stimuli near the apical nerve fibers when low frequency energy is present. In the Advanced Bionics HiFocus electrode array, electrode contacts are regularly spaced 1.1 mm apart, and are numbered El through E16
from apex to base.
Differential stimulation patterns across electrodes are intended to excite discrete populations of auditory nerve fibers to implement a place code, so that gross spectral shape information might be encoded as a function of cochleotopic position (Merzenich & White,
1977; Eddington et al., 1978; Clark et al., 1978; Loizou, 1998). Ideally, each electrode would
excite only a spatially local population of auditory nerve fibers to reduce the possibility of electrodes exciting overlapping neural populations. The spatial overlap of excitation patterns could impair the ability to encode spectral shape, as will be discussed.
1.2.3.1 Compressed Analog Sound Processors: Simultaneous Stimulation
In early Compressed Analog sound processors, the analog waveforms at the band-pass
filter outputs were presented directly to each electrode in an attempt to preserve all possible information within each frequency band (Eddington, 1980). As will be discussed, the simultaneous activation of electrodes in this approach can lead to interactions between analysis channels due to summation of the potential fields that result from stimulation at the individual electrode sites (Eddington et al., 1978; Shannon, 1983b; White et al., 1984; B6ex et al., 2003a; Stickney et al., 2006).
It is now apparent that significant information preserved by Compressed Analog sound processors is imperceptible in many cochlear implant listeners, who appear unable to detect rapid temporal fluctuations in electric stimuli within each channel (Wilson et al., 1991). For example, although pitch increases with the frequency of analog sinusoidal stimulation applied to a single electrode at low frequencies, it ceases to change as the stimulus frequency is
3 The illustration in Figure 1-2 assumes that a common return electrode is located outside the
cochlea and electric current is sourced through each "monopolar" electrode. In some electrode arrays, stimulation is accomplished using closely spaced "bipolar" electrode pairs for each analysis channel.
increased beyond 300-400 Hz (Shannon, 1983a), even though phase locking to electric stimulation in single units occurs well beyond this limit (Dynes & Delgutte, 1992). Fortunately, studies of speech recognition in normal hearing listeners suggest that speech can be highly intelligible in quiet without fine-structure information (i.e. the instantaneous phase), provided that the more slowly varying amplitude cues (i.e. the temporal envelopes) are preserved within a few broad spectral bands (Shannon et al., 1995; Smith et al., 2002).
The findings that rapid temporal fluctuations are not detectable in cochlear implant listeners but may be unnecessary for speech recognition in quiet, have led researchers to discard fine-structure information when convenient in developing today's stimulation strategies, which avoid the simultaneous activation of electrodes.
1.2.3.2 CIS Sound Processors: Non-Simultaneous Stimulation
In 1991, Wilson et al. introduced the Continuous Interleaved Sampling (CIS) processing strategy, which implements pulsatile (as opposed to analog) stimulation. The components of a
CIS processor are shown within the dashed box in Figure 1-2. In this scheme, rather than
presenting the waveforms at the band-pass filter outputs directly to the electrodes, the envelopes are extracted, and fine-structure, which cochlear implant listeners could not perceive in Compressed Analog waveforms, is discarded. The within-channel envelopes are used to amplitude modulate trains of temporally-interleaved biphasic pulses (sometimes with further amplitude compression on each channel). High pulse rates (>800 pulses per second) are usually employed to track the envelope fluctuations in each frequency band (Wilson et al.,
1991).
The interleaving of pulsatile stimuli across electrodes in CIS provides a key advantage over Compressed Analog processors. Current pulses are sent to each electrode sequentially, so no two electrodes are ever activated at the same time. As will be discussed, this temporal-interleaving of pulses reduces interaction between electrodes (Eddington et al., 1978; White et al., 1984; Favre & Pelizzone, 1993; Boex et al., 2003a; Crema et al., 2009), and improves speech recognition scores over simultaneous analog stimulation in most cases (Wilson et al.,
1991; Boex et al., 1996). All of today's commercially available sound processors support
CHAPTER 1.BACKGROUND AND SIGNIFICANCE 21
1.3
Performance With Cochlear Implants Needs Improvement
Figure 1-3 illustrates levels of performance found in a survey of 211 patients with monolateral implants, on a test of monosyllabic "consonant-nucleus-consonant" (CNC) word recognition in quiet. Median performance was 50% correct, with individual patients achieving scores from zero to nearly 100% correct. Substantially lower scores would be expected with the addition of background noise or reverberation.
40 N = 211 - Date of Activation: -- 1/1/2004 - 1/14/2010 -- Days Post--Activation: >60 .2 30 - Median Score: 50% a) b 20 E Z 10 0 0 20 40 60 80 100
prom Mass EyeadgE Maximum CNC Word Score (percent correct)
Figure 1-3: Cochlear Implant Patient Performance Distribution of maximum word scores for monosyllabic word recognition of 211 patients at the Massachusetts Eye and Ear Infirmary. Data include CNC test results from all patients with monolateral implants activated from 1/1/2004 to 1/14/2010 with at least 60 days experience with their implant at the time they were tested. For each patient, the maximum test result was used. The sample includes all post-lingually and congenitally deafened individuals. (Data provided
by Eddington and Herrmann, 2/2010, personal communication)
Those individuals who score greater than 75% correct on this test tend to recognize simply connected speech in everyday listening situations, and converse fluently without the aid of lip-reading. These data demonstrate that for the majority of patients using today's implants, performance does not meet this level considered necessary for everyday speech communication.
1.4 Identifying Limitations on Speech Recognition in Cochlear Implant
Listening
Much of today's research in cochlear implants is aimed at identifying factors that limit speech reception performance, and at devising methods to overcome those limitations. Here, potential performance-limiting factors are separated into two categories: 1) factors associated with the sound processing system, and 2) factors associated with the implantee.
1.4.1 Potential Sound Processor-Related Limitations (Friesen et al., 2001)
It is possible that information necessary for conversational speech recognition, which is present in the original sound signal, may be discarded, distorted, or sub-optimally presented to the implantee by the cochlear implant sound-processing strategy. For example, the methods used by cochlear implants to mimic a place code for spectral shape information are oversimplified compared to the detailed mechanical processing of the normal cochlea (see footnote 1 in Section 1.2.2). Moreover, cochlear implants use a relatively small number of spectral analysis channels (16 in the Advanced Bionics implants) to coarsely encode spectral shape information (Section 1.2.3). Finally, modern CIS processors preserve within-channel envelope information, but discard fine-structure. If all the information remaining in the processed signal of a cochlear implant is received by a poorly-performing listener, then the only way to improve performance would be to change the sound-processing strategy to increase the information content.
A study by Friesen et al. (2001) directly addressed questions of sound processor-related
limitations on speech reception. These researchers compared speech reception scores of cochlear implant users wearing experimental sound processors with scores of normal hearing individuals listening to speech processed by a cochlear implant "simulator." The simulator (sometimes called a noise vocoder) was designed to deliver acoustic signals with similar information as the electric signals presented to a cochlear implant user. In both groups, the amount of spectral information delivered was varied by changing the number of spectral analysis channels used to process the speech signals.
The strategy of measuring performance in a group of normal hearing listeners reduces performance-limiting factors differing across listeners (performance across cochlear implant
CHAPTER 1.BACKGROUND AND SIGNIFICANCE
subjects is more variable), and reveals decrements in normal performance (listening to unprocessed acoustic signals) associated with the sound processing strategy. In addition, a comparison of performance between the normal hearing and cochlear implant groups provides insight into the degree to which cochlear implant subjects are able to extract all of the limited information delivered by their cochlear implant sound processors.
1.4.1.1 Friesen et al. (2001), Methods: Signal Processing for Cochlear Implant Group
In the cochlear implant subjects, spectral information was manipulated by programming experimental sound processors to select a subset of their available band-pass filters, or to selectively combine the outputs of adjacent band-pass filters, to effectively adjust the number of spectral analysis channels. Stimulus waveforms computed for each channel were then directed to specified subsets of the available electrodes as described by Fishman et al. (1997). As the number of channels was decreased, the spectral shape information preserved by the sound processor was reduced, and the spacing between activated electrodes along the array was made larger.
Friesen et al. (2001) programmed "reduced electrode processors" using Nucleus-22
SPEAK processors (Cochlear Limited, Sydney, Australia) with 2, 4, 7, 10, and 20 channels,
and Clarion processors (Advanced Bionics, Valencia, CA) with 2, 3, 4, 6, 7, and 8 channels. In each manipulation, the total speech bandwidth was preserved, but the number of channels used represented an upper limit on spectral resolution, or spectral shape information available at the sound processor output prior to neural excitation.
1.4.1.2 Friesen et al. (2001), Methods: Signal Processing for Normal Hearing Group
-Acoustic Simulations of Cochlear Implant Sound Processing
In the normal hearing subjects, signal processing techniques devised by previous researchers were used to mimic cochlear implant sound processing (Shannon et al., 1995; Dorman et al., 1997). The speech waveform is filtered into a number of relatively broad, contiguous frequency bands using a bank of digital band-pass filters (the number of band-pass filters distributed over the speech frequency band is analogous to the number of analysis channels used in the experimental cochlear implant processors described above). The envelopes of the resulting band-pass signals are extracted (as in CIS processing, see Figure
1-2), and used to amplitude modulate narrow-band noise carriers centered at the center frequencies of the band-pass filters (and having the same bandwidths). The signals are finally recombined and presented acoustically to normal hearing listeners.
The acoustic information delivered to the normal hearing listeners after a sound signal is processed using these methods closely approximates the information delivered to the cochlear implant listeners after the same sound signal is analyzed with the experimental cochlear implant sound processors. In both groups, spectral information in the original signal is degraded by partitioning the spectrum into a relatively small number of analysis channels, and removing within-channel spectral shape information. Temporal fine-structure information is discarded, but envelope fluctuations within each spectral band are preserved by using each band envelope to modulate: (1) biphasic pulse train carriers with relatively high repetition rate in the cochlear implant group and (2) band-limited noise carriers in the normal hearing group. Finally, in both groups, the envelope information from each analysis channel is presented at distinct cochleotopic locations: (1) in cochlear implants, electric stimuli are presented at discrete electrode locations, and (2) in the acoustic simulations, energy in each frequency band is positioned cochletopically according to carrier frequency by the mechanical tuning of the normal peripheral auditory system.
1.4.1.3 Friesen et al. (2001), Results: Implantees are Unable to Receive Available Information after Sound Processing
One working hypothesis is that normal hearing listeners are able to extract and use virtually all of the information present in the cochlear implant-processed speech sounds. This means that the performance on speech reception tests of the normal hearing listeners listening to the acoustic simulations 1) illustrates the degree to which information in sound signals is degraded by cochlear implant sound processing and 2) represents an upper limit of performance for the cochlear implant listeners. Any differences in performance between the cochlear implant and normal hearing groups must reflect some difference in the manner in which the information is sub-optimally presented, encoded in the auditory nerve, or processed
CHAPTER J.BACKGROUND AND SIGNIFICANCE
Friesen et al. (2001) found that in speech recognition tasks, performance improved monotonically with the number of electrodes or analysis channels in both the normal hearing subjects listening to acoustic simulations of cochlear implant-processed speech, and in the best-performing cochlear implant listeners. Moreover, test scores were usually similar between the two groups. However, performance plateaued in the cochlear implant listeners as the number of channels reached approximately 4-7 (for example, see their Figure 1). On average, cochlear implant listeners received no additional benefit when the number of analysis channels was increased further. In contrast, normal hearing listeners' performance continued to increase with the number of channels beyond 7, both in quiet and in moderate background noise levels4.
The results from normal hearing listeners demonstrate that useful information for speech intelligibility at the output of a sound processor increases as the number of analysis channels increases beyond 7 and up to 20. The relatively high levels of performance seen as the number of channels reaches 16-20 (approximating the number of channels present in today's cochlear implants), suggest that the information available from a typical cochlear implant sound processor, albeit limited, is sufficient to provide better speech reception than currently exhibited by cochlear implant listeners.
The results from the cochlear implant group indicate that cochlear implant listeners are impaired in their ability to take advantage of the increasing information present in the sound processor output as the number of analysis channels is increased beyond 4-7. For these listeners, there apparently is at least one factor that limits access to this additional information. One candidate for such a limiting factor is a limitation on spectral resolution associated with the decreasing distance between neighboring electrodes as the number of spectral channels is increased. A decrease in electrode spacing increases the likelihood that neighboring stimulation channels will influence common segments of the auditory nerve, consequently reducing channel independence and the ability to encode spectral shape.
4 To a first approximation, the addition of background noise resulted in similar performance decrements in both groups.
1.4.2 Potential Implantee-Related Limitations (Litvak et al., 2007b)
One additional element to consider in the CNC word score distribution in Figure 1-3, and
in the results of Friesen et al. (2001), is that each cochlear implant listener's ability to access the information present at the sound processor output varies greatly. One way to analyze across-subject performance differences is to determine whether a suspected performance-limiting factor varies across implantees such that it explains a significant amount of across-subject speech reception variance. Researchers have used multiple regression analysis to quantify the effects of suspected implantee-related factors such as age at the onset of deafness, etiology of deafness, and duration of deafness (Blamey et al., 1996). Individual differences in spiral ganglion cell survival have also been studied (Nadol & Eddington, 2006). However, the measured association of performance to these factors remains weak.
As mentioned above, one hypothesis suggested by the Friesen et al. (2001) results is that spectral resolution plays a role in determining performance limits in cochlear implant listeners. If differences in spectral resolution occur across cochlear implant listeners, one might expect that individuals with poorer spectral resolution would also demonstrate poorer speech recognition. Litvak et al. (2007b) investigated the relationship between spectral resolution and speech-sound identification scores. In their study, the spectral modulation detection threshold (SMT) (Litvak et al., 2007b; Saoji et al., 2007), a psychophysical measure of the degree to which subjects can detect just noticeable spectral envelope differences between broadband signals, was used as an indicator of spectral resolution in individual cochlear implant subjects.
1.4.2.1 Litvak et al. (2007b), Methods: Measuring Spectral Modulation Detection Threshold
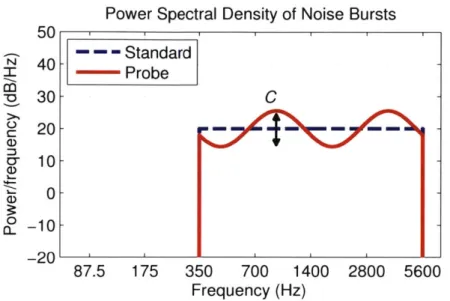
For measurements of SMT, listeners were required to compare two signals differing only in spectral shape. A "standard" flat-spectrum broadband noise signal was presented on each trial, along with a "probe" stimulus with a sinusoidal spectral shape of random phase (Figure 1-4). The probe stimulus was also called a "spectral ripple" due to the shape of its spectral envelope.
CHAPTER 1.BACKGROUND AND SIGNIFICANCE 27
Power Spectral Density of Noise Bursts
50
-- -Standard
N40
- Probe30-
C
20- 1 0-C0 -10-20
87.5
175
350
700
1400
2800 5600
Frequency (Hz)
Figure 1-4: Stimuli for Spectral Modulation Detection Experiment Power spectra of
the Standard (flat spectrum) noise burst and Probe ("spectral ripple") stimulus used by Litvak et al. (2007b) to measure spectral modulation detection threshold (SMT). The "ripple frequency" of the probe stimulus was held constant at 0.25 cycles per octave or at
0.5 cycles per octave (as shown, such that two "periods" appear across four octaves). The
"starting phase" which determines the locations of peaks and valleys on the abscissa, was randomized on each presentation. The spectral "contrast" C (indicated) was adjusted to the smallest level so that the Standard and Probe stimuli were perceived as different, and the dB difference between peaks and valleys was taken as SMT.
The standard and probe noise bursts were presented to cochlear implant listeners via their own sound processors and to normal hearing listeners presented with acoustic simulations of cochlear implant-processed stimuli. The signal processing techniques for these acoustic simulations were similar to those used by Friesen et al. (2001) described in Section 1.4.1.2, except band-pass filter slopes (in dB/Oct) were broadened so that energy from adjacent analysis channels "overlapped" on the frequency axis, artificially "smearing" spectral shape information'. Each listener performed a forced-choice discrimination task that tested their ability to distinguish the two signals using the available differences in spectral shape. The spectral modulation detection threshold (SMT) was defined as the "smallest detectable
5 This manipulation was necessary in the normal hearing listeners in order to obtain the large range of performance needed for a comparison with the cochlear implant group (where across-subject performance is characteristically highly variable). Note that the authors could have used other methods to reduce spectral resolution in the acoustic simulations. The choice of broad, overlapping band-pass filters was specifically intended to simulate a situation where broad patterns of neural excitation occur for each cochlear implant electrode, possibly due to current spread in the ionic fluids of the cochlea. The hypothesis that current spread in the cochlea is the mechanism responsible for decreased spectral resolution in cochlear implant listeners will be explored further in the following section.
spectral contrast in the spectral ripple stimulus" (Litvak et al., 2007b), where contrast is the peak-to-valley difference in dB indicated by the arrow in Figure 1-4. SMT was measured using an adaptive procedure, where C was adjusted according to a 3 Down, 1 Up rule such that reported SMTs for each subject correspond to contrasts that would yield 79.4% correct discrimination (Levitt, 1971).
1.4.2.2 Litvak et al. (2007b), Results: Spectral Modulation Detection Threshold Predicts Speech Recognition Scores
Litvak et al. (2007b) found that spectral modulation detection threshold is a strong
predictor of both vowel and consonant recognition scores. In both the cochlear implant and
normal hearing groups, speech recognition scores decreased with decreasing spectral resolution (increasing SMT). In both groups, a strong correlation was found between SMT and both vowel (r = -0.84 for cochlear implant listeners) and consonant (r = -0.82 for cochlear
implant listeners) identification scores. For the normal hearing listeners, SMT increased and speech recognition scores decreased with shallower noise-band slopes (greater overlap across band-pass filters) as expected.
The strong correlation between spectral resolution and speech sound identification scores suggests that across cochlear implant-subject variability in spectral resolution is a major factor in explaining across-subject variance among data discussed earlier, both in the distribution of
CNC word scores measured in clinical patients (Figure 1-3), and in the distribution of
performance across cochlear implant listeners in the Friesen et al. (2001) study. Additionally, limited spectral resolution (compared to normal hearing subjects) among even the highest-performing cochlear implant listeners, may account for the 4-7 channel limitation seen in the Friesen et al. (2001) data.
In summary, the results discussed above suggest that the output signals from a cochlear implant sound processor contain sufficient information for high levels of speech recognition in quiet. However, the spectral information received by cochlear implant listeners may be limited as the number of analysis channels increases beyond 4-7 (as the spacing between electrodes decreases), despite an increase in spectral information at the sound processor output. Spectral resolution in cochlear implant listeners may partly explain both the variability in speech
CHAPTER 1.BACKGROUND AND SIGNIFICANCE
reception performance across listeners, and the performance limits within better-performing listeners. Speech intelligibility may therefore be improved by identifying mechanisms responsible for degrading spectral resolution in cochlear implant listeners, and devising methods to improve the transfer of spectral information from the sound processor to the recipient.
1.5
Hypothesis: Poor Spatial Selectivity Limits Spectral Resolution
The following sections discuss one hypothesis to account for the loss of spectral resolution in cochlear implant listeners: information in the electric stimuli delivered after cochlear implant sound processing is degraded across the "interface" between the scala tympani electrode array and the auditory nerve (Merzenich & White, 1977) such that electrically-elicited neural activity contains a reduced representation of spectral shape as a function of cochleotopic place. According to this hypothesis, the transfer of spectral information across the interface is limited by the spatial selectivity of neural excitation, which is impacted by current spread in the ionic fluids of the cochlea.
Section 1.5.1 describes several lines of evidence suggesting that broad patterns of neural excitation relative to the spacing of the electrodes occur in cochlear implants due to current spread. Notably, Section 1.5.2 describes how the resulting interactions between electrodes along the auditory nerve could limit the encoding of spectral shape, and Section 1.5.2.3 describes some psychophysical evidence of interaction. Section 1.5.3 discusses previous studies that associate measures of interaction with speech recognition performance.
Note throughout, that one consequence of this "spatial selectivity hypothesis" is a reduced ability of cochlear implant listeners to optimally take advantage of information from closely spaced electrodes. This could explain Friesen et al.'s (2001) finding that cochlear implant listeners experience a plateau in performance as the number of electrodes reaches 4-7. This is also consistent with Litvak et al.'s finding (2007b) that spectral resolution decreases as increasing "current spread" is simulated (using broad band-pass filters) in normal hearing listeners.
1.5.1 Evidence for Broad Excitation Relative to Electrode Spacing
Stimulation at cochlear implant scala tympani electrodes produces a potential field (or current density field) within the cochlea. Neural excitation strength is related to the field strength in the vicinity of auditory nerve fibers (Rattay, 1990; Whiten, 2007). Although it is difficult to perform direct measurements of the field at desired locations along the spiral ganglion, a number of techniques for inferring excitation strength have been developed, and these suggest that there is substantial current spread longitudinally (along the tonotopic axis), in the highly conductive cochlear perilymph.
Previous researchers have quantified the spatial extent, or "spread", of excitation by describing the "unrolled" cochlea as a transmission line, where excitation strength decays exponentially with longitudinal distance from a stimulating electrode (von B6kdsy, 1951; Black & Clark, 1980; Girzon, 1987)6. These transmission line models are described by a single parameter, the length constant (in mm) of excitation strength:
Ax
n
(_X)1-1
Here t(x1) and t(x2) are some measure of excitation strength at two longitudinal
positions (x1 and x2) and Ax is the distance between these measurement locations in mm. The
length constant describes the longitudinal distance over which excitation strength decays by a factor of 1/e ~ 0.37. Estimates of A obtained using various methods are discussed below.
1.5.1.1 Scala Tympani Voltage Measurements are an Indirect Measure of Spread
One technique for determining A is to measure the distribution of electric potential (voltage) at discrete sites within the cochlea. Although scala tympani voltage is an indirect indicator of neural excitation strength (Black & Clark, 1980), measurements can be conveniently obtained in some cochlear implants (including the Advanced Bionics implants).
6 Others have suggested more complex models to obtain better fits to measured data, especially
when describing measurements of excitation strength far from the stimulating electrode or in an adjacent turn of the anatomically correct cochlea (Girzon, 1987; Frijns et al., 1995; Vanpoucke et al., 2004a; Whiten, 2007). For the purposes of this work, it is sufficient to recognize that the spatial extent of excitation is large compared to the electrode spacing, a fact that can be demonstrated using length constants obtained from a transmission line model.
CHAPTER ].BACKGROUND AND SIGNIFICANCE 31
In several studies, electric current was applied at one implanted electrode, while the remaining unstimulated electrodes were used to measure the resulting voltage along the length of the electrode array (Girzon, 1987; Vanpoucke et al., 2004a; van den Honert & Kelsall, 2007). Girzon (1987) found length constants for monopolar electrodes (with a return electrode located outside the cochlea) ranging from 7 to 25 mm near the stimulating electrodes in 5 subjects wearing the INERAID cochlear implant.
Chapter 3 in this thesis describes experiments where the scala tympani voltage resulting from monopolar stimulation at each electrode was measured at unstimulated electrode locations in 11 implanted ears using Advanced Bionics cochlear implants. Plots of transimpedance (estimates of scala tympani voltage normalized by stimulus current) are shown in Figure 3-15 and Figure 3-16. In these figures, each curve represents the transimpedance (measured voltage divided by stimulating current) along the electrode array at
15 unstimulated electrode locations (filled circles) when biphasic current pulses were applied
to a single monopolar stimulating electrode. Extrapolated transimpedance values at the location of each stimulating electrode (open squares) were computed as in van den Honert &
Kelsall (2007)7.
Transimpedance curves tend to decay monotonically with distance from each stimulating electrode, indicating that scala tympani voltage decays with distance. Length constants were computed with Equation 1-1 for all 16 stimulating electrodes El through E1 6 in all ears, using
the transimpedance estimates at the two nearest unstimulated electrode locations. Specifically, for a given stimulating electrode Ek, a length constant was computed using the ratio of transimpedance at electrode Ek+1 to the transimpedance at electrode Ek+2 (except at electrodes 15 and 16, the two most basal electrodes). A second estimate was obtained using the ratio of transimpedance at electrode Ek_1 to the transimpedance at electrode Ek- 2 (except at electrodes 1 and 2, the two most apical electrodes). Where two measures were possible (for
7 For the present purposes of estimating length constants, transimpedance can be thought of as an
indicator that is simply proportional to the scala tympani voltage that is produced when each electrode is activated monopolarly. Therefore, transimpedances can be exchanged for voltages cI(x1) and c1(x2
)
in Equation 1-1 with no difficulty. Detailed methods for acquiring transimpedance data using custom software, including the techniques used to extrapolate the transimpedance values at stimulated electrode locations are described in Chapter 3.
stimulation at electrodes 3 through 14, in the middle of the array) the maximum of the two estimates was taken as the length constant for that electrode. Attempts to fit exponentials to all the data on each side of the stimulating electrodes (as opposed to using the ratio of transimpedances at the two nearest electrodes) led to poor curve fits, especially near the peaks of the curves. The chosen method yields more accurate estimates of spread near the stimulating electrodes, which is of greatest interest as these are the regions where neural excitation is expected.
Length constants computed across all stimulated electrodes in all implanted ears tested range from 1.30 mm to 75.7 mm with a median length constant of 4.66 mm. These are large compared to the electrode spacing of 1.1 mm in the Advanced Bionics HiFocus electrode array. These data demonstrate that electric potential does not decay rapidly along the length of the scala tympani, and suggest that monopolar cochlear implant electrodes may excite broad sectors of the auditory nerve relative to the electrode spacing.
1.5.1.2 Physiological Measures of the Spread of Excitation
Neurophysiologists have estimated the spread of excitation by applying stimulus current through one or more implanted electrodes, and then "mapping" neural excitation across the cochleotopic axis. Techniques involve the measurement of a response (e.g. neural threshold) of an array of primary afferent (auditory nerve) fibers having a broad range of known characteristic frequencies, and therefore known places of cochlear innervation (van den Honert & Stypulkowski, 1987; Kral et al., 1998), or by making similar measurements across single-units in the inferior colliculus8
(Merzenich & White, 1977; Black & Clark, 1980; Snyder et al., 2004), or by placing an array of recording electrodes on the cochleotopically organized auditory cortex (Bierer & Middlebrooks, 2002; Bierer & Middlebrooks, 2004). The response of the neural population is then plotted against cochleotopic location, resulting in a "spatial tuning curve" for a given stimulating electrode location. Observations of the electrically-evoked compound action potential (Brown et al., 1990; Cohen et al., 2003; Abbas et al., 2004) and auditory brainstem response (Merzenich & White, 1977; O'Leary et al., 1985)
8 In typical inferior colliculus mapping studies, one ear is deafened and stimulated electrically, and
the other is kept intact. For each (binaural) inferior colliculus unit, place of cochlear innervation is inferred from measurements of characteristic frequency in response to acoustic tones presented to the contralateral (intact) ear.