arXiv:0712.0598v1 [hep-ex] 4 Dec 2007
A combined search for the standard model Higgs boson at
√
s
= 1.96
TeV
V.M. Abazov36, B. Abbott76, M. Abolins66, B.S. Acharya29, M. Adams52, T. Adams50, E. Aguilo6,
S.H. Ahn31, M. Ahsan60, G.D. Alexeev36, G. Alkhazov40, A. Alton65,a, G. Alverson64, G.A. Alves2,
M. Anastasoaie35, L.S. Ancu35, T. Andeen54, S. Anderson46, B. Andrieu17, M.S. Anzelc54, Y. Arnoud14,
M. Arov61, M. Arthaud18, A. Askew50, B. ˚Asman41, A.C.S. Assis Jesus3, O. Atramentov50,
C. Autermann21, C. Avila8, C. Ay24, F. Badaud13, A. Baden62, L. Bagby53, B. Baldin51,
D.V. Bandurin60, S. Banerjee29, P. Banerjee29, E. Barberis64, A.-F. Barfuss15, P. Bargassa81,
P. Baringer59, J. Barreto2, J.F. Bartlett51, U. Bassler18, D. Bauer44, S. Beale6, A. Bean59, M. Begalli3,
M. Begel72, C. Belanger-Champagne41, L. Bellantoni51, A. Bellavance51, J.A. Benitez66, S.B. Beri27,
G. Bernardi17, R. Bernhard23, I. Bertram43, M. Besan¸con18, R. Beuselinck44, V.A. Bezzubov39,
P.C. Bhat51, V. Bhatnagar27, C. Biscarat20, G. Blazey53, F. Blekman44, S. Blessing50, D. Bloch19,
K. Bloom68, A. Boehnlein51, D. Boline63, T.A. Bolton60, G. Borissov43, T. Bose78, A. Brandt79, R. Brock66, G. Brooijmans71, A. Bross51, D. Brown82, N.J. Buchanan50, D. Buchholz54, M. Buehler82,
V. Buescher22, V. Bunichev38, S. Burdin43,b, S. Burke46, T.H. Burnett83, C.P. Buszello44,
J.M. Butler63, P. Calfayan25, S. Calvet16, J. Cammin72, W. Carvalho3, B.C.K. Casey51, N.M. Cason56,
H. Castilla-Valdez33, S. Chakrabarti18, D. Chakraborty53, K.M. Chan56, K. Chan6, A. Chandra49,
F. Charles19,‡, E. Cheu46, F. Chevallier14, D.K. Cho63, S. Choi32, B. Choudhary28, L. Christofek78,
T. Christoudias44,†, S. Cihangir51, D. Claes68, Y. Coadou6, M. Cooke81, W.E. Cooper51, M. Corcoran81,
F. Couderc18, M.-C. Cousinou15, S. Cr´ep´e-Renaudin14, D. Cutts78, M. ´Cwiok30, H. da Motta2,
A. Das46, G. Davies44, K. De79, S.J. de Jong35, E. De La Cruz-Burelo65, C. De Oliveira Martins3,
J.D. Degenhardt65, F. D´eliot18, M. Demarteau51, R. Demina72, D. Denisov51, S.P. Denisov39,
S. Desai51, H.T. Diehl51, M. Diesburg51, A. Dominguez68, H. Dong73, L.V. Dudko38, L. Duflot16,
S.R. Dugad29, D. Duggan50, A. Duperrin15, J. Dyer66, A. Dyshkant53, M. Eads68, D. Edmunds66,
J. Ellison49, V.D. Elvira51, Y. Enari78, S. Eno62, P. Ermolov38, H. Evans55, A. Evdokimov74,
V.N. Evdokimov39, A.V. Ferapontov60, T. Ferbel72, F. Fiedler24, F. Filthaut35, W. Fisher51,
H.E. Fisk51, M. Ford45, M. Fortner53, H. Fox23, S. Fu51, S. Fuess51, T. Gadfort83, C.F. Galea35,
E. Gallas51, E. Galyaev56, C. Garcia72, A. Garcia-Bellido83, V. Gavrilov37, P. Gay13, W. Geist19,
D. Gel´e19, C.E. Gerber52, Y. Gershtein50, D. Gillberg6, G. Ginther72, N. Gollub41, B. G´omez8,
A. Goussiou56, P.D. Grannis73, H. Greenlee51, Z.D. Greenwood61, E.M. Gregores4, G. Grenier20,
Ph. Gris13, J.-F. Grivaz16, A. Grohsjean25, S. Gr¨unendahl51, M.W. Gr¨unewald30, J. Guo73, F. Guo73,
P. Gutierrez76, G. Gutierrez51, A. Haas71, N.J. Hadley62, P. Haefner25, S. Hagopian50, J. Haley69,
I. Hall66, R.E. Hall48, L. Han7, K. Hanagaki51, P. Hansson41, K. Harder45, A. Harel72, R. Harrington64,
J.M. Hauptman58, R. Hauser66, J. Hays44, T. Hebbeker21, D. Hedin53, J.G. Hegeman34,
J.M. Heinmiller52, A.P. Heinson49, U. Heintz63, C. Hensel59, K. Herner73, G. Hesketh64,
M.D. Hildreth56, R. Hirosky82, J.D. Hobbs73, B. Hoeneisen12, H. Hoeth26, M. Hohlfeld22, S.J. Hong31,
S. Hossain76, P. Houben34, Y. Hu73, Z. Hubacek10, V. Hynek9, I. Iashvili70, R. Illingworth51,
A.S. Ito51, S. Jabeen63, M. Jaffr´e16, S. Jain76, K. Jakobs23, C. Jarvis62, R. Jesik44, K. Johns46,
C. Johnson71, M. Johnson51, A. Jonckheere51, P. Jonsson44, A. Juste51, D. K¨afer21, E. Kajfasz15,
A.M. Kalinin36, J.R. Kalk66, J.M. Kalk61, S. Kappler21, D. Karmanov38, P. Kasper51, I. Katsanos71,
D. Kau50, R. Kaur27, V. Kaushik79, R. Kehoe80, S. Kermiche15, N. Khalatyan51, A. Khanov77,
A. Kharchilava70, Y.M. Kharzheev36, D. Khatidze71, H. Kim32, T.J. Kim31, M.H. Kirby54, M. Kirsch21,
B. Klima51, J.M. Kohli27, J.-P. Konrath23, M. Kopal76, V.M. Korablev39, A.V. Kozelov39, D. Krop55,
S. Lammers71, G. Landsberg78, P. Lebrun20, W.M. Lee51, A. Leflat38, F. Lehner42, J. Lellouch17,
J. Leveque46, P. Lewis44, J. Li79, Q.Z. Li51, L. Li49, S.M. Lietti5, J.G.R. Lima53, D. Lincoln51,
J. Linnemann66, V.V. Lipaev39, R. Lipton51, Y. Liu7,†, Z. Liu6, L. Lobo44, A. Lobodenko40,
M. Lokajicek11, P. Love43, H.J. Lubatti83, A.L. Lyon51, A.K.A. Maciel2, D. Mackin81, R.J. Madaras47,
P. M¨attig26, C. Magass21, A. Magerkurth65, P.K. Mal56, H.B. Malbouisson3, S. Malik68,
V.L. Malyshev36, H.S. Mao51, Y. Maravin60, B. Martin14, R. McCarthy73, A. Melnitchouk67,
A. Mendes15, L. Mendoza8, P.G. Mercadante5, M. Merkin38, K.W. Merritt51, J. Meyer22,d, A. Meyer21,
T. Millet20, J. Mitrevski71, J. Molina3, R.K. Mommsen45, N.K. Mondal29, R.W. Moore6, T. Moulik59,
G.S. Muanza20, M. Mulders51, M. Mulhearn71, O. Mundal22, L. Mundim3, E. Nagy15, M. Naimuddin51,
M. Narain78, N.A. Naumann35, H.A. Neal65, J.P. Negret8, P. Neustroev40, H. Nilsen23, H. Nogima3,
A. Nomerotski51, S.F. Novaes5, T. Nunnemann25, V. O’Dell51, D.C. O’Neil6, G. Obrant40,
C. Ochando16, D. Onoprienko60, N. Oshima51, J. Osta56, R. Otec10, G.J. Otero y Garz´on51, M. Owen45,
P. Padley81, M. Pangilinan78, N. Parashar57, S.-J. Park72, S.K. Park31, J. Parsons71, R. Partridge78,
N. Parua55, A. Patwa74, G. Pawloski81, B. Penning23, M. Perfilov38, K. Peters45, Y. Peters26,
P. P´etroff16, M. Petteni44, R. Piegaia1, J. Piper66, M.-A. Pleier22, P.L.M. Podesta-Lerma33,c,
V.M. Podstavkov51, Y. Pogorelov56, M.-E. Pol2, P. Polozov37, B.G. Pope66, A.V. Popov39,
C. Potter6, W.L. Prado da Silva3, H.B. Prosper50, S. Protopopescu74, J. Qian65, A. Quadt22,d,
B. Quinn67, A. Rakitine43, M.S. Rangel2, K. Ranjan28, P.N. Ratoff43, P. Renkel80, S. Reucroft64,
P. Rich45, M. Rijssenbeek73, I. Ripp-Baudot19, F. Rizatdinova77, S. Robinson44, R.F. Rodrigues3,
M. Rominsky76, C. Royon18, P. Rubinov51, R. Ruchti56, G. Safronov37, G. Sajot14,
A. S´anchez-Hern´andez33, M.P. Sanders17, A. Santoro3, G. Savage51, L. Sawyer61, T. Scanlon44,
D. Schaile25, R.D. Schamberger73, Y. Scheglov40, H. Schellman54, P. Schieferdecker25, T. Schliephake26, C. Schwanenberger45, A. Schwartzman69, R. Schwienhorst66, J. Sekaric50, H. Severini76, E. Shabalina52,
M. Shamim60, V. Shary18, A.A. Shchukin39, R.K. Shivpuri28, V. Siccardi19, V. Simak10,
V. Sirotenko51, P. Skubic76, P. Slattery72, D. Smirnov56, J. Snow75, G.R. Snow68, S. Snyder74,
S. S¨oldner-Rembold45, L. Sonnenschein17, A. Sopczak43, M. Sosebee79, K. Soustruznik9,
M. Souza2, B. Spurlock79, J. Stark14, J. Steele61, V. Stolin37, D.A. Stoyanova39, J. Strandberg65,
S. Strandberg41, M.A. Strang70, M. Strauss76, E. Strauss73, R. Str¨ohmer25, D. Strom54, L. Stutte51,
S. Sumowidagdo50, P. Svoisky56, A. Sznajder3, M. Talby15, P. Tamburello46, A. Tanasijczuk1,
W. Taylor6, J. Temple46, B. Tiller25, F. Tissandier13, M. Titov18, V.V. Tokmenin36, T. Toole62,
I. Torchiani23, T. Trefzger24, D. Tsybychev73, B. Tuchming18, C. Tully69, P.M. Tuts71, R. Unalan66,
S. Uvarov40, L. Uvarov40, S. Uzunyan53, B. Vachon6, P.J. van den Berg34, R. Van Kooten55,
W.M. van Leeuwen34, N. Varelas52, E.W. Varnes46, I.A. Vasilyev39, M. Vaupel26, P. Verdier20,
L.S. Vertogradov36, M. Verzocchi51, F. Villeneuve-Seguier44, P. Vint44, P. Vokac10, E. Von Toerne60,
M. Voutilainen68,e, R. Wagner69, H.D. Wahl50, L. Wang62, M.H.L.S Wang51, J. Warchol56, G. Watts83,
M. Wayne56, M. Weber51, G. Weber24, A. Wenger23,f, N. Wermes22, M. Wetstein62, A. White79, D. Wicke26, G.W. Wilson59, S.J. Wimpenny49, M. Wobisch61, D.R. Wood64, T.R. Wyatt45, Y. Xie78,
S. Yacoob54, R. Yamada51, M. Yan62, T. Yasuda51, Y.A. Yatsunenko36, K. Yip74, H.D. Yoo78,
S.W. Youn54, J. Yu79, A. Zatserklyaniy53, C. Zeitnitz26, T. Zhao83, B. Zhou65, J. Zhu73,
M. Zielinski72, D. Zieminska55, A. Zieminski55,‡, L. Zivkovic71, V. Zutshi53, and E.G. Zverev38
(The DØ Collaboration)
1Universidad de Buenos Aires, Buenos Aires, Argentina 2
LAFEX, Centro Brasileiro de Pesquisas F´ısicas, Rio de Janeiro, Brazil 3
Universidade do Estado do Rio de Janeiro, Rio de Janeiro, Brazil 4Universidade Federal do ABC, Santo Andr´e, Brazil 5
6
University of Alberta, Edmonton, Alberta, Canada, Simon Fraser University, Burnaby, British Columbia, Canada, York University, Toronto, Ontario, Canada, and McGill University, Montreal, Quebec, Canada
7University of Science and Technology of China, Hefei, People’s Republic of China 8
Universidad de los Andes, Bogot´a, Colombia 9
Center for Particle Physics, Charles University, Prague, Czech Republic 10Czech Technical University, Prague, Czech Republic
11
Center for Particle Physics, Institute of Physics,
Academy of Sciences of the Czech Republic, Prague, Czech Republic 12
Universidad San Francisco de Quito, Quito, Ecuador 13
Laboratoire de Physique Corpusculaire, IN2P3-CNRS, Universit´e Blaise Pascal, Clermont-Ferrand, France 14
Laboratoire de Physique Subatomique et de Cosmologie, IN2P3-CNRS, Universite de Grenoble 1, Grenoble, France 15
CPPM, IN2P3-CNRS, Universit´e de la M´editerran´ee, Marseille, France 16
Laboratoire de l’Acc´el´erateur Lin´eaire, IN2P3-CNRS et Universit´e Paris-Sud, Orsay, France 17LPNHE, IN2P3-CNRS, Universit´es Paris VI and VII, Paris, France
18
DAPNIA/Service de Physique des Particules, CEA, Saclay, France 19
IPHC, Universit´e Louis Pasteur et Universit´e de Haute Alsace, CNRS, IN2P3, Strasbourg, France 20
IPNL, Universit´e Lyon 1, CNRS/IN2P3, Villeurbanne, France and Universit´e de Lyon, Lyon, France 21
III. Physikalisches Institut A, RWTH Aachen, Aachen, Germany 22Physikalisches Institut, Universit¨at Bonn, Bonn, Germany 23Physikalisches Institut, Universit¨at Freiburg, Freiburg, Germany
24
Institut f¨ur Physik, Universit¨at Mainz, Mainz, Germany 25
Ludwig-Maximilians-Universit¨at M¨unchen, M¨unchen, Germany 26Fachbereich Physik, University of Wuppertal, Wuppertal, Germany
27
Panjab University, Chandigarh, India 28
Delhi University, Delhi, India
29Tata Institute of Fundamental Research, Mumbai, India 30
University College Dublin, Dublin, Ireland 31
Korea Detector Laboratory, Korea University, Seoul, Korea 32SungKyunKwan University, Suwon, Korea
33
CINVESTAV, Mexico City, Mexico 34
FOM-Institute NIKHEF and University of Amsterdam/NIKHEF, Amsterdam, The Netherlands 35Radboud University Nijmegen/NIKHEF, Nijmegen, The Netherlands
36Joint Institute for Nuclear Research, Dubna, Russia 37
Institute for Theoretical and Experimental Physics, Moscow, Russia 38
Moscow State University, Moscow, Russia 39Institute for High Energy Physics, Protvino, Russia 40
Petersburg Nuclear Physics Institute, St. Petersburg, Russia 41
Lund University, Lund, Sweden, Royal Institute of Technology and Stockholm University, Stockholm, Sweden, and Uppsala University, Uppsala, Sweden
42
Physik Institut der Universit¨at Z¨urich, Z¨urich, Switzerland 43
Lancaster University, Lancaster, United Kingdom 44Imperial College, London, United Kingdom 45
University of Manchester, Manchester, United Kingdom 46
University of Arizona, Tucson, Arizona 85721, USA 47
Lawrence Berkeley National Laboratory and University of California, Berkeley, California 94720, USA 48
California State University, Fresno, California 93740, USA 49
University of California, Riverside, California 92521, USA 50
Florida State University, Tallahassee, Florida 32306, USA 51Fermi National Accelerator Laboratory, Batavia, Illinois 60510, USA
52
University of Illinois at Chicago, Chicago, Illinois 60607, USA 53
54
Northwestern University, Evanston, Illinois 60208, USA 55Indiana University, Bloomington, Indiana 47405, USA 56
University of Notre Dame, Notre Dame, Indiana 46556, USA 57
Purdue University Calumet, Hammond, Indiana 46323, USA 58Iowa State University, Ames, Iowa 50011, USA 59
University of Kansas, Lawrence, Kansas 66045, USA 60
Kansas State University, Manhattan, Kansas 66506, USA 61Louisiana Tech University, Ruston, Louisiana 71272, USA 62
University of Maryland, College Park, Maryland 20742, USA 63
Boston University, Boston, Massachusetts 02215, USA 64
Northeastern University, Boston, Massachusetts 02115, USA 65
University of Michigan, Ann Arbor, Michigan 48109, USA 66
Michigan State University, East Lansing, Michigan 48824, USA 67
University of Mississippi, University, Mississippi 38677, USA 68University of Nebraska, Lincoln, Nebraska 68588, USA 69
Princeton University, Princeton, New Jersey 08544, USA 70
State University of New York, Buffalo, New York 14260, USA 71Columbia University, New York, New York 10027, USA 72
University of Rochester, Rochester, New York 14627, USA 73
State University of New York, Stony Brook, New York 11794, USA 74
Brookhaven National Laboratory, Upton, New York 11973, USA 75
Langston University, Langston, Oklahoma 73050, USA 76
University of Oklahoma, Norman, Oklahoma 73019, USA 77Oklahoma State University, Stillwater, Oklahoma 74078, USA
78Brown University, Providence, Rhode Island 02912, USA 79
University of Texas, Arlington, Texas 76019, USA 80
Southern Methodist University, Dallas, Texas 75275, USA 81Rice University, Houston, Texas 77005, USA 82
University of Virginia, Charlottesville, Virginia 22901, USA and 83
University of Washington, Seattle, Washington 98195, USA (Dated: December 4, 2007)
We present new results of the search for W H → ℓνb¯b production in p¯pcollisions at a center of mass energy of√s= 1.96 TeV, based on a dataset with integrated luminosity of 0.44 fb−1. We combine these new results with previously published searches by the D0 collaboration, for W H and ZH production analyzed in the E/Tb¯bfinal state, for ZH (→ ℓ
+
ℓ−b¯b) production, for W H(→ W W W ) production, and for H (→ W W ) direct production. No signal-like excess is observed either in the W Hanalysis or in the combination of all D0 Higgs boson analyses. We set 95% C.L. (expected) upper limits on σ(p¯p → W H) × B(H → b¯b) ranging from 1.6 (2.2) pb to 1.9 (3.3) pb for Higgs boson masses between 105 and 145 GeV, to be compared to the theoretical prediction of 0.13 pb for a standard model (SM) Higgs boson with mass mH = 115 GeV. After combination with the other D0 Higgs boson searches, we obtain for mH = 115 GeV an observed (expected) limit 8.5 (12.1) times higher than the SM predicted Higgs boson production cross section. For mH= 160 GeV, the corresponding observed (expected) ratio is 10.2 (9.0).
PACS numbers: 13.85Qk,13.85.Rm
Spontaneous electroweak symmetry breaking in the standard model (SM) provides an explanation for the masses of the elementary particles, other-wise massless in the unbroken gauge theory. Its success, in particular in explaining the mass of the electroweak vector bosons, awaits one last but nec-essary experimental confirmation: the observation of the Higgs boson, which is a scalar particle
asso-ciated with the symmetry breaking. For Higgs bo-son searches, the most sensitive production chan-nel at the Tevatron for a Higgs boson with mass below 130 GeV is the associated production of a Higgs boson with a W boson. All possible chan-nels, however, must be studied to gain sensitivity through their combination.
three p¯p → W H searches have already been pub-lished or submitted for publication, one [1] using a subsample (0.17 fb−1) of the dataset used in this
letter, while the two others are from the CDF col-laboration: one uses 0.32 fb−1[2] of data, the other
updates it using improved analysis techniques and a larger dataset based on 1.0 fb−1 of integrated
luminosity [3].
For this W H analysis we require one high trans-verse momentum (pT) lepton (e or µ), missing
transverse energy E/T to account for the neutrino in the W boson decay, and exactly two jets with at least one of them being identified as originat-ing from a bottom (b) quark jet (“b-tagged”), as detailed below. The dominant backgrounds to W H production are W + heavy-flavor production, top quark pair production (t¯t), and single top quark production. This analysis uses a dataset of 0.44 fb−1. Compared to the previous D0 result,
the b-jet identification has been optimized, and the muon channel has been added.
The result of this search is then combined with previously published searches by the D0 collabo-ration with a similar luminosity. These searches cover W H and ZH production analyzed in the E/Tb¯b final state [4], ZH (→ ℓ+ℓ−b¯b)
produc-tion [5], W H(→ W W+W−) production [6], and
H (→ W+W−) direct production [7]. In the
fol-lowing, the particle charges will not be mentioned explicitly, except when needed to resolve potential ambiguity. We first describe the W H analysis in detail, then the full combination of results.
The W H analysis relies on the following compo-nents of the D0 detector [8, 9]:
i) a central-tracking system, which consists of a sil-icon microstrip tracker (SMT) and a central fiber tracker, both located within a 2 T superconduct-ing solenoidal magnet;
ii) a liquid-argon/uranium calorimeter with a cen-tral section (CC) covering pseudorapidity [10] |η| < 1.1, and two end calorimeters (EC) extend-ing coverage to |η| ≃ 3.2, all housed in separate cryostats, and with scintillators between the CC and EC cryostats providing sampling of develop-ing showers at 1.1 < |η| < 1.4;
iii) a muon system, which surrounds the calorime-ter and consists of a layer of tracking detectors and scintillation trigger counters before 1.8 T iron toroids, followed by two more similar layers behind
the toroids.
We reject data periods in which the quality of the data in the tracking, the calorimeter, or the muon system is compromised. The luminosity is measured using plastic scintillator arrays located in front of the EC cryostats, covering 2.7 < |η| < 4.4. The uncertainty on the measured luminosity is 6.1%. The W + jets candidate events must pass one of the triggers which require, for the e channel, at least one electromagnetic (EM) object, and for the µ channel, at least one muon object or a trigger requiring a muon and a jet in the final state.
The event selection for the W H analysis requires one lepton candidate with transverse momentum pT > 20 GeV, E/T > 25 GeV, and exactly two jets
with pT > 20 GeV and |η| < 2.5. Only events
having a primary z vertex within ± 60 cm of the nominal interaction point are accepted. If the lep-ton is an electron, it is required to have |η| < 1.1. If it is a muon the requirement is |η| < 2.0.
Electrons are identified in two steps. The pre-selected electron candidates (seeded by an energy cluster in the EM calorimeter) are first required to satisfy identification (ID) criteria: (a) a large fraction of their energy deposited in EM layers, i.e. EMF > 0.9, (b) low fractional energy posited around the expected electron energy de-position, and (c) spatial energy distribution in the EM calorimeter consistent with that of an elec-tron. These criteria define “loose” electrons. The loose electrons are then tested with a likelihood algorithm, optimized on Z → ee samples, and which takes as input seven quantities sensitive to the EM nature of the particles [11]. If they sat-isfy the likelihood requirement, they are accepted as final (“tight”) electrons for the analysis. The efficiencies of the ID and likelihood requirements are determined from a dielectron sample in which we select a pure set of Z events. The combined reconstruction and ID efficiency is found to be (95.4 ± 0.4)%. The likelihood efficiency for elec-trons is (92.0 ± 0.3)%.
Muons are reconstructed using information from the muon detector and the central tracker. They are required to have hits in all layers of the muon system inside and outside the toroid. The superior spatial resolution of the central tracker, inside the strong solenoidal magnetic field, is used to improve the accuracy of kinematic properties of the muon
and to confirm that the muon originated from the primary vertex. A veto against cosmic-ray muons based on the timing of hits in the muon-system scintillator detectors is applied. Quality criteria on the associated central track are also applied to reject the majority of background muons: a small track impact parameter (dca) compared to its resolution (σdca) is required, dca < 3σdca, to
reject muons originating from semi-leptonic decays of heavy-flavor hadrons which constitute the main background. Such background muons have a lower transverse momentum spectrum and are not typi-cally isolated due to jet fragmentation. A loose iso-lation criterion is defined using the spatial separa-tion ∆R =p(∆η)2+ (∆ϕ)2 between a muon and
the closest jet in the η–ϕ plane, where ϕ is the az-imuthal angle, we require ∆R > 0.5. Tighter muon isolation criteria are defined by requiring that the scalar sum of the transverse energy of calorime-ter cluscalorime-ters in a hollow cone (0.1 < ∆R < 0.4) around the muon divided by the pT of the muon
be less than 0.08, and the scalar sum of the trans-verse momenta of all tracks within a cone of radius ∆R = 0.5 around the muon divided by the pT of
the muon be less than 0.06. The track matched to the muon is excluded from this sum.
The jets are reconstructed using a cone algo-rithm [18] with a radius of ∆R = 0.5. We apply standard D0 jet-ID criteria to avoid fake jets which occasionally originate from noise in the calorime-ter, i.e., the energy fraction in the EM layers of a jet is required to be 0.05 < EMF < 0.95 and the energy fraction in the CH section of the calorimeter is required to be < 0.4. The difference in efficiency of the jet-ID requirements between data and simu-lation is quantified in the overall jet reconstruction efficiency scale factor to which a systematic uncer-tainty of 5% (per jet) is assigned.
The multijet background is estimated from the loose and tight e or µ final samples. as described in Ref. [11] using the following probabilities. We de-termine from the data the probability pmultijetloose→tight
for a “loose” lepton originating from a jet to pass the tight lepton requirements. This is done sepa-rately for the electron and the muon channel and this probability is determined as a function of the pT of the candidate lepton. The sample of
mul-tijet events containing a loose lepton is selected with kinematic criteria that ensure negligible
con-tamination of real leptons. We also determine the same type of probability psignalloose→tightfor a genuine isolated lepton from Z → ℓ+ℓ− samples. With
these two probabilities and the numbers of loose and tight W + 2 jet candidates, we determine the number of multijet background events in our sam-ple, bin-by-bin, for every differential distribution.
To select W boson decays, we require E/T>
25 GeV. The E/T is calculated from the
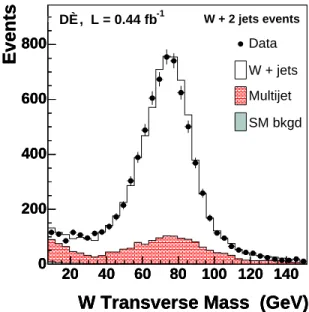
calorime-ter cells except for uncluscalorime-tered cells in the out-ermost layer of the calorimeter (coarse hadronic layer, CH) and is corrected when one or several muons are present. All energy corrections to elec-trons or jets are also propagated into the E/T. The transverse mass of the W boson candidates in the W + jets sample is reconstructed from the lepton and missing transverse energies. Its distribution is shown in Fig. 1 and compared with the sum of con-tributions from multijet events with misidentified leptons and from SM processes which are obtained from simulated events.
W Transverse Mass (GeV)
20 40 60 80 100 120 140
Events
0 200 400 600 800W Transverse Mass (GeV)
20 40 60 80 100 120 140
Events
0 200 400 600 800 -1 DØ, L = 0.44 fb W + 2 jets events Data W + jets Multijet SM bkgdW Transverse Mass (GeV)
20 40 60 80 100 120 140
Events
0 200 400 600 800FIG. 1: Distributions of the transverse W boson mass compared to the simulated expectation in the W + 2 jet event sample. The simulation is normalized to the integrated luminosity of the data sample using the ex-pected cross sections taking into account all the other backgrounds (the fraction of W H events is negligible before b-tagging).
The following processes are simulated with the pythia [12] MC event generator version 6.202, making use of the CTEQ5L [13] leading-order par-ton distribution functions: inclusive production of W → e/µ/τ + ν; Z → ee/µµ/ττ; W W, W Z, ZZ; t¯t → e/µ/τ + jets production (lepton+jets and dilepton channels), W H → e/µ/τ + ν + b¯b produc-tion. The single top quark processes are generated using comphep [14].
Throughout this Letter, “W +jets” simulated events refer to events with a W produced in as-sociation with light-flavor jets (originating from u, d, s quarks or gluons; generically denoted by j) or charm jets (originating from a c quark). They con-stitute the dominant background before b-tagging. and are generated with alpgen [15] (interfaced to pythia for showering and fragmentation), since alpgen has a more complete simulation of pro-cesses with high jet multiplicities. The generation is based on W + 2 jets (W jj) processes, includ-ing the charm quark (c) processes W c¯c and W cj. The W b¯b events are generated separately requiring two b parton jets with pT > 8 GeV separated by
∆R > 0.4; its NLO cross section is obtained using mcfm[16].
These simulated backgrounds are absolutely normalized (according to NLO cross sections) with the exception of the W + jets sample which is nor-malized to the data after subtraction of all the other backgrounds. The systematic uncertainty on the NLO cross sections of these processes is 6– 18%, depending on the process. All these events are processed through the D0 detector simulation, based on geant [17], and the reconstruction soft-ware. The simulated events are then weighted by the trigger efficiency and by the data/simulation ratio of all the selection efficiencies. The shape of the distribution of the transverse mass of the W candidates (Fig. 1) is well reproduced by the simulation of the W + jets processes, after adding the multijet background and the other SM back-grounds.
To identify heavy-flavor jets we use a b-tagging algorithm which computes a probability correlated to the b quark lifetime [19]. The requirements on the “jet lifetime probability” (JLIP) have been op-timized for events with one or two b-jet candidates by maximizing the sensitivity to the Higgs boson signal. The requirement is first set to 1%; if two
jets are tagged the event is selected as double b-tagged (DT). Otherwise the requirement is tight-ened to 0.1% and if exactly one jet is tagged the event is selected as single b-tagged (ST). In this way the single and double b-tagged subsamples are independent, which simplifies their combination. The mistag rate (tagging of light flavor jets) ob-tained in these samples are approximately equal to the corresponding JLIP requirements, while the efficiency for correctly identifying a genuine b jet (“b-tagging efficiency”) is (55 ±4)% and (33±4)%, respectively. These efficiencies were determined with central “taggable” jets (|η| < 1.2) having a transverse momentum of 35 < pT < 55 GeV. A jet
is “taggable” if at least 2 tracks (one with pT > 1
GeV, the other with pT > 0.5 GeV) and ≥ 1 SMT
hits are inside the ∆R < 0.5 cone defining the jet. The jet taggability is typically 80% in a two-jet sample with an uncertainty of 3%.
For each tagged jet in the simulation, we apply the ratio between the expected taggability times b-tagging efficiency in data and in simulation to reweight the simulated events. For the tagging ef-ficiency of simulated b or c jets, we use pT − η
dependent data vs. simulation scale factors, de-termined from real b jets [19]. In the simulation, the tagged light flavor jets are weighted to repro-duce the mistag rate as measured in data using dedicated samples [19].
With the above selection criteria, we observe 137 W + 2 jet events having exactly one b-tagged jet (ST sample) and 30 events having both jets b-tagged (DT sample). In these samples the multijet background is estimated using as a loose sample the W + 2 jet ST (DT) sample in which the lepton is selected using the loose lepton-ID criteria.The distribution of the invariant dijet mass of W + 2 jet events for the ST and DT samples is shown in Fig. 2a and b. The data are compared to the sum of the simulated SM processes added to the multi-jet background. The agreement indicates that the simulation describes the data well.
The different components of the background are shown in Table I. The small expected contribu-tions from a 115 GeV Higgs are also shown, but no excess above the standard model backgrounds is visible in these distributions, so we proceed to set limits from these distributions, after systematic uncertainty evaluation.
The experimental systematic uncertainties on the efficiencies and those due to to the propaga-tion of other systematic uncertainties (trigger, en-ergy calibration, detector response) which affect the signal and SM backgrounds are the following (ranges indicate different values for the e and µ channel): (2–3)% uncertainty from the trigger
Dijet Mass (GeV)
0 50 100 150 200 250 300Events
0 20 40
Dijet Mass (GeV)
0 50 100 150 200 250 300Events
0 20 40 -1 DØ, L = 0.44 fb W +1 b-tagged jet Data W + jets Multijet t t b Wb other WH 115 GeVDijet Mass (GeV)
0 50 100 150 200 250 300Events
0 20 40
Dijet Mass (GeV)
0 50 100 150 200 250 300Events
0 2 4 6 8Dijet Mass (GeV)
0 50 100 150 200 250 300Events
0 2 4 6 8 -1 DØ, L = 0.44 fb W + 2 b-tagged jets Data W + jets Multijet t t b Wb other WH 115 GeVDijet Mass (GeV)
0 50 100 150 200 250 300Events
0 2 4 6 8 (a) (b)FIG. 2: Dijet mass distributions for the W + 2 jet events (a) when exactly one jet is tightly b-tagged and (b) when the two jets are loosely b-tagged (see text). The data are compared to W b¯b, t¯t, W +jets and other smaller expectations. The background labeled as “other” in the figure is dominated by single top quark production.
W + 2 jet W + 2 jet W + 2 jet pre-tagged 1 b-tagged 2 b-tagged W H 2.3 ± 0.4 0.49 ± 0.07 0.43 ± 0.06 W W, W Z, ZZ 148.7 ± 23.8 5.3 ± 0.8 2.0 ± 0.4 W b¯b 116.3 ± 18.6 22.3 ± 4.4 14.4 ± 3.2 t¯t 87.6 ± 8.6 21.0 ± 4.3 12.6 ± 2.7 Single top 41.2 ± 5.3 10.0 ± 4.8 3.7 ± 0.7 Multijet 984 ± 153 22.8 ± 7.5 1.5 ± 0.6 W/Z + jets 6908 ± 1076 57.7 ± 10.3 4.1 ± 0.7 Total expect. 8286 139.6 ± 28.5 38.7 ± 5.8 Observed Ev. 8286 137 30
TABLE I: Summary table for the ℓ (e and µ) + 2 jets + E/T final state. Observed events in data are compared to the expected number of W + 2 jet events before and after b-tagging in the simulated samples of W H, di-bosons, W b¯b production, top production (t¯tand single top), multijet background, and “W /Z+ jets” produc-tion. In the pre-tagged sample the W /Z + jets contri-bution is normalized such that the total expectation is normalized to the data.
ciency, (3–4)% uncertainty for the lepton identifi-cation and reconstruction efficiency, (3–4)% for the lepton energy scale and resolution, 5% for the jet identification and reconstruction efficiency, 5% for the modeling uncertainty of the jet multiplicity in the simulation, (5–12)% due to the jet energy cali-bration uncertainty, 3% for the jet taggability, and (5–6)% for the b-tagging efficiency; for the light quark jets these uncertainties are 9% (DT) and 13% (ST). In summary, for W H production and simulated backgrounds, the experimental system-atic uncertainty is (16–19)%. The multijet back-ground, determined from data, has an uncertainty of 25%. The systematic uncertainty on the cross section of the simulated backgrounds is 6–18%, de-pending on the process. The uncertainty on the luminosity is 6.1%.
The limits for W H production are obtained us-ing the CLs method [20, 21] taking the dijet
in-variant mass of the b¯b system as the final dis-criminating variable. It is performed on the ST and DT samples of the e and µ channels inde-pendently (four analyses), which are then com-bined. The CLs approach is based on the
like-lihood ratio test statistic, Q = L(s + b)/L(b) =
e−(s+b)(s+b)n
n! /
e−b(b)n
(GeV) H m 105 110 115 120 125 130 135 140 145 LLR -0.6 -0.4 -0.2 0 0.2 0.4 0.6 LLRb 2-σ σ 1-b LLR b LLR s+b LLR obs LLR -1 DØ, L=0.4 fb ) Combination b b → , H ν l → WH (W
FIG. 3: LLR distributions obtained with the CLs method for the combination of the ST and DT samples in the W H channel.
pected numbers of signal and background events while n is the number of data events. For com-putational ease, the log-likelihood ratio LLR(n) = −2 ln(Q) is used. In order to exploit the shape in-formation of the final discriminating variable, as well as combine the different channels, the LLR values per bin and for all channels are added. Sys-tematic uncertainties are incorporated into the sig-nal and background expectation using Gaussian sampling of individual uncertainties. Correlations between uncertainties across channels are handled by varying simultaneously the fluctuations of iden-tical sources of all channels. The 95% C.L. lim-its are determined by raising the signal cross sec-tions until the ratio of probabilities for the sig-nal+background hypothesis to the background-only hypothesis falls below 5%.
Figure 3 shows the LLR distributions for the W H combined result. The LLR values for the signal+background hypothesis (LLRs+b),
background-only hypothesis (LLRb), and the
ob-served data (LLRobs) are shown. The quantities
LLRs+b, LLRb, and LLRobs are obtained by
set-ting n = s + b, b or n(observed) into LLR(n). The shaded bands represent the one and two stan-dard deviation (σ) departures for LLRb. These
distributions can be interpreted as follows: The separation between LLRb and LLRs+b provides a
measure of the discriminating power of the search; the width of the LLRbdistribution provides an
es-timate of the sensitivity of the analysis to a signal-plus-background-like fluctuation in data, taking account of the systematic uncertainties; the value
of LLRobsrelative to LLRs+band LLRbindicates
whether the data distribution appears to be more signal-like or background-like, and the significance of any departures of LLRobs from LLRb can be
evaluated by the width of the LLRb distribution.
The observed (expected) combined upper limits obtained at 95% C.L. on σ(p¯p → W H) × B(H → b¯b) range from 1.6 pb to 1.9 pb (2.2 pb to 3.3 pb) for Higgs boson masses between 105 and 145 GeV and are displayed in Fig. 4. They are also given in Table II together with the ST and DT subchan-nel limits and the ratios of all these limits to the predicted SM cross section. These new W H up-per limits are compared in Fig. 4 to the previ-ously published results on W H production from D0 on 0.17 fb−1 of data in the electron channel only [1] and CDF (0.32 fb−1 e+µ channels) [2].
The improvement in sensitivity obtained with this analysis is clearly visible in the region where the Tevatron is most sensitive to a Higgs boson with mass in the 115-135 GeV range. The result is also compared to the CDF result recently submitted for publication on 1.0 fb−1 of data [3], showing
comparable expected sensitivity when taking into
W H/ Higgs mass [GeV] 105 115 125 135 145 ST observed σ × B 6.62 5.74 5.17 4.79 4.74 ST expected σ × B 8.11 6.94 6.10 4.90 5.08 DT observed σ × B 2.21 2.12 2.25 1.98 1.97 DT expected σ × B 3.55 3.07 2.89 2.43 2.58 ST+DT observed σ × B 1.92 1.71 1.79 1.64 1.77 ST+DT expected σ × B 3.25 2.83 2.53 2.16 2.21 ST observed ratio to SM 34.9 44.9 65.5 112.8 250.7 ST expected ratio to SM 42.8 54.4 77.3 115.4 268.5 DT observed ratio to SM 11.7 16.6 28.5 46.6 104.1 DT expected ratio to SM 18.8 24.1 36.6 57.3 136.6 ST+DT obs. ratio to SM 10.1 13.4 22.6 38.6 93.4 ST+DT exp. ratio to SM 17.1 22.1 32.0 51.0 116.7
TABLE II: Observed and expected 95% C.L. limits on the cross section times branching fraction σ × B, where B = B(H → b¯b) and σ is in pb, for different Higgs boson mass values, for single and double b-tagged events, and ST+DT combination in the W H → ℓνb¯b channel, with ℓ = e or µ. The corresponding ratios to the predicted SM Higgs production cross section are also given.
account the difference in integrated luminosity. With the limits from the W H channels reported above, we now turn to the combination of these with limits previously obtained from other chan-nels. We combine our new W H results with all the other direct searches for SM Higgs bosons pub-lished by DØ. These are searches for Higgs bosons produced in association with vector bosons (p¯p → ZH → ν ¯νb¯b/ℓℓb¯b [4, 5], p¯p → W H → W W W [6]) or singly through gluon-gluon fusion (p¯p → H → W W [7]). The searches were conducted with data collected during the period 2003–2005 and cor-respond to integrated luminosities ranging from 0.30 fb−1 to 0.45 fb−1. They are separated into
twelve final states (adding to the four W H final states combined earlier) and referred to as analyses in the following. Each analysis is designed to iso-late a particular final state defined by a Higgs bo-son production and decay mode. To ensure proper combination of signals, the analyses were designed to be mutually exclusive.
The sixteen analyses are categorized by their production processes and outlined in Table III. When possible, we search for both H → b¯b and H → W W decays. For the H → b¯b decays, we conduct separate ST and DT analyses,
ex-Higgs Mass (GeV) 110 120 130 140 150 ) (pb) b b → B(H × WH) → p (p σ -1 10 1 10 b b ν l → WH (expected limit: - - - - ) , 95% C.L. limit) -1 (0.44 fb 0 D ) -1 ’05 (0.17 fb 0 D ) -1 CDF ’06 (0.32 fb ) -1 CDF ’07 (1.0 fb (expected limit: - - - - ) Standard Model
FIG. 4: 95% C.L. cross section upper limit (and cor-responding expected limit) on σ(p¯p → W H) × B(H → b¯b) (W boson decaying into a lepton + neutrino and Higgs boson into b¯b) vs. Higgs boson mass, compared to the SM expectation. The published D0 e channel observed results, based on an integrated luminosity of 0.17 fb−1 and the CDF (e + µ channels) results with 0.32 fb−1 and 1.0 fb−1are also shown.
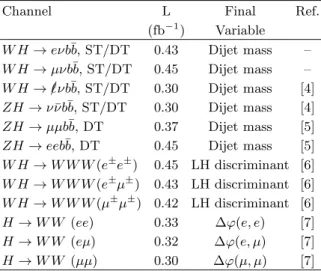
Channel L Final Ref.
(fb−1) Variable W H → eνb¯b, ST/DT 0.43 Dijet mass – W H → µνb¯b, ST/DT 0.45 Dijet mass – W H → ℓ/νb¯b, ST/DT 0.30 Dijet mass [4] ZH → ν ¯νb¯b, ST/DT 0.30 Dijet mass [4] ZH → µµb¯b, DT 0.37 Dijet mass [5] ZH → eeb¯b, DT 0.45 Dijet mass [5] W H → W W W (e± e± ) 0.45 LH discriminant [6] W H → W W W (e±µ±) 0.43 LH discriminant [6] W H → W W W (µ±µ±) 0.42 LH discriminant [6] H → W W (ee) 0.33 ∆ϕ(e, e) [7] H → W W (eµ) 0.32 ∆ϕ(e, µ) [7] H → W W (µµ) 0.30 ∆ϕ(µ, µ) [7]
TABLE III: List of analysis channels, corresponding in-tegrated luminosities (L), final variables for the search, and references. LH stands for likelihood.
cept for ZH → ℓ+ℓ−b¯b analyses where only the
DT analysis has been performed. The decays of the vector bosons further define the analyzed final states: W H → eνb¯b, W H → µνb¯b, ZH → eeb¯b, ZH → µµb¯b, and ZH → ν ¯νb¯b. There is a sizeable amount of W H → ℓνb¯b signal that can mimic the ZH → ν ¯νb¯b final state when the lepton is unde-tected, or when the lepton is a τ decaying hadron-ically. This case is treated as a separate W H anal-ysis, referred to as W H → ℓ/νb¯b.
We also include the analysis of W H → W W W final states when the associated W bo-son and the same-charged W bobo-son from the Higgs boson decay leptonically, thus defining six final states: W H → W e±νe±ν, W e±νµ±ν, and
W µ±νµ±ν, which are then grouped into three
analyses: e±e±, µ±µ±, and e±µ±. All decays of
the third W boson are included.
In the case of p¯p → H → W W production, we again search for leptonic W boson decays with three final states, W W → eνeν, eνµν, and µνµν. For the gluon-gluon fusion process, H → b¯b de-cays are not considered due to the large multijet background.
As before, we combine results using the CLs
method. Systematic uncertainties are treated as uncertainties on the expected numbers of signal and background events, not on the outcomes of the limit calculations. This approach ensures
that the uncertainties and their correlations are propagated to the outcome with their proper weights. The method used here utilizes binned final-variable distributions rather than a single-bin (fully-integrated) value. In the case of the H → b¯b analyses, the final variable used for limit setting is the invariant dijet mass, as shown for the W H channel in Fig. 2. In the case where H → W W , the Higgs mass cannot be directly reconstructed due to the neutrinos in the final state. Thus, the W H → W W W analysis uses a likelihood (LH) discriminant formed from topo-logical variables as a final variable [6], while the p¯p → H → W W analysis uses the separation in ϕ between the final state leptons ∆ϕ(ℓ1, ℓ2) [7]. Each
signal and background final variable is smoothed via Gaussian kernel estimation [22].
Both signal and background systematic uncer-tainties vary for the different analyses. Here we summarize only the largest contributions, referring to the original publications for details. All analyses carry an uncertainty on the integrated luminosity of 6.1%. The H → b¯b analyses have an uncertainty on the b-tagging rate of (5–7)% per tagged jet. These analyses also have an uncertainty on the jet energy calibration and acceptances of 8–10%. For the H → W W and W H → W W W analyses, the largest experimental uncertainties are associated with lepton measurement and acceptances. These values range from (3–8)% depending on the final state. The largest contribution for all analyses is the uncertainty on the background cross sections at (6–19)% depending on the background. The uncertainty on the expected multijet background is dominated by the statistics of the data sample from which it is estimated, hence is uncorrelated between analyses. The systematic uncertainties for the background rates are generally several times larger than the signal expectation itself and are thus an important factor in the calculation of lim-its. As such, each systematic uncertainty is folded into the signal and background expectations via Gaussian distribution. Correlations between sys-tematic sources are carried through in the calcula-tion. All systematic uncertainties originating from a common source, see Table IV, are taken to be correlated.
To minimize the effect of systematic uncertain-ties on the search sensitivity, the individual
back-W H, eνb¯b W H, µνb¯b W W, Source DT(ST) DT(ST) W W W Luminosity (%) 6 6 6 Jet Calibration (%) 4 5 3 Jet ID (%) 7 7 0 Electron ID (%) 7 0 2 Muon ID (%) 0 5 8 b-tagging (%) 9(5) 9(5) 0 Background σ (%) 6–19 6–19 6–19 Source ZH → ν ¯νb¯b ZH → eeb¯b ZH → µµb¯b DT(ST) Luminosity (%) 6 6 6 Jet Calibration (%) 6 7 7 Jet ID (%) 7 7 5 Electron ID (%) 0 8 0 Muon ID (%) 0 0 12 b-tagging (%) 10(7) 12 12 Background σ (%) 6–19 6–19 6–19
TABLE IV: List of leading correlated systematic un-certainties. The values for the systematic uncertain-ties are the same for the ZH → ν ¯νb¯b and W H → ℓ
/νb¯b channels. Each uncertainty is considered to be 100% correlated across channels. The correlated sys-tematic uncertainty on the background cross section (σ) is itself subdivided according to the different back-ground processes in each analysis.
ground contributions are fitted to the data ob-servation by minimizing a profile likelihood func-tion [21]. The fit computes the optimal central val-ues for the systematic uncertainties, while account-ing for departures from the nominal predictions by including a term in the χ2function which sums the
squared deviation of each systematic uncertainty in units normalized by its ±1σ uncertainties. A fit is performed to the background-only hypothesis and is constrained to bins with a signal expectation smaller than 4% of the total expected background. To set limits on Higgs boson production (σ × B(H → X)) the sixteen analyses are first grouped by final state to produce individual results. We then group channels by production modes to form combined results and study their respective sen-sitivities. The individual analyses are grouped to form the LLR distributions shown in Fig. 5 for (a) all W H searches, with H → b¯b (ST, DT) in the low mass range (mH = 105 − 145 GeV), (b)
all ZH searches (ST, DT) in the same low mass range, (c) all W H → W W W searches, over an extended mass range (mH = 120 − 200 GeV), and
(GeV) H m 105 110 115 120 125 130 135 140 145 LLR -0.6 -0.4 -0.2 0 0.2 0.4 0.6 σ 2-b LLR σ 1-b LLR b LLR s+b LLR obs LLR -1 DØ, L=0.4 fb ) Combination b b → WH (H (GeV) H m 105 110 115 120 125 130 135 140 145 LLR -0.4 -0.2 0 0.2 0.4 σ 2-b LLR σ 1-b LLR b LLR s+b LLR obs LLR -1 DØ, L=0.4 fb ) Combination b b → ZH (H (GeV) H m 120 130 140 150 160 170 180 190 200 LLR -0.3 -0.2 -0.1 0 0.1 0.2 0.3 σ 2-b LLR σ 1-b LLR b LLR s+b LLR obs LLR -1 DØ, L=0.4 fb -W + W W → WH (GeV) H m 100 110 120 130 140 150 160 170 180 190 200 LLR -0.8 -0.6 -0.4 -0.2 -0 0.2 0.4 0.6 0.8 σ 2-b LLR σ 1-b LLR b LLR s+b LLR obs LLR -1 DØ, L=0.3 fb -W + W → H (a) (b) (c) (d)
FIG. 5: LLR distributions obtained with the CLs method for the associated production of (a) W H(H → b¯b), (b) ZH(H → b¯b), (c) W H(H → W W ), and (d) for the direct production channel, H → W W . See text for details. (GeV) H m 100 110 120 130 140 150 160 170 180 190 200 LLR -1 -0.5 0 0.5 1 σ 2-b LLR σ 1-b LLR b LLR s+b LLR obs LLR -1 DØ, L=0.4 fb SM Higgs Combination
FIG. 6: LLR distributions obtained with the CLs method for the combination of all channels. See text for details.
(d) all H → W W searches, over the full mass range (mH = 100 − 200 GeV). We then combine groups
(a)–(d) over the full mass range, as shown in Fig. 6. We also compute our results in terms of the ratio of the limits to the SM cross section σ×B(H → X) as a function of Higgs boson mass. The SM pre-diction for Higgs boson production would therefore be excluded at 95% C.L. when this limit ratio falls below unity. Table V shows the expected and observed 95% C.L. cross section limits and their ratios to the SM for the W H and ZH analyses in the mass range mH = 105 − 145 GeV. Table VI
shows the same information for W H → W W W
Higgs mass [GeV] 105 115 125 135 145 WH observed σ × B 1.60 1.49 1.57 1.56 1.65 WH expected σ × B 2.83 2.38 2.22 1.89 2.17 ZH observed σ × B 2.41 2.23 1.97 1.77 3.21 ZH expected σ × B 2.21 2.02 1.73 1.52 2.65 WH observed ratio to SM 8.4 11.7 19.8 36.7 87.2 WH expected ratio to SM 14.9 18.6 28.1 44.5 114.7 ZH observed ratio to SM 21.1 28.5 40.0 66.0 263.6 ZH expected ratio to SM 19.4 25.9 35.2 56.6 217.4
TABLE V: Observed and expected 95% C.L. upper limits on the cross section times branching fraction σ × B, where B = B(H → b¯b), and σ is in pb, for dif-ferent Higgs boson mass values, for the W H and ZH combined channels (W H includes the leptonic chan-nels, and the case where the charged lepton is not de-tected; ZH includes the ee,µµ, and νν channels).
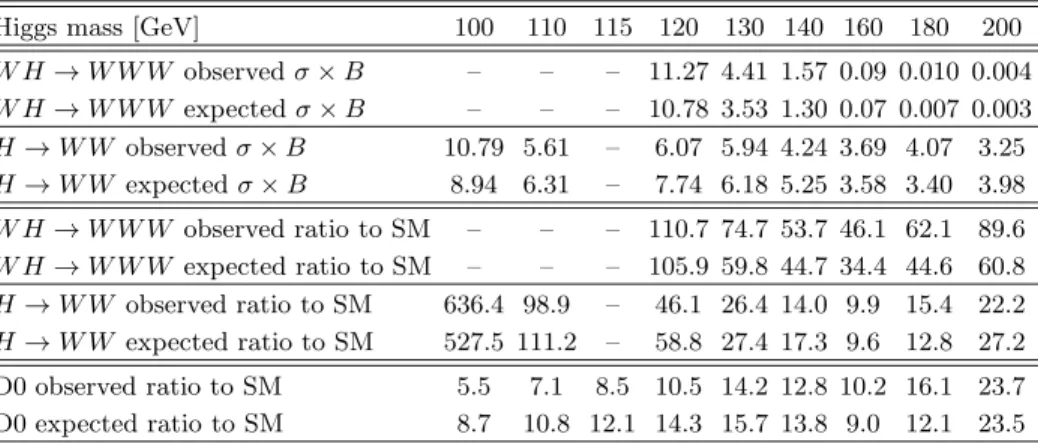
Higgs mass [GeV] 100 110 115 120 130 140 160 180 200 W H → W W W observed σ × B – – – 11.27 4.41 1.57 0.09 0.010 0.004 W H → W W W expected σ × B – – – 10.78 3.53 1.30 0.07 0.007 0.003 H → W W observed σ × B 10.79 5.61 – 6.07 5.94 4.24 3.69 4.07 3.25 H → W W expected σ × B 8.94 6.31 – 7.74 6.18 5.25 3.58 3.40 3.98 W H → W W W observed ratio to SM – – – 110.7 74.7 53.7 46.1 62.1 89.6 W H → W W W expected ratio to SM – – – 105.9 59.8 44.7 34.4 44.6 60.8 H → W W observed ratio to SM 636.4 98.9 – 46.1 26.4 14.0 9.9 15.4 22.2 H → W W expected ratio to SM 527.5 111.2 – 58.8 27.4 17.3 9.6 12.8 27.2 D0 observed ratio to SM 5.5 7.1 8.5 10.5 14.2 12.8 10.2 16.1 23.7 D0 expected ratio to SM 8.7 10.8 12.1 14.3 15.7 13.8 9.0 12.1 23.5
TABLE VI: Observed and expected 95% C.L. upper limits on the cross section times branching fraction σ × B, where B = B(H → W W ) and σ is in pb, for different Higgs boson mass values, for W H → W W W and H → W W . The ratios to the predicted values of the SM Higgs production cross section for these channels and for the full D0 combination, are also given.
and H → W W over the full mass range. The ra-tios to the SM obtained with the full combination are also given and show the gain obtained by using the full information, compared to the individual channels.
The expected limits for the cross section times branching fraction for the four groups of analyses (a)–(d) and for the full combination, relative to the SM expectations, are shown in Fig. 7. For the full combination of all analyses, the expected and ob-served cross section times branching ratio, relative
(GeV) H m 110 120 130 140 150 160 170 180 190 200 ) -W + /W b b → BR(H × WH/ZH/H) → p (p σ Limit / 1 10 2 10 Expected b b ν l → WH Expected b b ν ν ll/ → ZH Expected -W + WW → WH Expected -W + W → H
Full Combination Expected
Standard Model = 1.0
-1 DØ, L=0.4 fb
FIG. 7: Ratios of the expected limit on the Higgs bo-son production cross section times branching fraction to the SM expectation, for the different channel groups and for the full D0 combination.
to those for the SM, are shown in Fig. 8. Com-pared to an earlier simulation study of the Higgs boson search sensitivity conducted prior to Teva-tron Run II [24], our current analyses have added new channels, have extended the mass range, and show a more uniform sensitivity for 110 < mH <
190 GeV.
In summary, we have presented new 95% C.L. limits on the W H → e/µνb¯b production cross sec-tion times branching fracsec-tion which range from 1.6 to 1.9 pb for 105 < mH < 145 GeV. For
(GeV) H m 100 110 120 130 140 150 160 170 180 190 200 ) -W + /W b b → BR(H × WH/ZH/H) → p (p σ Limit / 0 5 10 15 20 25 -1 DØ, L=0.4 fb SM Higgs Combination Observed Limit Expected Limit Standard Model = 1.0
FIG. 8: Ratios of the expected and observed limit on the Higgs boson production cross section times branch-ing fraction to the SM expectation, for the full D0 com-bination.
ison, the expected SM cross section for mH =115
GeV is 0.13 pb.
We have then combined these results with all previously published Higgs boson searches by the D0 collaboration obtained with a similar luminos-ity (between 0.30 and 0.45 fb−1) to form new
lim-its more sensitive than each individual limit. The combined observed (expected) 95% C.L. limit ra-tios to SM cross sections for p¯p → W H, H → b¯b range from 11.7 (18.6) at mH = 115 GeV to
36.7 (44.5) at mH = 135 GeV. The combined
observed (expected) 95% C.L. limit ratios to SM cross sections for p¯p → ZH, H → b¯b range from 28.5 (25.9) at mH = 115 GeV to 66.0 (56.7) at
mH = 135 GeV. The fully combined observed
(ex-pected) 95% C.L. limit ratio to the SM cross sec-tions are 8.5 (12.1) at mH = 115 GeV, 10.2 (9.0) at
mH = 160 GeV, and 20.7 (16.0) at mH = 190 GeV.
These limits and ratios will decrease in the near future with the additional luminosity recorded at the Tevatron; more than 2 fb−1 are currently
be-ing analyzed. New techniques are bebe-ing developed to improve the sensitivity through advanced multi-variate techniques, neural-network b-tagging, and improved di-jet mass resolution. In addition, an anticipated combination with the results from the CDF collaboration would yield an increase in sen-sitivity of about 40%. With the total expected in-tegrated luminosity (6–8 fb−1), the Tevatron is
ex-pected to provide sensitivity to the standard model Higgs boson beyond the current LEP limit [25]
We thank the staffs at Fermilab and collaborat-ing institutions, and acknowledge support from the DOE and NSF (USA); CEA and CNRS/IN2P3 (France); FASI, Rosatom and RFBR (Russia); CAPES, CNPq, FAPERJ, FAPESP and FUN-DUNESP (Brazil); DAE and DST (India); Col-ciencias (Colombia); CONACyT (Mexico); KRF and KOSEF (Korea); CONICET and UBACyT (Argentina); FOM (The Netherlands); Science and Technology Facilities Council (United King-dom); MSMT and GACR (Czech Republic); CRC Program, CFI, NSERC and WestGrid Project (Canada); BMBF and DFG (Germany); SFI (Ire-land); The Swedish Research Council (Sweden); CAS and CNSF (China); Alexander von Humboldt Foundation;
[a] Visitor from Augustana College, Sioux Falls, SD, USA.
[b] Visitor from The University of Liverpool, Liver-pool, UK.
[c] Visitor from ICN-UNAM, Mexico City, Mexico. [d] Visitor from II. Physikalisches Institut,
Georg-August-University G¨ottingen, Germany.
[e] Visitor from Helsinki Institute of Physics, Helsinki, Finland.
[f] Visitor from Universit¨at Z¨urich, Z¨urich, Switzer-land.
[†] Fermilab International Fellow. [‡] Deceased.
[1] D0 Collaboration, V.M.. Abazov et al., Phys. Rev. Lett. 94, 091802 (2005).
[2] CDF Collaboration, D. Acosta et al., Phys. Rev. Lett. 94, 091802 (2005).
[3] CDF Collaboration, T. Aaltonen et al., submitted to Phys. Rev. Lett., [arXiv:0710.4363] (2007). [4] D0 Collaboration, V.M. Abazov et al., Phys. Rev.
Lett. 97, 161803 (2006).
[5] D0 Collaboration, V.M. Abazov et al., Phys. Lett. B 655, 209 (2007).
[6] D0 Collaboration, V.M. Abazov et al., Phys. Rev. Lett. 97, 151804 (2006).
[7] D0 Collaboration, V.M. Abazov et al., Phys. Rev. Lett. 96, 011801 (2006).
[8] D0 Collaboration, V.M. Abazov et al., Nucl. In-strum. and Methods A 338, 185 (1994).
[9] D0 Collaboration, V.M. Abazov et al., Nucl. Instr. and Methods A 565, 463 (2006).
[10] The pseudorapidity is defined as a function of the polar angle θ as η ≡ − ln(tanθ
2).
[11] D0 Collaboration, V.M. Abazov et al., submitted to Phys. Rev. D, arXiv:0705.2788.
[12] T. Sjostrand et al., Comput. Phys. Commun. 135, 238 (2001).
[13] H. L. Lai et al., Phys. Rev. D55 (1997) 1280. [14] A. Pukhov et al., [arXiv:hep-ph/9908288] (1999). [15] M. Mangano et al.,[arXiv:hep-ph/0206293] (2002). [16] J. Campbell and K. Ellis, mcfm , Montecarlo for
FeMtobarn processes, http://mcfm.fnal.gov/ [17] R. Brun and F. Carminati, CERN Program
Li-brary Long Writeup W5013, 1993 (unpublished). [18] G. Blazey et al., in Proceedings of the
work-shop “QCD and Weak Boson Physics in Run II” edited by U. Baur, R.K. Ellis, and D. Zeppenfeld, Batavia (2000), p. 47.
[19] S. Greder, b quark tagging and cross-section measurement in quark pair production at DØ, FERMILAB-THESIS-2004-28 (2004).
[20] T. Junk, Nucl. Instrum. and Methods A 434, 435 (1999).
[21] W. Fisher, FERMILAB-TM-2386-E (2007). [22] K. S. Cranmer, Comput. Phys. Commun. 136, 198
(2001) [arXiv:hep-ph/0011057].
[23] A. Read, Nucl. Instrum. and Methods A 425, 357 (1999).
[24] M. Carena et al., [arXiv:hep-ph/0010338] (2000). [25] ALEPH, DELPHI, L3 and OPAL Collabora-tions, The LEP Working Group for Higgs Boson Searches, Phys. Lett. B 565, 61 (2003).