Publisher’s version / Version de l'éditeur:
Vous avez des questions? Nous pouvons vous aider. Pour communiquer directement avec un auteur, consultez la première page de la revue dans laquelle son article a été publié afin de trouver ses coordonnées. Si vous n’arrivez Questions? Contact the NRC Publications Archive team at
[email protected]. If you wish to email the authors directly, please see the first page of the publication for their contact information.
https://publications-cnrc.canada.ca/fra/droits
L’accès à ce site Web et l’utilisation de son contenu sont assujettis aux conditions présentées dans le site LISEZ CES CONDITIONS ATTENTIVEMENT AVANT D’UTILISER CE SITE WEB.
Building and Environment, 159, 2019-05-17
READ THESE TERMS AND CONDITIONS CAREFULLY BEFORE USING THIS WEBSITE. https://nrc-publications.canada.ca/eng/copyright
NRC Publications Archive Record / Notice des Archives des publications du CNRC :
https://nrc-publications.canada.ca/eng/view/object/?id=8e77d138-bc74-4c71-bc41-c81df25cbfb6
https://publications-cnrc.canada.ca/fra/voir/objet/?id=8e77d138-bc74-4c71-bc41-c81df25cbfb6
Archives des publications du CNRC
This publication could be one of several versions: author’s original, accepted manuscript or the publisher’s version. / La version de cette publication peut être l’une des suivantes : la version prépublication de l’auteur, la version acceptée du manuscrit ou la version de l’éditeur.
For the publisher’s version, please access the DOI link below./ Pour consulter la version de l’éditeur, utilisez le lien DOI ci-dessous.
https://doi.org/10.1016/j.buildenv.2019.05.032
Access and use of this website and the material on it are subject to the Terms and Conditions set forth at
Opportunistic occupancy-count estimation using sensor fusion: a case
study
Hobson, Brodie W.; Lowcay, Daniel; Gunay, H. Burak; Ashouri, Araz;
Newsham, Guy R.
Opportunistic occupancy-count estimation using sensor fusion: A case study
Brodie W. Hobson, Daniel Lowcay, H. Burak Gunay, Araz Ashouri, Guy R. Newsham PII: S0360-1323(19)30350-6
DOI: https://doi.org/10.1016/j.buildenv.2019.05.032
Reference: BAE 6154
To appear in: Building and Environment
Received Date: 20 January 2019 Revised Date: 27 April 2019 Accepted Date: 16 May 2019
Please cite this article as: Hobson BW, Lowcay D, Gunay HB, Ashouri A, Newsham GR, Opportunistic occupancy-count estimation using sensor fusion: A case study, Building and Environment (2019), doi:
https://doi.org/10.1016/j.buildenv.2019.05.032.
This is a PDF file of an unedited manuscript that has been accepted for publication. As a service to our customers we are providing this early version of the manuscript. The manuscript will undergo copyediting, typesetting, and review of the resulting proof before it is published in its final form. Please note that during the production process errors may be discovered which could affect the content, and all legal disclaimers that apply to the journal pertain.
M
A
NUS
C
R
IP
T
A
C
C
E
P
TE
D
Main Address:
Carleton University
Department of Civil and Environmental Engineering
1125 Colonel by Drive
Ottawa, Ontario, Canada K1S 5B6
Email: [email protected]
Tel: +1 613 520 2600 x 3357
Fax: +1 613 520 3951
M
A
NUS
C
R
IP
T
A
C
C
E
P
TE
D
M
A
NUS
C
R
IP
T
A
C
C
E
P
TE
D
Opportunistic occupancy-count estimation using sensor fusion: A case
1study
2Brodie W. Hobson1, Daniel Lowcay1, H. Burak Gunay1, Araz Ashouri2, Guy R. Newsham2 3
1
Department of Civil and Environmental Engineering, Carleton University, Ottawa, Canada 4
2
Construction Research Centre, National Research Council Canada, Ottawa, Canada 5
Abstract
6
Estimation of occupancy counts in commercial and institutional buildings enables enhanced energy-use 7
management and workspace allocation. This paper presents the analysis of cost-effective, opportunistic data 8
streams from an academic office building to develop occupancy-count estimations for HVAC control purposes. 9
Implicit occupancy sensing via sensor fusion is conducted using available data from Wi-Fi access points, CO2
10
sensors, PIR motion detectors, and plug and light electricity load meters, with over 200 hours of concurrent 11
ground truth occupancy counts. Multiple linear regression and artificial neural network model formalisms are 12
employed to blend these individual data streams in an exhaustive number of combinations. The findings suggest 13
that multiple linear regression models are the superior model formalism when model transferability between 14
floors is of high value in the case study building. Wi-Fi enabled device counts are shown to have high utility for 15
occupancy-count estimations with a mean R2 of 80.1 to 83.0% compared to ground truth counts during occupied 16
hours. Aggregated electrical load data are shown to be of higher utility than separately submetered plug and 17
lighting load data. 18
Keywords: Occupancy detection; Occupancy-count estimation; Sensor fusion; Occupancy-centric controls 19
1.
Introduction
20
It is estimated that 15 to 30% of the energy used by heating, ventilation, and air conditioning (HVAC) 21
systems in commercial and institutional buildings is wasted due to inefficiencies in their operation [1-3]. 22
Considering that HVAC systems in said buildings account for ~15% of the secondary energy use and ~10% of 23
greenhouse gas (GHG) emissions [3], improvements to their operation represent a key opportunity to reduce 24
global energy consumption and CO2 emissions.
25
As stated by Shen et al. [4], the key to improving the operation of HVAC systems is to provide heating, 26
cooling, and ventilation only when and where they are needed, in the amount that they are needed. Notably, this 27
is inherently dependant upon having access to high-resolution occupancy information. By knowing the first 28
arrival and the last departure times, one can schedule the HVAC start and stop times and/or apply temperature 29
setbacks. By knowing the number of occupants, one can adapt the ventilation rates (i.e., demand control 30
ventilation). Implementation of such occupancy-centric control strategies are reported to achieve energy savings 31
of 18 [5] to 55% [6] depending on the building archetype and climatic conditions. Further, occupancy-centric 32
HVAC controls are reported to reduce the peak energy demand by diversifying the HVAC needs of individual 33
zones [7]. 34
Despite the importance of high-resolution occupancy information for energy efficient HVAC operation, 35
there is no perfect, cost-effective sensor to count the number of occupants in a building accurately and non-36
intrusively. However, sensor fusion is a promising statistical approach to combine imperfect information from 37
disparate data sources [8]. Rather than deploying sensors dedicated for occupancy detection, sensor fusion can 38
take advantage of pre-existing data streams (e.g., Wi-Fi access points, CO2 sensors, motion detectors, electrical
M
A
NUS
C
R
IP
T
A
C
C
E
P
TE
D
load meters) that are commonly available in existing buildings and expected to be correlated with occupancy, 1
allowing for cost-effective occupancy-count estimations. This opportunistic approach is referred to as implicit 2
occupancy sensing [9]. 3
This paper focuses on using implicit occupancy sensing via sensor fusion models to develop occupancy-4
count estimations for HVAC control purposes. By using the Wi-Fi device count, CO2 concentration, passive
5
infrared (PIR) motion detector trigger, plug load, and lighting load data from an academic office building, 6
multiple linear regression and artificial neural network (ANN) models are developed to estimate occupancy 7
counts. These estimates are compared to ground truth data. The effectiveness of different sensors, sensor 8
combinations, and the model formalisms for the purpose of occupancy-count estimation is discussed. The 9
transferability of models developed in one floor and used in another is explored in the case study building 10
throughout. Criteria are put forward for selecting the most suitable model for occupancy-count estimation, and 11
these models are identified for the case study building given the data examined. The data used in this study have 12
been made publicly available as a supplemental file to facilitate the development and validation of different 13
occupancy sensing methods. 14
The remainder of this paper is structured as follows: Section 2 examines the state-of-the-art in the field of 15
occupancy sensing; Section 3 introduces the dataset and methodology; Section 4 presents the experimental 16
results; Section 5 discusses the findings, limitations, and develops future work recommendations. 17
2.
Literature Review
18
Traditional occupancy sensing technologies have numerous shortcomings. A majority of occupancy sensors 19
are motion detectors (e.g., PIRs or ultrasonic motion detectors); thus, they can only detect presence, not the 20
number of occupants in a space. These sensors are also unable to distinguish between a lack of movement and an 21
absence of occupants, which can lead to false vacancy detections if the time-out period is too short [10-13]. 22
Increasing the time-out period of 5 to 60 minutes after the last detected movement could reduce the frequency of 23
false vacancy detections [14]. However, increasing the length of this time-out period also increases the 24
possibility of false occupancy detections; this trade-off reduces the savings potential. Additionally, if the sensor 25
detects a motion and activates building services such as lighting, the occupants may deem this undesirable and 26
resort to methods of disabling the motion detector, such as intentionally blocking the sensor to obstruct its line-27
of-sight [15, 16]. This will either diminish or completely negate the sensors’ functional purpose. Furthermore, 28
because motion detectors require a direct line-of-sight to detect occupants, they need to be deployed in a fine 29
grid to ensure their field-of-view is not obstructed by architectural partitions or furniture; this dense 30
configuration incurs additional cost both for the sensors and labour. To address the binary nature of PIR sensors, 31
Wahl et al. [11] proposed a system whereby PIR sensors were installed on either side of a door at the lintel level. 32
This configuration produced an analogue output that could be used to determine if an occupant was entering or 33
leaving the studied space. The system kept track of the net occupancy within the space of interest. However, this 34
system suffered from inaccuracies when multiple occupants move through the door simultaneously, if two or 35
more occupants moved in opposite directions, or if individuals or crowds gathered on either side of the door 36
within the sensors’ range. Liu et al. [12] also used PIR sensor data combined with a hidden Markov model to 37
predict room level occupancy with accuracies ranging from 81% to 97%. However, this required a dense sensor 38
grid and computationally expensive computer algorithms that are only applicable to the studied space. Similarly, 39
Duarte et al. [13] proposed a network of PIR sensors to establish occupancy patterns in an office building 40
M
A
NUS
C
R
IP
T
A
C
C
E
P
TE
D
testbed. While this system was able to establish high-level occupancy patterns, the resolution was not high 1
enough to develop zone-level HVAC control strategies and required a dense sensor grid. The first-cost of 2
installing such a granular PIR system has deterred implementation of these systems in spaces outside those 3
required by codes – such as the National Energy Code for Buildings in Canada and ANSI/ASHRAE 90.1. This 4
shows that the method by which motion detectors are implemented currently is not appropriate for occupancy-5
count estimation for HVAC control purposes. As such, some researchers have turned to the use of CO2 sensors
6
for inferring occupancy levels [6, 17]. However, problems have been noted with calibrating the models to 7
account for the latency between occupants’ arrival/departure and the corresponding increase/decrease in CO2
8
concentration, as well as the sensitivity of this technology to sensor position and reading accuracy. 9
As such, significant research over the past decade has focused on occupancy-detection studies using new 10
sensor technologies explicitly built for occupancy counting. Many of these technologies involve optical [5, 18-11
23] and/or infrared [5, 20, 21] camera-based technologies coupled with complex image recognition algorithms. 12
However, many of these studies are limited to a single room office-type occupancy [5, 18, 20] with a limited 13
number of occupants to monitor. Even with low occupancy, Cao et al. [5] specifically note that significant 14
computational resources are required for this type of image processing approach. The first-cost attached to these 15
sensors and the related infrastructure, as well as the labour required to integrate them into an existing building 16
automation system (BAS) cannot be neglected. Additionally, the algorithms used to extract the occupant count 17
from the camera-based sensors can suffer from inaccuracies when numerous occupants enter the frame, or if 18
occupants are moving too quickly to be captured by the camera’s framerate, which is typically reduced to a 19
frame every couple of seconds to reduce the computational resources needed for real-time processing [5, 18-23]. 20
Like motion detectors, this system cannot detect occupants that are outside the cameras line-of-sight, 21
necessitating numerous well-placed sensors if adequate occupancy counting is to be expected. Cameras also 22
inherently raise questions about privacy. Although these studies make use of methods to pixilate and analyze 23
images without compromising occupant identity, it has been shown that even a perceived threat to privacy 24
associated with monitoring technologies such as cameras can deter the implementation of said systems [16]. Due 25
to these many challenges and shortcomings, Petersen et al. [21] acknowledge that the applications of these 26
technologies should be limited to gathering ground truth data until more robust and privacy conscious occupancy 27
counting methods are developed. 28
Another technology used in occupancy-detection studies is radio-frequency identification (RFID) tags. 29
Carreira et al. [24] used RFID tags and a web-based application to track occupants and their vote to raise or 30
lower the room temperature by 1˚C. Li et al. [25] also used RFID tags to gather information about occupants’ 31
location and identity. These studies showed that RFID devices do not suffer from the same line-of-sight pitfalls 32
as motion and camera-based sensors, however, their direct tracking of individual occupants’ movements only 33
exacerbate security and privacy concerns. The cost of implementing these sensors and their integration into the 34
BAS are similarly a barrier to their deployment and implementation when compared to camera-based sensors, 35
although Li et al. [25] note that sensor cost has decreased substantially over the past several years. Other 36
proposed proprietary sensing methods include using electrical load data to characterize occupancy. Akbar et al. 37
[26] applied k-nearest neighbor (KNN) or support vector machine (SVM) machine learning classification 38
algorithms on data from a ZigBee smart energy unit, which submeters electrical loads down to the appliance 39
used at the desk level. It was found that this method could detect whether an occupant was present or absent 40
from their desk with 94% accuracy. Labeodan et al. [27] deployed an office chair with various sensing 41
M
A
NUS
C
R
IP
T
A
C
C
E
P
TE
D
technologies that allowed it to detect when the occupant was seated. However, in both these cases, the scalability 1
of this method is questionable as every workstation would require an additional sensing unit; this method would 2
also only work in cases where every occupant has a desk or workstation with plug-in equipment. Therefore, 3
these kinds of systems may not be practical for many occupancy types where non-habitual users or the broader 4
public represent a large fraction of the buildings occupants. 5
To address the weaknesses of any individual sensor technology, numerous studies have been conducted that 6
take advantage of sensor fusion. Sensor fusion is a technique that combines data collected from multiple sensors 7
and sensor technologies to provide enhanced performance over any single sensor. These studies have looked at 8
different combinations of sensors and data, ranging from indoor air temperature [20, 28-34], indoor relative 9
humidity [18, 29, 31-36], CO2 levels [18, 28-35, 37], volatile organic compound (VOC) concentrations, [28, 31,
10
32, 36], PIR trigger events [28, 30-33, 35, 36, 38], lighting loads [28, 30-33, 35, 37], noise levels [30-33, 36, 39], 11
Wi-Fi device counts [30, 34, 40-44], and other sensors such as door triggers [30, 35, 38] and Bluetooth device 12
counts [40, 41, 45]. This data is then analyzed using different machine learning algorithms to generate 13
occupancy-count estimations with a high enough resolution to attain HVAC energy savings anywhere from 18 14
[5] to 55% [6]. However, many buildings do not monitor parameters such as VOC concentration or noise levels. 15
Door entry and exit activity is not monitored in many buildings with public or semi-public access. Bluetooth has 16
also been shown to be less prevalent than Wi-Fi enabled devices [46] and therefore less useful for occupancy-17
count estimation [47]. As Bluetooth and Wi-Fi depend on signal propagation, both suffer from potential dead-18
zones or poor coverage in buildings with large amounts of internal mass. Privacy concerns with the use of these 19
signals remains a tangible barrier to their widespread use. These studies were also performed either in an 20
experimental testbed or using ad hoc sensor arrays in a pre-existing built environment; this additional hardware 21
drives up the cost of detecting occupants within the building. It would be advantageous to explore leveraging 22
existing data streams within buildings using in-situ sensors further, as these opportunistic data streams would 23
reduce the cost needed to facilitate occupancy-count estimation. Additionally, the models in these studies were 24
developed for a single space over the measured occupancy period, without consideration for how these models 25
will perform if implemented in a different context. Overall, these studies showed that a limitation of sensor 26
fusion is that models can differ vastly in termsof their predictive accuracy due to a variety of factors [16]. The 27
model formalism chosen and its complexity can substantially affect the model accuracy. Similarly, the data 28
streams, sensors, and sensor combinations available for analysis will have different levels of utility for 29
occupancy-count estimation purposes. Furthermore, the calibration of a model with space-specific ground truth 30
data will impact its ability to determine occupancy levels. As the ground truth data collection process is invasive 31
and resource/time intensive, it would be advantageous to explore the transferability of models to another context. 32
This might include if a model trained and validated in one space at a certain time can be applied in an entirely 33
different temporospatial context. 34
This paper contributes to the state-of-the-art by analyzing and quantifying the effects these parameters have 35
on the predictive accuracy of sensor fusion models. This study uses in-situ commercial sensors already installed 36
in the case study building and ground truth data, without any other ad hoc data recorded. A dataset with over 200 37
hours’ worth of manual ground truth occupancy counts is used to assess the potential of sensor fusion-based 38
implicit occupancy sensing. Models are developed for all possible sensor-type combinations. These models are 39
implemented on different floors of the building to explore their transferability, which – to the authors’ best 40
knowledge – has not been previously studied. 41
M
A
NUS
C
R
IP
T
A
C
C
E
P
TE
D
3.
Methodology
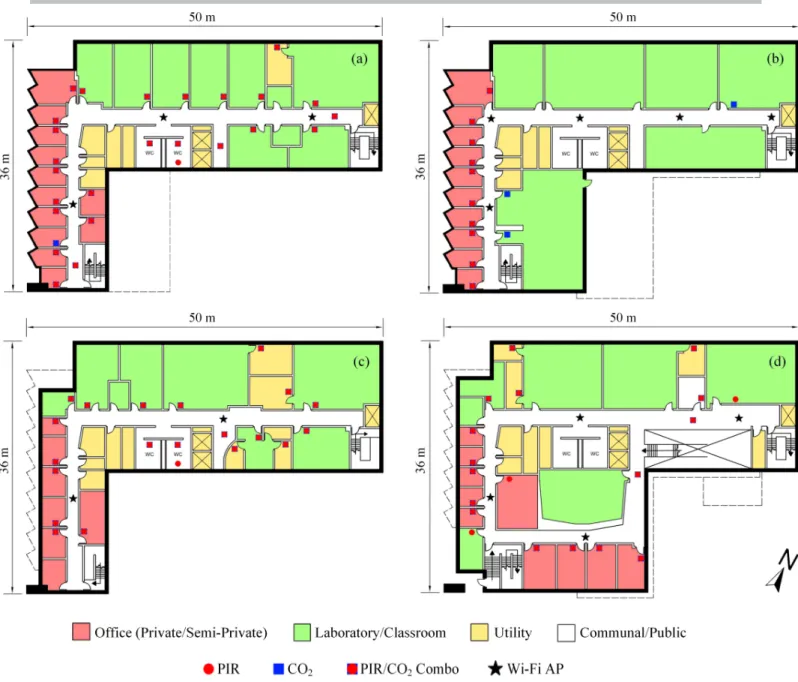
13.1. Building Layout and Dataset
2
The analysis was carried out on four floors of an academic office building in Ottawa, Canada. Each floor 3
varies slightly in configuration and size, see Figure 1 and Table 1, respectively. Note that the PIR and CO2
4
sensors are commercial grade wall units mounted at approximately 1.6 meters in height, with the exception of 5
the ceiling mounted PIR units in the washrooms of floor A and C. 6
M
A
NUS
C
R
IP
T
A
C
C
E
P
TE
D
1M
A
NUS
C
R
IP
T
A
C
C
E
P
TE
D
Table 1: Floor size and use breakdown.
1
Occupancy Type Approximate Area (m
2)
Floor A Floor B Floor C Floor D Σ Private/Semi-private 176 160 129 250 715 (17%) Laboratory/Classroom 427 618 377 389 1811 (43%) Utility 98 80 144 96 417 (10%) Communal 290 281 294 417 1283 (30%) Total 991 1139 944 1152 4226 2
All floors contain a mixture of private and semi-private office spaces, as well as classrooms, study spaces, 3
washrooms, and space for utilities/IT services. These office spaces and some laboratories are used by professors 4
and graduate students during the entire year, whereas the classrooms are typically only used during the academic 5
year (i.e., from September to mid-April). The sensor grid density and granularity also vary between floors; 6
sensor counts are shown in Table 2. On floor B, the sensors are disproportionally concentrated in the office 7
spaces on the west side of the floor. The sensor counts are nearly double that of floor B on floors A and C, and 8
the sensors on these floors are distributed over a larger proportion of the floor area. 9
10
Table 2: Floor sensor type and count breakdown.
11
Sensor Type
Number of Sensors
Floor A Floor B Floor C Floor D
Wi-Fi 3 5 2 4 CO2 26 13 20 16 PIR 26 10 21 19 Plug Meter 1 1 1 1 Light Meter 1 1 1 1 12
The data from these sensors are accessible through the BAS, including individual CO2 sensor readings,
13
individual PIR activations, and instantaneous floor-level lighting and plug loads, all provided in a concurrent 14
five-minute timestep. Individual Wi-Fi-enabled device counts are also provided in the same five-minute timestep 15
from the IT network for each Wi-Fi access point. These counts include all mobile devices and ambient devices 16
such as wireless printers and laptops connected to or attempting to connect to the Wi-Fi access points, referred to 17
as associated devices. Note that these data were anonymized before being provided, and therefore no MAC 18
addresses were monitored or stored during the data collection campaign. The CO2 sensors’ readings were
19
verified using a reference CO2 logger and were found to have a mean absolute error of 96 ppm. The functionality
20
of each PIR sensor was also individually verified. Coverage maps were provided by IT services to verify that the 21
Wi-Fi access points did not have any dead-zones on each floor. Models were developed using these data as-is. 22
The data were selected for the concurrent times that ground truth was available. 23
In order to verify and compare the models developed using the sensor data, ground truth occupancy counts 24
were collected for each floor. Three cameras were used, with one at the elevator lobby and one at each stairwell 25
to ensure all entrance and exit points were monitored. This footage was then manually reviewed by a researcher 26
and the timing of the entry and exit events were manually logged. Note that for privacy reasons, the cameras 27
used did not record any audio and the footage was deleted immediately after being logged. The methodology 28
M
A
NUS
C
R
IP
T
A
C
C
E
P
TE
D
was reviewed and approved by Carleton University’s Research Ethics Board. Data collection was performed for 1
floors A, B, C, and D between the periods shown in Table 3. The data from these observation periods was then 2
grouped to match the same five-minute timestep as the BAS data. Overall, 208.5 hours of ground truth 3
observations were recorded. 4
5
Table 3: Data collection period(s) for each floor, all in 2018.
6
Floor Date(s) & Time(s) Peak Occupancy
A
Fri, 2-Mar 7:56-12:56
26 Sat, 3-Mar, 7:31-12:56
Wed, 15-Aug, 17:25 to Fri, 17 Aug, 15:15 38
B
Tue, 13-Feb, 7:18-11:08
72 Fri, 16-Feb, 7:33-11:13
Mon, 26-Feb, 7:28-12:38
Mon, 30-Jul, 16:00 to Wed, 1-Aug, 14:00 37
C Tue, 15-May, 15:31 to Thu, 17-May, 14:31 21
D Mon, 18-Jun, 14:05 to Wed, 20-Jun, 11:40 67
3.2. Model Formalisms
7
The data collected was reduced to a simplified dataset with the following six common datatypes for each 8
floor: 1) the number of associated Wi-Fi devices, 2) the ensemble mean of the CO2 concentration (ppm), 3) the
9
fraction of PIR sensors triggered, 4) the plug load (kW), 5) the lighting load (kW), and 6) the aggregated 10
electrical load (i.e., the sum of the plug and lighting loads). This final datatype was added to explore the value of 11
having the lighting and plug loads on one submeter for the purpose of occupancy-count estimation versus having 12
these load types aggregated. Note that in the cases where either the plug or lighting load was considered as a 13
predictor of occupancy, the electrical load was not considered and vice versa, as this would be redundant. To 14
further facilitate comparison, the refined dataset underwent feature scaling in the form of a min-max 15
normalization before analysis. The focus was on the subset of data collected between 6 am and 10 pm, as this is 16
when occupants were generally observed on all floors. Including data from the overnight period in model 17
development could artificially inflate the predictive accuracy of the model; a model that can predict that a 18
building is unoccupied overnight (a relatively trivial exercise) should not be conflated with a model that can 19
accurately predict occupancy throughout the day. Such a model is not necessarily useful in commercial and 20
institutional buildings where overnight occupancy is minimal. A similar approach is adapted by Wang et al. [34] 21
in their model development. 22
Using enumerative combinatorics, all 39 possible unique combinations of the six datatypes were identified. 23
The effectiveness of each combination for occupancy count-estimation is explored. Note that for floors A and B, 24
separate models were developed for each of the winter and summer semester to explore how different occupancy 25
levels in the same space would affect the quality of the resulting model (e.g., will the trends observed in the 26
summer models hold true in the higher occupancy winter models, and vice versa?). Each of the 39 datatype 27
combinations were then modelled using multiple linear regression and ANN formalisms for each floor, with 28
additional models for floors A and B as mentioned. The data was randomly split into 70% and 30% for training 29
and validation, respectively, and 10-fold cross-validation was performed. The models were then fitted to the 30
M
A
NUS
C
R
IP
T
A
C
C
E
P
TE
D
datatypes for the floor they were generated from, as well as all other floors. This allows for the predictive 1
accuracy of a model developed in one space to be evaluated when applied to another space. The resulting fits 2
were then compared to the ground truth data. This means that 39 datatype combinations were considered over six 3
different floor scenarios, with 234 unique models developed for each model formalism, referred to as the ‘intra-4
floor’ fits. Then, each of the models developed for a single floor were tested on all other floors, for a total of 5
1170 fits for each model formalism, referred to as the ‘inter-floor’ fits. In total, there were 1404 fits for each 6
model formalism, for a total of 2808 fits developed over the course of this study. 7
The ANN models are two-layer feed forward neural networks developed and applied using the R functions 8
neuralnet and compute from the ‘neuralnet’ package [48]. The single hidden layer uses sigmoid activation 9
functions and contains a varying number of neurons depending on the number of sensors considered in the 10
model. This scales a neural network’s complexity to match the amount of data considered. This approach is 11
adapted from Heaton [49] and involves sizing the hidden layer to be two-thirds the size of the input layer (i.e., 12
the number of sensor-types considered) plus the size of the output layer (i.e., one or the occupancy-count 13
estimation). The output layer uses a logistic function. The parameters of the ANN are then determined using the 14
resilient backpropagation method with weighted backtracking. Training of the network was terminated when the 15
partial derivatives of the error function reached 10-6 or 1000 iterations were performed without convergence. The 16
multiple linear regression models were developed and fitted using the R functions lm and predict from the ‘base’ 17
package [50], with the intercept coerced through the origin to account for the data normalization (i.e., minimum 18
observed values should correspond to minimum observed occupancy). The coefficient of determination (R2) and 19
normalized root mean square error (NRMSE) were computed for the fits produced by these models to assess 20
their predictive accuracy relative to the ground truth data and to facilitate comparison between each other. 21
4.
Results
22
4.1. Multiple Linear Regression Models
23
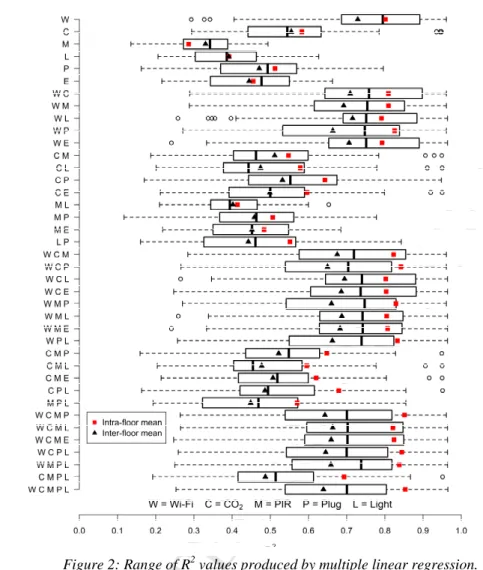
Figure 2 presents the distribution of the R2 for the 1404 fits developed from the multiple linear regression 24
models (i.e., 36 for each of the 39 sensor combinations). The R2 values reported in this figure are those of both 25
the intra-floor and inter-floor fits resulting from the multiple linear regression models. Generally, it is observed 26
that the models developed from sensor combinations that contain floor-level associated Wi-Fi device counts 27
have a considerably higher R2 and lower NRMSE than those without. The maximum and mean R2 for all Wi-Fi 28
only fits were 96.1 and 74.1%, respectively. The mean R2 is 80.1% if only the intra-floor fits are considered. 29
These fits have the highest mean R2 and lowest mean NRMSE when only a single sensor-type is considered in 30
all six floor scenarios studied. The highest observed R2 is 96.5% with a NRMSE of 5.9%, corresponding to the 31
sensor fusion of the Wi-Fi, CO2, PIR, plug and lighting load data from the intra-floor fit for floor B (i.e., the
32
model from floor B used to predict floor Bs occupancy count). The highest observed R2 and the corresponding 33
NRMSE resulting from a model used from one floor to another (i.e., inter-floor model) was 94.7% and 7.5%, 34
respectively, for the sensor fusion of Wi-Fi, PIR, and plug load data from the inter-floor fit between floor D for 35
floor B in the winter semester. The lowest observed R2 is 11.7% with a NRMSE of 26.4%, corresponding to the 36
sensor fusion of the PIR and plug load data from the intra-floor fit for floor C (i.e., the model from floor C used 37
to predict floor Cs occupancy count). This range of accuracies suggest that multiple linear regression models are 38
suited to producing occupancy-count estimations using sensor fusion, depending on the sensors available. 39
M
A
NUS
C
R
IP
T
A
C
C
E
P
TE
D
1Figure 2: Range of R2 values produced by multiple linear regression.
2
4.2. Artificial Neural Network Models
3
As above, Figure 3 shows the distribution of the R2 of the 1404 fits for the ANN models. The coefficients of 4
determination reported in these figures are those of both the intra-floor and inter-floor fits resulting from the 5
ANN models. It remains the case that the models which contain associated Wi-Fi device counts have a higher 6
mean R2 and lower NRMSE than those without. The maximum and mean R2 for Wi-Fi only fits were 97.4 and 7
71.4%, respectively. The mean R2 is 83.0% if only intra-floor fits are considered. These fits have the highest 8
mean R2 and lowest mean NRMSE when only a single sensor-type is considered in all six floor scenarios 9
studied. The highest observed R2 is 97.5% with a NRMSE of 5.0%, corresponding to sensor fusion of the Wi-Fi, 10
PIR, and lighting load data from the intra-floor fit for floor B during the winter semester (i.e., the model from 11
floor B used to predict floor Bs occupancy count). The highest observed R2 and corresponding NRMSE resulting 12
from a model used from one floor (i.e., inter-floor fit) to another was 94.5% and 8.2%, respectively, for the 13
sensor fusion of Wi-Fi and plug load data from the inter-floor fit between floor D for floor B in the winter 14
semester. The lowest observed R2 is less than 0.1% with a NRMSE of 31.8%, corresponding to the PIR data 15
from the intra-floor fit for floor B (i.e., the model from floor B used to predict floor Bs occupancy count). This 16
range of accuracies suggest that ANN models are similarly suited to producing occupancy-count estimations 17
using sensor fusion, depending on the sensors available. 18
M
A
NUS
C
R
IP
T
A
C
C
E
P
TE
D
1 2Figure 3: Range of R2 values produced by artificial neural network models.
3
5.
Discussion
4
5.1. Model Formalism Comparison
5
By visual inspection, the trends in the coefficient of determination for both model formalisms bear a 6
resemblance to one another when the same floor is considered. Of the 1404 fits developed for each formalism, 7
ANNs had a higher R2 on a fit-by-fit basis for 56%. The mean difference in R2 and NRMSE between the fits 8
using ANNs and the fits using multiple linear regression is 1.7% and 0.8%, respectively. This suggests that ANN 9
models have comparable accuracy to their multiple linear regression counterparts in the case study building. 10
However, if the intra-floor fits are examined in isolation (i.e., the models developed and used on the same floor), 11
there is a shift in favour towards ANN models for both the coefficient of determination and normalized root 12
mean square error. In this case, ANN models had a higher R2 and lower NRMSE on a fit-by-fit basis for 93% of 13
cases, with a mean change relative to their multiple linear regression counterparts of 11.8% and -2.7%, 14
respectively. The opposite is true when the inter-floor fits are examined (i.e., the models developed on one floor 15
and used on another). In this case, multiple linear regression models had a higher R2 and lower NRMSE on a fit-16
byfit basis for 50.9% and 64.0% of cases, with a mean change relative to their ANN counterparts of 0.4% and -17
M
A
NUS
C
R
IP
T
A
C
C
E
P
TE
D
1.6%, respectively. This suggests the following regarding the use of either model formalism to produce sensor 1
fusion models for occupancy-count estimation: 2
• ANN models appear to offer higher accuracy over multiple linear regression models in 93% of 3
the cases where the model is fitted to its own floor, making them suited to situations where 4
ground truth data is available for calibration in the case study building; and 5
• multiple linear regression models offer comparable accuracy to their ANN counterparts when 6
models are fitted to a different floor, making them a candidate for transferability between 7
floors and therefore suited to situations where ground truth data is not available for calibration 8
for that floor in the case study building. 9
Therefore, for this building and the suggested application of these models, multiple linear regression is the 10
superior model formalism. This is due to their comparable accuracy to ANNs with reduced complexity, and the 11
ease of implementation associated with the limited need for expensive, time consuming, and invasive ground 12
truth data collection. 13
5.2. Sensor Utility Comparison
14
The intra-floor fits (i.e., the models developed and used on the same floor) generally benefit from including 15
as many sensor datatypes as possible in their model. However, it is evident in both Figure 2 and Figure 3 that 16
increasing the number of sensor typologies considered in the model formalism does not always equate to a 17
higher R2; a similar trend is observed in the root mean square error. Therefore, additional sensor data are 18
advantageous if ground truth data are available, whereas less sensor data (i.e., one to two sensor datatypes) 19
typically produce inter-floor fits with a higher mean R2 value. The utility of sensor data produced by sensors for 20
occupancy-count estimation is linked to the sensors’ configuration and/or density. Note that the magnitude of 21
this sensitivity depends on the sensor-type considered. If this configuration and/or density varies significantly 22
between spaces, then models developed with these sensors’ data between spaces will suffer from inaccuracies. 23
Including numerous sensor-types in models developed between spaces may therefore result in a compounding of 24
these inaccuracies, which is why fewer sensor datatypes typically result in fits with a higher mean R2 and lower 25
NRMSE between floors. 26
By visual inspection of Figure 2 and Figure 3, it is apparent that associated Wi-Fi device counts are 27
beneficial for floor-level occupancy-count estimation. Recall that sensor fusion models that contain associated 28
Wi-Fi device counts have a higher mean R2 and lower mean NRMSE than those without. The fraction of PIR 29
sensors triggered alone offers the lowest potential for occupancy-count estimation. However, the range of R2 30
values produced by the model which uses this datatype alone is narrowest in four out of six cases for both 31
multiple linear regression and ANN formalisms. This suggests that the fraction of PIR sensors triggered is not 32
strongly linked to the sensors’ configuration as models developed on one floor performed similarly on others. 33
The utility of these PIR data increased when included in sensor fusion models with other datatypes, especially 34
when ANN models are used. This may be attributable to the fact that the fraction of PIR sensors triggered has a 35
non-linear relationship with occupancy count (i.e., a mean R2 of 32.3% using linear regression), whereas the 36
non-linear functions used in computing ANN models are able to account for other, non-linear relationships these 37
data have with occupancy count. The mean CO2 level also increased in utility when included in sensor fusion
38
models and had the second highest mean R2 of the stand-alone sensor datatypes for predicting occupant count. 39
However, the range of values predicted from models using only the mean CO2 readings across different floors
40
was large, with a 65% and 70% difference between maximum and minimum values for multiple linear regression 41
M
A
NUS
C
R
IP
T
A
C
C
E
P
TE
D
and ANN formalisms, respectively. This suggests that the quality of the resulting fit is highly sensitive to sensor 1
configuration and/or density, and therefore mean CO2 data do not lend themselves well to transferability from
2
one space to another. 3
Floor-level plug, lighting, and aggregated electrical load also exhibited varying levels of utility in sensor 4
fusion models. In general, floor-level lighting load data were more indicative of occupancy than floor-level plug 5
load data. This may be because light levels fluctuated by a factor of more than four on average, whereas plug 6
loads exhibit a fluctuation by a factor of less than two on average. Floors B and D has manual on and automatic 7
off lighting controls, whereas floor A and C has automatic on and off controls. Interestingly, this did not 8
necessarily equate to a stronger correlation between lighting load levels and occupancy for floor A and C that 9
might be expected from an automatic on/off control scheme. With regards to plug load data, it is suspected that 10
submetering of these loads down to the room or workstation level would likely increase their individual 11
contribution to the sensor fusion models, as was noted by Akbar et al. [26]. Models with aggregated electrical 12
load data as opposed to separately submetered plug and lighting load data had a mean R2 that was 0.7% and 13
2.6% higher for multiple linear regression and ANN model formalisms, respectively. The range of R2 values was 14
also 24.6% and 19.3% smaller for multiple linear regression and ANN model formalisms on average, 15
respectively. This suggests that aggregated electrical data has higher utility for occupancy-count estimation 16
purposes. Ryu et al. [37] also found that electrical load data had higher information gain for occupancy-detection 17
purposes than lighting or plug loads metered separately. 18
As the sensor configuration on each individual floor did not change between the summer and winter 19
semester, it was hypothesized that the model from one semester should transfer well to the other semester. 20
However, the fits developed from the summer semester models generally have lower mean R2 values when 21
compared to their winter counterparts. Floor A had a mean reduction in R2 of 13.4% and 14.0% for multiple 22
linear regression and ANN models between summer and winter, respectively. Recall from Figure 1 that the 23
private offices on floor A are concentrated to one side, with laboratory and classroom spaces on the other. 24
Sensors are distributed fairly evenly between these spaces. However, occupancy patterns in the private offices 25
exhibit far less fluctuation between winter and summer compared to laboratories and classrooms. Therefore, 26
because the sensor data have been combined into parameters – such as fraction of PIR sensors triggered across 27
the entire floor, or the whole floors mean CO2 concentration – the lack of activity on one half of the floor biases
28
these models, producing fits with a lower mean R2. This reduction may therefore be attributable to a change in 29
occupancy patterns between semesters. Floor B had a mean reduction in R2 of 8.9% and 7.5% for multiple linear 30
regression and ANN models between summer and winter, respectively. One possible explanation is that the large 31
computer lab on floor B was used over the summer to host a camp program for youth. It is likely that these youth 32
did not have any Wi-Fi enabled devices, thus reducing the utility of the fits that contain Wi-Fi enabled device 33
counts as a parameter. Therefore, if only the fits containing Wi-Fi enabled device counts are examined, there is a 34
10.4% and 13.9% reduction in the mean R2 value for multiple linear regression and ANNs, respectively. If the 35
fits developed from models that do not contain Wi-Fi enabled device counts are considered, there is only a 3.7% 36
and 0.8% reduction in the mean R2 value for multiple linear regression and ANNs, respectively. This suggests 37
that Wi-Fi enabled device counts are useful for occupancy sensing only in a context where Wi-Fi devices are 38
prevalent. Furthermore, the layout of the building or floor should also be considered in the cases where 39
occupancy may be concentrated in a particular location during a particular time. This consideration is especially 40
M
A
NUS
C
R
IP
T
A
C
C
E
P
TE
D
important if ground truth collection overlaps with an atypical day, as was the case with floor B during the 1
summer semester. 2
5.3. Model Selection Criteria
3
The following criteria were developed for selecting the ‘best’ sensor combination for occupancy-count 4
estimation using sensor fusion in the building studied: 5
1) High lower quartile (Q1) R2 values (see Figure 2 and 3) – to ensure that the models are transferable 6
and can be used in other spaces without recalibration to new ground truth data 7
2) High R2 and low NRMSE of the model fit – to ensure that the models are accurate 8
3) Sensor configuration available and cost 9
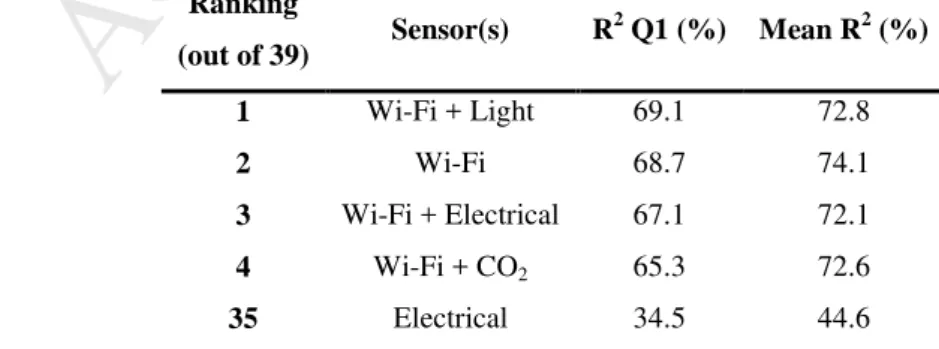
Using criterion 1 and 2, the top three models are identified in Table 4. In addition, Wi-Fi alone is examined for 10
its novelty and aggregated electrical loads are examined for their widespread availability and ease of access. As 11
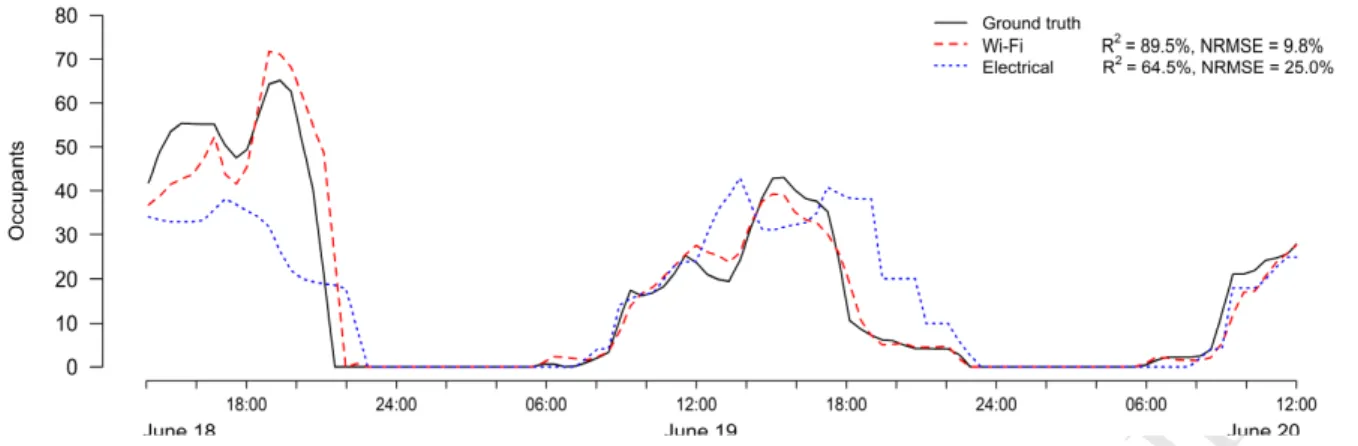
it has been established that multiple linear regression is the superior model formalism, the R2 of these models are 12
reported. Illustrative examples of the fits developed from associated Wi-Fi device count and electrical load data 13
are provided in Figure 4. Note that in Table 4, associated Wi-Fi device count alone ranks higher than the Wi-Fi 14
and electrical as well as the Wi-Fi and CO2 combinations. This further reinforces the findings that associated
Wi-15
Fi device counts are beneficial for occupancy-count estimation, and that a multiple linear regression formalism 16
can be sufficient to develop a useful model. Fits containing only aggregated electrical load data are observed to 17
have a lower R2 and higher NRMSE than the models with associated Wi-Fi device counts; regardless, in the 18
absence of other sensors data, this data type can still be used as a regressor for occupancy-count estimation. 19
The third criterion noted but not included in this table is sensor configuration availability and cost. This 20
criterion represents an area where significant differences may be observed between buildings, or even floors of 21
the same building as in this case study. For example, while Dong et al. [16] note that Wi-Fi is considered an 22
‘expensive’ sensor for occupancy-count estimation, there is virtually no additional hardware cost if these sensors 23
are already installed in the building for other purposes (i.e., access points for internet connectivity). This is the 24
crux of implicit occupancy sensing. Metering of electrical loads is already common practice at the building level, 25
however this study examines submetering at the floor-level. This raises the question: if installing submeters at 26
this kind of resolution is only a moderate cost [16], can this cost be justified given the added benefit it may have 27
for occupancy-count estimation? As this study examines every sensor combination possible given the sensor-28
types examined, facility managers in the case study building could use these findings to determine the expected 29
level of accuracy they can achieve for occupant sensing given the sensors or data available to them. 30
Table 4: Selected sensor combinations for occupancy-count estimation using linear regression and sensor
31 fusion. 32 Ranking (out of 39) Sensor(s) R 2 Q1 (%) Mean R2 (%) 1 Wi-Fi + Light 69.1 72.8 2 Wi-Fi 68.7 74.1 3 Wi-Fi + Electrical 67.1 72.1 4 Wi-Fi + CO2 65.3 72.6 35 Electrical 34.5 44.6 33
M
A
NUS
C
R
IP
T
A
C
C
E
P
TE
D
Figure 4: Illustrative example of ground truth and predicted occupancy count over time, for Wi-Fi enabled
1
device count and electrical load data for floor D using linear regression.
2
5.4. Unresolved Issues
3
While this study has shown that implicit occupancy sensing can be accomplished using sensor fusion, there 4
are several research questions and issues to be resolved, namely: 5
• How can real-time access to Wi-Fi counts be facilitated?
6
While Wi-Fi shows great promise for occupancy-count estimation purposes, there is often a gap between 7
facility managers and IT services when it comes to integrating this information into the BAS. As modern 8
buildings have their BAS and Wi-Fi networks on the same local area network (LAN), increased communication 9
between these parties may facilitate future use of Wi-Fi access points as implicit occupancy sensors for HVAC 10
control purposes. However, addressing this problem will still not benefit buildings where occupants do not have 11
Wi-Fi enabled devices. Privacy concerns remain an important issue. There are also considerations that need to be 12
made for the expected prevalence of Wi-Fi enabled personal mobile devices across different cultures, socio-13
economic backgrounds, and over time. These differences are expected to have a great impact on the usefulness 14
of Wi-Fi for occupancy-count estimation depending on these contextual factors. 15
• How much ground truth data is needed to develop an adequate model?
16
As ground truth collection is a labourious, expensive, and invasive, it would be beneficial to establish the 17
threshold of data needed to develop a sufficiently accurate model. This may prove to enhance the quality of 18
models or reveal the point at which the extra data start to have diminishing returns. 19
• To what degree do occupants need to be counted to realize HVAC savings?
20
The ventilation in buildings is typically controlled by dampers with a discrete number of positions. As such, 21
an absolute occupancy count may not be necessary to realize HVAC savings. For example, it may be sufficient 22
to cluster the occupancy count into states such as high, medium, or low. A worthy research question would be 23
how accurate these models must be to consistently identify the correct occupancy state, and the relationship 24
between the number of states, model complexity, and the resulting HVAC savings. 25
• How does sensor grid density and data timestep affect model quality?
26
While the accuracy of models developed in one space and applied to another was examined for the case 27
study building, it is impossible to quantify the proportion of the change in the models’ accuracies that can be 28
attributed to different sensor grid densities between floors, as this change is a result of numerous confounding 29
factors. Additionally, the data used in this study was taken at five-minute timesteps, which may be higher 30
M
A
NUS
C
R
IP
T
A
C
C
E
P
TE
D
resolution than many traditional BAS systems are capable of logging. The effect of changing these parameters 1
would be a worthy research question. 2
• Where and when are these specific models applicable?
3
While this study showed that models could be developed in one floor and used in another in the case study 4
building, the transferability of these models was still within a single building with an academic office-type 5
occupancy across all floors. A worthy research question would be how these models would perform in a 6
completely different building of the same occupancy type, or a building of a different occupancy type altogether. 7
6.
Conclusions and future work
8
This study has shown that sensor fusion models can be used to develop occupancy-count estimations using 9
opportunistic data streams in the building studied, namely Wi-Fi access points, CO2 sensors, PIR sensors, and
10
plug and lighting load meters. It was shown that multiple linear regression models had similar accuracy to ANN 11
models for the majority of fits produced. In the cases where ANN models offered improved performance over 12
multiple linear regression models, this improvement was not statistically significant for practical occupancy-13
count estimation purposes to warrant the ANNs complexity and lack of transferability. Therefore, multiple linear 14
regression models are the preferred model formalism for the application and building studied. Associated Wi-Fi 15
device counts were shown to be highly beneficial in developing occupancy-count estimations and out-performed 16
every other individual data stream. The performance of this lone data stream was only exceeded by models 17
which included Wi-Fi data in conjunction with additional sensor data streams; however, the marginal 18
improvements in the prediction accuracy of these models may not justify the additional capital cost in buildings 19
where these sensors are not already installed. The cost-effective, non-intrusive, accurate and simple nature of 20
Wi-Fi device count alone make it the best candidate for opportunistic occupancy-count estimation. Additionally, 21
aggregated electrical load data were observed to be of higher utility for occupancy-count estimation than 22
separately submetered plug and lighting load data. 23
While detecting occupancy in real time may be advantageous to applications such as demand-control 24
ventilation, improved benefits could be gained from developing a forecasting model. An occupancy forecasting 25
model could be used to determine occupancy levels over a 24-hour prediction horizon or even further so that 26
optimal start, stop, and operating times for HVAC equipment can be determined. Future work will examine 27
forecasting methods given the models developed to ascertain prototypical occupancy profiles. Algorithms could 28
then be developed and implemented into the BAS to realize HVAC energy savings. 29
Acknowledgements
30
This research is supported by research funding provided by the Natural Sciences and Engineering Research 31
Council (NSERC) of Canada, National Research Council Canada, and Green Power Labs. The authors 32
acknowledge the support of Chris Murray and Eddie Villarta from Information Technology Services; Darry 33
Boyce, Daniel Redmond, Scott Macdonald, and Gavin Symonds from Facilities Management and Planning at 34
Carleton University; and Trent Hilliard at Green Power Labs. The authors acknowledge the IEA-EBC Annex 66 35
and 79 researchers, as we have greatly benefitted from the associated discussions. 36
M
A
NUS
C
R
IP
T
A
C
C
E
P
TE
D
References
1[1] P. Taylor, S. Katipamula, M. R. Brambley, and M. R. Brambley, “Methods for Fault Detection , 2
Diagnostics , and Prognostics for Building Systems — A Review , Part I,” HVAC&R Res., vol. 11, no. 1, 3
pp. 3–25, 2005. 4
[2] K. W. Roth, D. Westphalen, P. Llana, and M. Feng, “The Energy Impact of Faults in US Commercial 5
Buildings,” Int. Refrig. Air Cond. Conf., pp. 600–609, 2004. 6
[3] Natural Resources Canada, Survey of Commercial and Institutional Energy Use - Buildings 2009 - 7
Detailed Statistical Report 2012. 2012. 8
[4] W. Shen, G. Newsham, and B. Gunay, “Leveraging existing occupancy-related data for optimal control 9
of commercial office buildings: A review,” Adv. Eng. Informatics, vol. 33, pp. 230–242, 2017. 10
[5] N. Cao, J. Ting, S. Sen, and A. Raychowdhury, “Smart sensing for HVAC Control: Collaborative 11
intelligence in optical and IR cameras,” IEEE Trans. Ind. Electron., vol. 65, no. 12, pp. 9785–9794, 12
2018. 13
[6] M. Jin, N. Bekiaris-Liberis, K. Weekly, C. J. Spanos, and A. M. Bayen, “Occupancy Detection via 14
Environmental Sensing,” IEEE Trans. Autom. Sci. Eng., vol. 15, no. 2, pp. 443–455, 2018. 15
[7] O. Ardakanian, A. Bhattacharya, and D. Culler, “Non-Intrusive Techniques for Establishing Occupancy 16
Related Energy Savings in Commercial Buildings,” in Proceedings of the 3rd ACM International 17
Conference on Systems for Energy-Efficient Built Environments, 2016. 18
[8] R. H. Dodier, G. P. Henze, D. K. Tiller, and X. Guo, “Building occupancy detection through sensor 19
belief networks,” Energy Build., vol. 38, no. 9, pp. 1033–1043, 2006. 20
[9] R. Melfi, B. Rosenblum, B. Nordman, and K. Christensen, “Measuring building occupancy using 21
existing network infrastructure,” 2011 Int. Green Comput. Conf. Work. IGCC 2011, 2011. 22
[10] S. Rosiek and F. J. Batlles, “Reducing a solar-assisted air-conditioning system’s energy consumption by 23
applying real-time occupancy sensors and chilled water storage tanks throughout the summer: A case 24
study,” Energy Convers. Manag., vol. 76, pp. 1029–1042, 2013. 25
[11] F. Wahl, M. Milenkovic, and O. Amft, “A distributed PIR-based approach for estimating people count in 26
office environments,” Proc. - 15th IEEE Int. Conf. Comput. Sci. Eng. CSE 2012 10th IEEE/IFIP Int. 27
Conf. Embed. Ubiquitous Comput. EUC 2012, pp. 640–647, 2012. 28
[12] P. Liu, S.-K. Nguang, and A. Partridge, “Occupancy Inference Using Pyroelectric Infrared Sensors 29
Through Hidden Markov Models,” IEEE Sens. J., vol. 16, no. 4, pp. 1062–1069, 2016. 30
[13] C. Duarte, K. Van Den Wymelenberg, and C. Rieger, “Revealing occupancy patterns in an office 31
building through the use of occupancy sensor data,” Energy Build., vol. 67, pp. 587–595, 2013. 32
[14] Z. Nagy, F. Y. Yong, M. Frei, and A. Schlueter, “Occupant centered lighting control for comfort and 33
energy efficient building operation,” Energy Build., vol. 94, pp. 100–108, 2015. 34
[15] S. Gilani and W. O’Brien, “Review of current methods, opportunities, and challenges for in-situ 35
monitoring to support occupant modelling in office spaces,” J. Build. Perform. Simul., vol. 10, no. 5–6, 36
pp. 444–470, 2017. 37
[16] A. Wagner, W. O’Brien, and B. Dong, Exploring Occupant Behavior in Buildings. 2018. 38
[17] M. S. Zuraimi, A. Pantazaras, K. A. Chaturvedi, J. J. Yang, K. W. Tham, and S. E. Lee, “Predicting 39
occupancy counts using physical and statistical Co2-based modeling methodologies,” Build. Environ., 40
vol. 123, pp. 517–528, 2017. 41
[18] J. Wang, N. C. F. Tse, T. Y. Poon, and J. Y. C. Chan, “A practical multi-sensor cooling demand 42
estimation approach based on visual, indoor and outdoor information sensing,” Sensors (Switzerland), 43
vol. 18, no. 11, 2018. 44
[19] M. Aftab, C. Chen, C.-K. Chau, and T. Rahwan, “Automatic HVAC control with real-time occupancy 45
recognition and simulation-guided model predictive control in low-cost embedded system,” Energy 46
Build., vol. 154, pp. 141–156, 2017. 47
[20] J. P. Roselyn, R. A. Uthra, A. Raj, D. Devaraj, P. Bharadwaj, and S. V. D. Krishna Kaki, “Development 48
and implementation of novel sensor fusion algorithm for occupancy detection and automation in energy 49
efficient buildings,” Sustain. Cities Soc., vol. 44, pp. 85–98, 2019. 50
[21] S. Petersen, T. H. Pedersen, K. U. Nielsen, and M. D. Knudsen, “Establishing an image-based ground 51
truth for validation of sensor data-based room occupancy detection,” Energy Build., vol. 130, pp. 787– 52
793, 2016. 53
M
A
NUS
C
R
IP
T
A
C
C
E
P
TE
D
[22] G. R. Newsham et al., “Testing the accuracy of low-cost data streams for determining single-person 1
office occupancy and their use for energy reduction of building services,” Energy Build., vol. 135, pp. 2
137–147, 2017. 3
[23] Y. Benezeth, H. Laurent, B. Emile, and C. Rosenberger, “Towards a sensor for detecting human 4
presence and characterizing activity,” Energy Build., vol. 43, no. 2–3, pp. 305–314, 2011. 5
[24] P. Carreira, A. A. Costa, V. Mansur, and A. Arsénio, “Can HVAC really learn from users? A simulation-6
based study on the effectiveness of voting for comfort and energy use optimization,” Sustain. Cities Soc., 7
vol. 41, pp. 275–285, 2018. 8
[25] N. Li, G. Calis, and B. Becerik-Gerber, “Measuring and monitoring occupancy with an RFID based 9
system for demand-driven HVAC operations,” Autom. Constr., vol. 24, pp. 89–99, 2012. 10
[26] A. Akbar, M. Nati, F. Carrez, and K. Moessner, “Contextual occupancy detection for smart office by 11
pattern recognition of electricity consumption data,” IEEE Int. Conf. Commun., vol. 2015–Septe, no. 12
June, pp. 561–566, 2015. 13
[27] T. Labeodan, K. Aduda, W. Zeiler, and F. Hoving, “Experimental evaluation of the performance of chair 14
sensors in an office space for occupancy detection and occupancy-driven control,” Energy Build., vol. 15
111, pp. 195–206, 2016. 16
[28] T. Ekwevugbe, N. Brown, and D. Fan, “A design model for building occupancy detection using sensor 17
fusion,” in IEEE International Conference on Digital Ecosystems and Technologies, 2012, pp. 1–6. 18
[29] Z. Chen, M. K. Masood, and Y. C. Soh, “A fusion framework for occupancy estimation in office 19
buildings based on environmental sensor data,” Energy Build., vol. 133, pp. 790–798, 2016. 20
[30] Z. Yang, B. Becerik-Gerber, N. Li, and M. Orosz, “A systematic approach to occupancy modeling in 21
ambient sensor-rich buildings,” Simulation, vol. 90, no. 8, pp. 960–977, 2014. 22
[31] B. Dong et al., “An information technology enabled sustainability test-bed (ITEST) for occupancy 23
detection through an environmental sensing network,” Energy Build., vol. 42, no. 7, pp. 1038–1046, 24
2010. 25
[32] B. Dong and K. P. K. P. Lam, “Building energy and comfort management through occupant behaviour 26
pattern detection based on a large-scale environmental sensor network,” J. Build. Perform. Simul., vol. 4, 27
no. 4, pp. 359–369, 2011. 28
[33] T. Ekwevugbe, N. Brown, V. Pakka, and D. Fan, “Improved occupancy monitoring in non-domestic 29
buildings,” Sustain. Cities Soc., vol. 30, pp. 97–107, 2017. 30
[34] W. Wang, J. Chen, T. Hong, and N. Zhu, “Occupancy prediction through Markov based feedback 31
recurrent neural network (M-FRNN) algorithm with WiFi probe technology,” Build. Environ., vol. 138, 32
no. April, pp. 160–170, 2018. 33
[35] S. H. Kim and H. J. Moon, “Case study of an advanced integrated comfort control algorithm with 34
cooling, ventilation, and humidification systems based on occupancy status,” Build. Environ., vol. 133, 35
pp. 246–264, 2018. 36
[36] T. H. Pedersen, K. U. Nielsen, and S. Petersen, “Method for room occupancy detection based on 37
trajectory of indoor climate sensor data,” Build. Environ., vol. 115, pp. 147–156, 2017. 38
[37] S. H. Ryu and H. J. Moon, “Development of an occupancy prediction model using indoor environmental 39
data based on machine learning techniques,” Build. Environ., vol. 107, pp. 1–9, 2016. 40
[38] K. Whitehouse et al., “Towards occupancy-driven heating and cooling,” IEEE Des. Test Comput., vol. 41
29, no. 4, pp. 17–25, 2012. 42
[39] Q. Huang, “Occupancy-driven energy-efficient buildings using audio processing with background sound 43
cancellation,” Buildings, vol. 8, no. 6, 2018. 44
[40] W. Wang, J. Chen, Y. Lu, and H.-H. Wei, “Energy conservation through flexible HVAC management in 45
large spaces: An IPS-based demand-driven control (IDC) system,” Autom. Constr., vol. 83, pp. 91–107, 46
2017. 47
[41] W. Wang, J. Chen, G. Huang, and Y. Lu, “Energy efficient HVAC control for an IPS-enabled large 48
space in commercial buildings through dynamic spatial occupancy distribution,” Appl. Energy, vol. 207, 49
pp. 305–323, 2017. 50
[42] W. Wang, T. Hong, N. Li, R. Q. Wang, and J. Chen, “Linking energy-cyber-physical systems with 51
occupancy prediction and interpretation through WiFi probe-based ensemble classification,” Appl. 52
Energy, vol. 236, no. August 2018, pp. 55–69, 2019. 53
[43] W. Wang, J. Chen, and X. Song, “Modeling and predicting occupancy profile in office space with a Wi-54