HAL Id: inserm-01322484
https://www.hal.inserm.fr/inserm-01322484
Submitted on 27 May 2016
HAL is a multi-disciplinary open access
archive for the deposit and dissemination of
sci-entific research documents, whether they are
pub-lished or not. The documents may come from
teaching and research institutions in France or
abroad, or from public or private research centers.
L’archive ouverte pluridisciplinaire HAL, est
destinée au dépôt et à la diffusion de documents
scientifiques de niveau recherche, publiés ou non,
émanant des établissements d’enseignement et de
recherche français ou étrangers, des laboratoires
publics ou privés.
Pradeepa Jayachandran, Valerie Olmo, Stephanie Sanchez, Rebecca
Mcfarland, Eudorah Vital, Jonathan Werner, Elim Hong, Neus
Sanchez-Alberola, Aleksey Molodstov, Rachel Brewster
To cite this version:
Pradeepa Jayachandran, Valerie Olmo, Stephanie Sanchez, Rebecca Mcfarland, Eudorah Vital, et al..
Microtubule-associated protein 1b is required for shaping the neural tube. Neural Development, 2015,
11 (1), pp.1. �10.1186/s13064-015-0056-4�. �inserm-01322484�
R E S E A R C H A R T I C L E
Open Access
Microtubule-associated protein 1b is
required for shaping the neural tube
Pradeepa Jayachandran
1†, Valerie N. Olmo
1†, Stephanie P. Sanchez
1†, Rebecca J. McFarland
1, Eudorah Vital
1,
Jonathan M. Werner
1, Elim Hong
1,2, Neus Sanchez-Alberola
1, Aleksey Molodstov
1and Rachel M. Brewster
1*Abstract
Background: Shaping of the neural tube, the precursor of the brain and spinal cord, involves narrowing and elongation of the neural tissue, concomitantly with other morphogenetic changes that contribue to this process. In zebrafish, medial displacement of neural cells (neural convergence or NC), which drives the infolding and narrowing of the neural ectoderm, is mediated by polarized migration and cell elongation towards the dorsal midline. Failure to undergo proper NC results in severe neural tube defects, yet the molecular underpinnings of this process remain poorly understood.
Results: We investigated here the role of the microtubule (MT) cytoskeleton in mediating NC in zebrafish embryos using the MT destabilizing and hyperstabilizing drugs nocodazole and paclitaxel respectively. We found that MTs undergo major changes in organization and stability during neurulation and are required for the timely completion of NC by promoting cell elongation and polarity. We next examined the role of Microtubule-associated protein 1B (Map1b), previously shown to promote MT dynamicity in axons. map1b is expressed earlier than previously reported, in the developing neural tube and underlying mesoderm. Loss of Map1b function using morpholinos (MOs) orδMap1b (encoding a truncated Map1b protein product) resulted in delayed NC and duplication of the neural tube, a defect associated with impaired NC. We observed a loss of stable MTs in these embryos that is likely to contribute to the NC defect. Lastly, we found that Map1b mediates cell elongation in a cell autonomous manner and polarized protrusive activity, two cell behaviors that underlie NC and are MT-dependent.
Conclusions: Together, these data highlight the importance of MTs in the early morphogenetic movements that shape the neural tube and reveal a novel role for the MT regulator Map1b in mediating cell elongation and polarized cell movement in neural progenitor cells.
Background
The neural tube, the precursor of the central nervous system, derives from the neurectoderm through a process known as neurulation. In anterior regions of mouse, chick and Xenopus embryos, conserved aspects of this process entail thickening of the neural ectoderm to shape the neural plate, elevation of the edges of the neural plate to form neural folds and convergent exten-sion of the neural plate that narrows and elongates the neural ectoderm [1–4] and contributes to neural groove formation. The neural folds on either side of the neural
plate eventually fuse at the dorsal midline and separate from the overlying non-neural ectoderm to shape the neural tube [5]. Mechanisms of teleost neurulation are often thought to diverge from primary neurulation due to the initial formation of a solid rod (and hence ab-sence of a neural groove), which only later cavitates to give rise to a neural tube [6]. A common misconception is that the neural rod is assembled from the coalescence of neurectodermal cells that exhibit mesenchymal proper-ties (reviewed in [3]), akin to secondary neurulation in mammals. However, closer examination of this process in zebrafish revealed that the neural tube derives in fact from a bilayered neural plate, albeit incompletely epithelialized, that infolds as a continuous sheet. The two sides of the neural plate are closely juxtaposed during infolding, explaining the absence of a neural groove. Thus, medio-* Correspondence:brewster@umbc.edu
†Equal contributors 1
Department of Biological Sciences, University of Maryland Baltimore County, Baltimore, MD, USA
Full list of author information is available at the end of the article
© 2016 Jayachandran et al. Open Access This article is distributed under the terms of the Creative Commons Attribution 4.0 International License (http://creativecommons.org/licenses/by/4.0/), which permits unrestricted use, distribution, and reproduction in any medium, provided you give appropriate credit to the original author(s) and the source, provide a link to the Creative Commons license, and indicate if changes were made. The Creative Commons Public Domain Dedication waiver (http://creativecommons.org/publicdomain/zero/1.0/) applies to the data made available in this article, unless otherwise stated.
lateral positions of cells in the deep layer of the neural plate correlate with dorso-ventral positions in the neural tube [7, 8]. In this regard, neural tube formation in zebrafish is similar to primary neurulation in mam-mals, which also entails the folding of an epithelialized neural plate.
As in other vertebrates [9-11], the zebrafish neural plate undergoes neural convergence and extension. However, in zebrafish, narrowing and elongation of the neural anlage is not limited to the neural plate stage, since convergence also drives infolding of the neural plate to shape the neural rod and extension occurs con-comitantly with this event. This later convergence event (referred to henceforth as NC, for neural convergence) is driven by polarized migration towards the dorsal midline and cell elongation along the medio-lateral (prospective apico-basal) axis. Failure to undergo proper NC, as a consequence of disruption of the pla-nar cell polarity (PCP) pathway, results in severe neural tube defects in zebrafish [12], highlighting the import-ance of this early stage of neural tube formation.
The cellular mechanisms underlying NC were first re-vealed in Xenopus and zebrafish, owing to early access and transparency (zebrafish) of the embryo. In Xenopus, explant assays have revealed that migration of deep neural cells in the medial neural plate is mediated by monopolar protrusions (filopodia and lamellipodia) di-rected towards the midline [11, 13, 14]. We have previ-ously demonstrated that cells in the zebrafish neural plate also extend medially-oriented protrusions and elongate as they converge towards the midline [8]. Narrowing of the neural plate in mice involves cell elongation [15] and cellular rearrangements [10, 16] that are driven by polarized apical boundary rearrangement and bipolar protrusive activity at the basal pole of cells [9]. Thus, the ability of neuroepithelial cells to form polarized protrusions appears to be an essential and conserved as-pect of neural tube morphogenesis, the molecular under-pinnings of which remain poorly understood.
Many inroads have been made in understanding how the microtubule (MT) network contributes to cell polar-ity during migration [17]. MTs are dynamic heteropoly-mers ofα- and β-tubulin, existing in alternating states of active polymerization and depolymerization known as dynamic instability [18, 19]. These cytoskeletal elements establish the position of cortical polarity (manifested as actin-rich lamellipodia in migrating cells) via multiple pathways [20, 21]. Key to MT-mediated establishment of cellular asymmetry is the polarized (radial) organization of these structures, with slow-growing minus-ends anchored at the centrosome and the faster growing plus-ends clus-tered at the leading edge, adjacent to the cell cortex [22]. In addition to their role in cell migration, dynamic MTs play an active role in cell elongation and maintenance of
homeostatic length [23]. The role of stable MTs in cellular dynamics is less well established.
MT stability and dynamics are regulated in part by microtubule-associated proteins (MAPs). Members of the MAP1 family bind along the entire MT lattice. MAP1B, a founding member of this family, is post-translationally cleaved into a heavy chain (HC) and a light chain (LC1) [24]. The heavy chain contains do-mains for actin, MTs and LC1 binding [25–27] and can therefore crosslink MTs and microfilaments [28, 29]. The light chain also binds MTs and actin and regulates the cytoskeleton [30, 31]. MAP1B proteins were first identified based on their MT-stabilizing properties [31–33]. However, unlike tau, MAP1B preferably asso-ciates with dynamic (tyrosinated) MTs, helping to maintain a pool of dynamic MTs required for axonal elongation [34, 35]. This activity of MAP1B is con-trolled by several kinases, including Glycogen synthase kinase-3β (GSK-3β), which increases MAP1B MT bind-ing and dynamicity [36]. The poor MT stabilizbind-ing prop-erties of MAP1B combined with its ability to promote MT dynamics, suggest MAP1B function differs from the other MAPs [35]. MAP1B is also expressed prior to other members of this family in the nervous system [37–40], as it is observed in neuronal progenitors prior to their last mitotic division [41]. Despite this early expres-sion and function in promoting MT dynamics, MAP1B has not been implicated in early stages of neural tube development.
We investigate here whether zebrafish Map1b plays a role in the polarized cell movements that shape the neural rod during NC. Our studies reveal that MTs undergo major changes during neural tube formation, as they become progressively more stable and elon-gated. The perturbation of cell elongation and polarized migration following nocodazole and paclitaxel treatments suggests that the regulation of MT stability during NC is essential for proper completion of this process. To gain insight into underlying mechanism, we characterized the function of Map1b, previously shown to promote MT dynamicity in axons. map1b is expressed earlier than previously reported, in the developing neural tube and underlying mesoderm. Loss of Map1b function using morpholinos (MOs) or δMap1b, encoding a truncated Map1b protein product, resulted in delayed NC and duplication of the neural tube, a defect previously ob-served in PCP mutants in which NC is also defective [12]. We observed a loss of stable MTs in these em-bryos that is likely to contribute to the NC defect. Lastly, we reveal that Map1b mediates cell elongation in a cell autonomous manner and polarized protrusive activity, two cell behaviors that underlie NC and are MT-dependent. Together, these data highlight the importance of MTs in the early morphogenetic movements that shape
the neural tube and reveal a novel role for the MT regula-tor Map1b in mediating cell elongation and polarized cell movement in neural progenitor cells.
Results
Microtubules undergo dramatic changes during neurulation
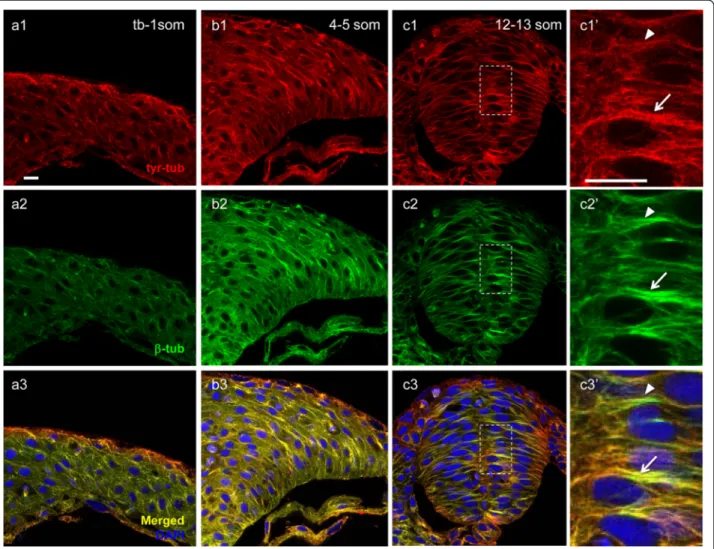
During early stages of neurulation, MTs appear to undergo global morphological changes. Immunolabel-ing with anti-β−tubulin (anti-β-tub, a marker for the total MT population) revealed that at the neural plate stage (tb-1 som), when neural cells extend polarized
protrusions towards the midline, MTs are distributed throughout the cytosol (Fig. 1a, a’), consistent with the radial organization we previously reported [42]. In con-trast, at the neural keel stage (so named because of the keel shape adopted by the neural tissue as it transition from a neural plate to a neural rod, 4–5 som) and neural rod (12–13 som) stage, MTs organize into long linear arrays (bundles), which align along the future apico-basal axis of neural cells, coincident with epithe-lialization that occurs following NC (Fig. 1b–c’) [43].
The organizational changes observed in MTs suggest that they become increasingly stable as neurulation
Fig. 1 Microtubules become increasingly stabilized during neurulation. Hindbrain sections of embryos at the neural plate (tb-1 som) (a, a’, d, d’), neural keel (4–5 som) (b, b’, e, e’) and neural rod (12–13 som) (c, c’, f, f’) stages immunolabeled with anti-β-tub (total MTs) in green (a–c’) and anti-glu-tub (detyrosinated MTs) in red (d–f’). (a’–c’) and (d’–f’) Higher magnification of boxed areas in (a–c) and (d–f), respectively. Scale bars: 10 μm
progresses. In order to investigate the distribution of stable MTs at different stages of neurulation, embryos were immunolabeled with anti-detyrosinated-tubulin (glu-tub). Glu-tub antibodies recognize stable, detyrosi-nated MTs by binding to the exposed carboxy-terminal glu-tamic acid of α-tubulin (α-tub) in MT polymers [44, 45]. At the neural plate stage, glu-tub labeling is diffuse and more punctate than β-tub (Fig. 1d, d’). However, by the neural keel stage (Fig. 1e, e’) detyrosinated MTs organize into linear structures, which become more accentuated at the neural rod stage (Fig. 1f, f’). The distribution of glu-tub labeling thus implies that detyrosination of MTs occurs initially in discrete foci along the MT mers that subsequently expand to include the entire poly-mer. These observations suggest that stable MTs increase over time, reaching elevated levels in the epithelialized neural tube. To quantify the relative abundance of stable
MTs, we analyzed the ratio of glu-tub (stable MTs) to α-tub (total MTs) at the neural plate (tb), neural keel and neural rod stages and found this ratio to be highest at the neural rod stage (Additional File 1: Figure S1).
We next analyzed the distribution of dynamic MTs using an antibody that specifically recognizes the tyrosi-nated form of α-tubulin (anti-tyr-tub) [46]. In contrast to the spotty distribution of glu-tub at the neural plate and neural keel stages, tyr-tub was abundant and ap-peared to near fully overlap with the bulk of MTs labeled withα β-tub (Fig. 2a1–a3, b1–b3), with the exception of discrete puncta of α tyr-tub labeling that may corres-pond to depolimerized tyrosinated tubulin (Fig. 2b3). At the neural rod stage, the overlap remained extensive but some segments of MT bundles were more intensely la-beled with anti- β-tub than with anti- tyr-tub (Fig. 2c3, c3’). These regions may coincide with areas of MT
Fig. 2 Distribution of dynamic microtubules during neurulation. Hindbrain sections of embryos at the neural plate (tb-1 som) (a1–a3), neural keel (4–5 som) (b1–b3) and neural rod (12–13 som) (c1–c3’) stages immunolabeled with anti-tyr-tub (dynamic MTs) in red (a1, b1, c1, c1’), anti-β-tub (total MTs) in green (a2, b2, c2, c2’). (a3, b3, c3, c3’) Red-Green overlay (yellow) of images in (a1-c2’) with nuclei labeled in blue using DAPI. (c1’-c3’) Higher magnification of boxed areas in (c1–c3). Arrows indicate high overlap between anti-tyr-tub and anti-β-tub; arrowheads indicate area of reduced overlap between these two markers. Scale bars: 10μm
stabilization (arrowhead in Fig. 2c3’). Thus, dynamic MTs represent the bulk of the MT population during NC, while stable MTs steadily increase over time.
Microtubules are required for NC
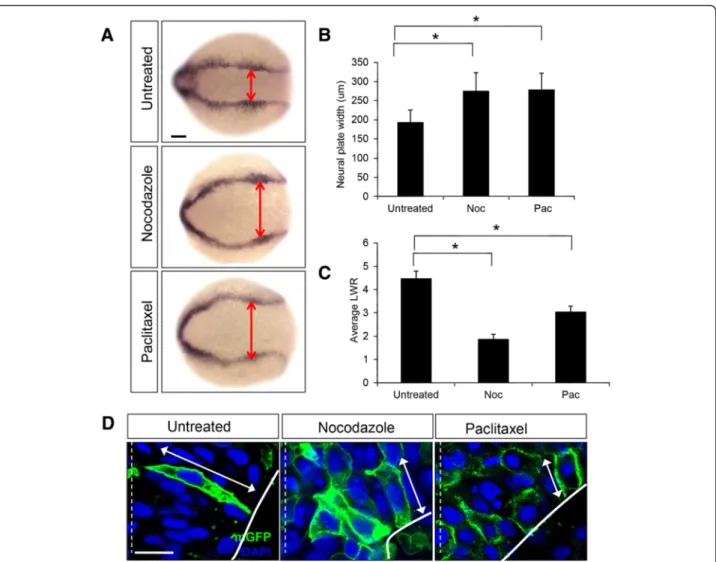
The striking increase in the levels of detyrosinated MTs suggests that the stability of these cytoskeletal elements is regulated during neural tube development and likely to be important for neural tube morphogenesis. To test this, we treated early neural stage (2–3 som) embryos with nocodazole (17 and 32μM) or paclitaxel (50 μM), which destabilize and hyperstabilize MTs respectively, and analyzed the effect of these drugs on cell behaviors at the neural keel stage (4–5 som). The efficacy of these drugs was first confirmed by immunolabeling with anti-β-tub, which revealed that the linear organization of MTs was disrupted following both treatments (Additional file 2: Figure S2).
To analyze the effect of altering MT stability on NC following nocodazole or paclitaxel treatments, the width of the neural plate was assessed using dlx3, a gene expressed at the border of the neural and non neural ectoderm. While untreated embryos displayed no NC defects, the neural plates of nocodazole and paclitaxel-treated embryos were abnormally wide (A,B) (unpaclitaxel-treated embryos: 194μm ± 31 μm, n= 38 embryos; nocodazole-treated (17μΜ): 276 μm ± 47 μm, n = 34 embryos; paclitaxel-treated (50μM): 279 μm ± 47 μm, n = 42 em-bryos). In order to investigate the underlying cellular cause for the NC defects, embryos mosaically expressing cell-surface Green Fluorescent Protein (mGFP) were ex-posed to nocodazole (17 and 32μM) or paclitaxel (50 μM) and imaged in the hindbrain region at the neural keel (4– 5 som) stage. Cells were significantly shortened follow-ing treatment with nocodazole and paclitaxel (Fig. 3c), as determined by length-to-width (LWR) ratio mea-surements (LWR of untreated cells: 4.48 ± 0.3, n = 26 cells from 7 embryos; LWR of nocodazole-treated cells 1.9 ± 0.19, n = 18 cells from 4 embryos; LWR of paclitaxel-treated cells: 3.0 ± 0.24, n = 30 cells from 7 embryos) (Fig. 3D), indicating sensitivity to perturba-tions of the MT network that either destabilize or hyperstabilize MTs.
In order to investigate whether MTs play a role in po-larized cell migration, time-lapse confocal imaging was carried out at the neural plate (tb-1 som) stage using control and nocodazole-treated embryos mosaically ex-pressing mGFP. Cells from untreated embryos exhibit an elongated appearance with protrusions oriented medi-ally, as previously described [8]. In contrast, cells from nocodazole-treated embryos were rounded in shape and failed to migrate in a directional manner, as a result of ran-domized membrane protrusions (Additional files 3 and 4). This observation suggests that MTs are not required for
the formation of protrusions but are rather implicated in the proper polarization of these extensions.
Together these findings identify MTs as key mediators of cell elongation and polarized cell movement during NC. They further suggest that regulation of MT stability is tightly controlled during early development, pointing to a potential role for microtubule-associated proteins (MAPs) in this process.
Zebrafish map1b is expressed in the developing neural tube
Mammalian MAP1B is one of the earliest MAPs to be expressed in the developing nervous system and hence a good candidate for mediating early morphogenetic movements during neural tube formation. Gene ontol-ogy analysis revealed a high level of sequence similarity between zebrafish Map1b and its orthologues in chick, mouse, rat and human. The regions of highest conserva-tion (98 % identity) comprise a stretch of 550 amino acids in the N-terminus and 120 amino acids in the C-terminus [31]. Mammalian MAP1B contains two MT-binding do-mains, each composed of multiple repeats of KKEE or KKEI/V motifs [26, 30]. Domain analysis of zebrafish Map1b revealed the presence of the conserved KKE signa-ture repeats at the N-terminus, in the region encoding the heavy chain. Furthermore, synteny analysis showed that zebrafish map1b is located in a conserved region of the genome.
In order to determine whether zebrafish map1b is expressed during neurulation, we performed whole-mount in situ hybridization. We observed that map1b is broadly distributed at the neural plate (tb-1som), neural keel (4–5 som) and neural rod (8–10 som) stages (Fig. 4a–c). Its expression appears to be in a gradient that is highest in the mesoderm at the neural plate stage (Fig. 4a). By the neural keel and rod stages the level of map1b increases and expression expands dorsally, as map1bis present throughout the developing neural tube (Fig. 4b, c). To confirm that the signal observed at these developmental stages is specific, in situ hybridization using a sense riboprobe was also performed. No labeling was observed with the latter (Fig. 4a’–c’).
These observations indicate that map1b is expressed earlier than previously reported, in undifferentiated neural progenitor cells undergoing NC.
Depletion of Map1b causes NC defects
We next tested whether map1b is required for NC by performing functional studies using two splice-blocking MOs (map1b MO1 and map1b MO2, Additional file 5: Figure S3). RT-PCR analysis confirmed that these MOs block map1b mRNA splicing (Additional file 5: Figure S3). We observed that the neural plate of map1b MO1 (10 ng)- and map1b MO2 (4 and 10 ng)-injected
embryos were significantly wider than those of uninjected and standard control MO (4 ng)-injected embryos (unin-jected: 272μm ± 11 μm, n = 58 embryos; standard MO: 220μm ± 7 μm, n = 29 embryos; map1b MO1: 332 μm ± 15μm, n = 8 embryos; map1b MO2: 319 μm ± 10 μm, n = 68 embryo; Fig. 5a), suggesting that map1b is required for NC. A MO targeting pard3 (10 ng), a gene implicated in later aspects of neural tube development [42, 47], was used as an additional negative control and confirmed to not cause an NC defect (pard3-MO: 200 ± 15μm, n= 14 embryos; Fig. 5a). To further confirm these results, a translation-blocking map1b MO (MO3) was designed, but
was found to be less effective than the splice-blocking MO1 at producing a widened neural plate phenotype. However, co-injection of MO3 (10 ng) with lower con-centrations of map1b MO1 (4 ng) resulted in a wider neural plate, which was not observed in embryos injected with map1b MO1 alone at the suboptimal con-centration (uninjected embryos: 165 ± 21 μm, n = 10 embryos; map1b MO1 (4 ng): 145 ± 24μm, n = 13 em-bryos; map1b MO3 (10 ng): 212 ± 23μm, n = 26 embryos; map1bMO1 (4 ng) + MO3 (10 ng); 291 ± 29μm, n = 24 embryos) (Additional file 5: Figure S3). Therefore, we con-clude that the neural plate widening we observe is most
Fig. 3 Regulation of microtubule dynamics is required for NC. a Dorsal views of untreated, nocodazole-treated (5μg/ml) and paclitaxel-treated (50μM) embryos labeled by in situ hybridization with the dlx3 riboprobe. Double red arrowheads indicate the width of the neural plate. Scale bar: 100μm . b Quantification of the neural plate width (μm) in control (untreated) and drug-treated embryos. (*) indicates statistical significance (P <0.001 for untreated vs nocodazole and untreated vs paclitaxel) using a Kruskal-Wallis test followed by Dunn’s post-hoc test. c Quantification of the length-to-width (LWR) ratio of mGFP-labeled cells in control (untreated), nocodazole-treated, and paclitaxel-treated embryos at the 4–5 som stage. (*) indicates statistical significance (P <0.001 for untreated vs nocodazole and P <0.01 for untreated vs paclitaxel) using a Kruskal-Wallis test followed by Dunn’s post-hoc test. d Hindbrain sections of 4–5 som control (untreated), nocodazole-treated and paclitaxel-treated embryos mosaically expressing mGFP (green). Nuclei are labeled in blue with DAPI. Double arrows indicate cell length. The dotted white line represents the midline. Scale bar: 10μm
Fig. 4 map1b mRNA distribution. Expression of map1b mRNA in hindbrain sections detected by in situ hybridization using anti-sense (a, b and c) or sense (a’, b’ and c’) probes. (a, a’) neural plate, (b, b’) neural keel, (c, c’) neural rod stage embryos. The neural tissue is delineated by a dotted line. Scale bar: 20μm
Fig. 5 map1b depletion causes NC defects. a Quantification of the width of the neural plate (μm). (*) Indicates statistical significance (P <0.01 for uninjected vs map1b MO2; P <0.001 for uninjected vs δmap1b-injected) using a Kruskal-Wallis test followed by Dunn’s post-hoc test. b Hindbrain sections of uninjected and map1b MO1-injected embryos at 24hpf, labeled with Phalloidin (cortical actin, green) and DAPI (nuclei, blue). Asterisks indicate the ventricles of the duplicated neural tube. Scale bar: 10μm
likely due to loss of map1b rather than an off-target effect of the MOs.
The MT-binding affinity and activity of Map1b is known to be modulated by several kinases, including Gsk3β [48–50]. Consistent with this model, we observed a widened neural plate in embryos in which Gsk3β was dis-rupted with a translation-blocking MO and a synergistic interaction between Gsk3β and map1b (data not shown).
To evaluate whether map1b disruption results in later developmental defects, map1b MO1 and MO2 (10 ng)-injected embryos were imaged at 24 hpf. We observed a disorganization of the hindbrain region in these em-bryos, characterized by absence of morphological land-marks (Additional file 5: Figure S3) that were more pronounced with MO1 than MO2. Sectioning through the hindbrain of MO1-injected embryos revealed that the disorganization was caused by a partial (n = 4 out of 10 embryos) or full (n = 1 out of 10 embryos) dupli-cation of the neural tube (Fig. 5b). This striking pheno-type was first observed in PCP mutants [12] and is thought to be a consequence of delayed NC [47, 51]. In addition to the disorganized hindbrain, we observed a shortened body axis (Additional file 5: Figure S3), a phenotype often associated with impaired convergent extension in the axial mesoderm [52].
Truncated Map1b lacking the MT-binding-domain causes delayed NC
In order to confirm the role of Map1b in mediating NC using a MO-independent method, we designed a con-struct based on a mouse mutation thought to function as a dominant-negative allele [31, 53, 54]. The zebrafish mutant construct, δmap1b, encodes the first 571 aa of Map1b, which includes the Map1b light chain (LC1) binding domain (in the heavy chain region) but not the MT-binding domain (6A). Mice that are heterozygous for this mutation have a spectrum of phenotypes in-cluding slow growth rates and small eyes, while their homozygous siblings die during embryogenesis [53]. Interestingly, zebrafish embryos injected with δmap1b RNA (25, 50, 75 and 100 ng/μl) exhibit an increasingly severe reduction in body and eye size with higher con-centrations of RNA (Additional file 6: Figure S4B), sug-gesting that the truncated Map1b protein functions in a similar manner in both species.
To test whether δMap1b disrupts NC, we injected an intermediate concentration of δmap1b RNA (50 ng/μl) and performed the previously described convergence assay. As was reported for map1b MO1 and MO2-injected em-bryos, we observed delays in NC inδmap1b-injected relative to controls (Fig. 5a) (uninjected: 272μm ± 11 μm, n = 58 embryos vsδmap1b: 355 μm ± 13 μm, n = 45 embryos).
The more severe phenotype in δmap1b-injected embryos compared to map1b MO-injected embryos
suggests that δMap1b functions in a dominant-negative manner. Given that δ Map1b retains the ability to bind to LC1 [31], which is implicated in the regulation of MT stability and other MT-independent processes [31, 55], it is likely that depletion of this peptide accounts for some of the pronounced defects observed in injected embryos. In addition, the unbound endogenous heavy chain in δmap1b-injected embryos may also play a contributing role.
Together these findings reveal a previously unknown role for Map1b in mediating NC in the neural ectoderm. The fully or partially duplicated neural tube observed in map1bMO-injected embryos is consistent impaired NC. Furthermore, the fact that a neural tube, albeit abnor-mal, forms in Map1b-depleted embryos indicates that Map1b is required for the timely progression rather than completion of neurulation.
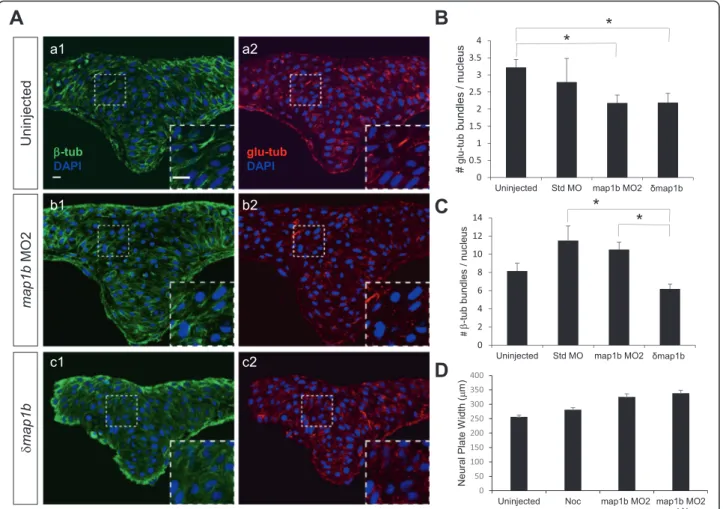
Loss of Map1b results in the loss of stable microtubules Previous studies indicate that Map1b maintains a dy-namic population of MTs that promotes axonal growth [48, 56]. If Map1b plays a similar role in the neuroecto-derm, its loss-of-function should result in increased MT stability. To test this prediction, neural keel (4–5 som) stage uninjected, standard MO-injected, map1b MO2-injected and δmap1b-injected embryos were sectioned and labeled with anti-β-tub (total MTs), anti-glu-tub (stable, detyrosinated MTs) and DAPI (nuclei) and imaged at the hindbrain level. Unlike the dramatic per-turbation of the MT network observed following treat-ments with nocodazole and paclitaxel (Additional file 2: Figure S2), the overall organization of MTs visualized with β-tub labeling in map1b MO2- and δmap1b-injected embryos appeared similar to controls (Fig. 6a), although in some samples (insets in Fig. 6a b1, c1) the β-tub-labeled bundles were less well defined than those of uninjected (inset in Fig. 6a a1) and standard MO (data not shown).
Enhanced MT stability is often manifested in either an increase in MT bundle length or the average num-ber of MT bundles/cell. Quantification of the length of glu-tub- and β-tub-positive bundles in the different treatment groups did not reveal any differences (data not shown). However, the average number of stable, glu-tub-positive bundles per cell (nucleus) revealed an unexpected decrease in map1b MO2- and δmap1b-injected embryos relative to unδmap1b-injected embryos (Fig. 6b) (uninjected embryos: 3.2 ± 0.23, n = 13 embryos; standard MO-injected embryos: 2.8 ± 0.69, n = 3 embryos; map1b MO2-injected embryos: 2.18 ± 0.23, n = 6 embryos; δmap1b-injected embryos: 2.19 ± 0.27, n = 9 embryos). Although a decrease in bundle number in experimental groups relative to standard MO-injected embryos was also observed, this number was not statistically significant,
most likely due to the smaller sample size of the latter (Fig. 6b). These observations suggest that in the context of NC, Map1b functions to stabilize MTs rather than pro-mote MT dynamics.
A decrease in total bundle number per cell was also ob-served with β-tub labeling, but only in δmap1b-injected embryos (uninjected embryos: 8.16 ± 0.85, n = 14 embryos; standard MO-injected embryos: 11.5 ± 1.6, n = 5 embryos; δmap1b-injected embryos: 6.18 ± 0.54, n = 9 embryos) (Fig. 6c). This reduction is unlikely to reflect the loss of stable MTs from the total MT population given that a de-crease in total MTs was not observed in map1b MO2-injected embryos. Thus, δMap1b may disrupt total MTs (dynamic and stable) whereas map1b-MO2 alters stable MTs specifically. However, a more likely explanation, is that
the apparent loss of total MT bundles inδmap1b-injected embryos reflects subtle changes in the organization of the MT cytoskeleton (bundles that are less well defined) that make the automated quantification method less accurate.
To more directly tease apart the role of Map1b in regulating stable versus dynamic MTs, we also analyzed the levels and distribution of tyrosinatedα-tub (dynamic MTs) in map1b-MO2- and δmap1b-injected embryos. We did not observed an obvious difference in the num-ber and organization of tyr-tub MTs in these embryos (map1b MO2-injected embryos: n= 4 embryos; δmap1b-injected embryos: n= 3 embryos) relative to controls (uninjected embryos: n = 5 embryos). We did however notice an increase in the number of puncta labeled with anti tyr-tub (arrowheads in Additional File 7: Figure S5).
Fig. 6 Microtubule stability is altered in Map1b-depleted embryos. a Hindbrain sections of uninjected (a1, a2), map1b MO2-injected (b1, b2) and δmap1b-injected (c1, c2) embryos at 4–5 som immunolabeled with anti-β-tub (green, a1, b1, c1) and anti-glu-tub (red, a2, b2, c2). Nuclei are labeled in blue with DAPI. Insets show higher magnification of boxed areas. Scale bars: 10μm. b Quantification of the average number of glu-tub - labeled bundles per nucleus in uninjected, standard MO-injected, map1b MO2-injected and δmap1b-injected embryos. (*) Indicates statistical significance (P <0.05 for uninjected vs map1b MO2 and P <0.05 for uninjected vs δmap1b-injected) using ANOVA followed by a Bonferroni post test. c Quantification of the average number ofβ-tub labeled bundles per nucleus in uninjected, standard MO-injected, map1b MO2-injected and δmap1b-injected embryos. (*) Indicates statistical significance (P <0.01 for standard MO vs δmap1b-injected) using ANOVA followed by a Bonferroni post test (d) Quantification of the neural plate width in control (uninjected), map1b MO2-injected embryos, nocodazole (3 μΜ)-treated embryos, and map1b MO1-injected embryos μΜ)-treated with nocodazole
Since re-tyrosination has been reported to occur on the non-assembled tubulin dimer pool [57], these puncta may correspond to depolimerized tubulin. Overall these observations suggest that loss of Map1b does not impact dynamic MTs.
To further test whether Map1b is implicated in MT stabilization, we performed a nocodazole sensitization test in map1b MO2-injected (4 ng) embryos. However, treatment of these embryos with a low dose of nocoda-zole (1 μg/ml) did not worsen NC defects (Fig. 5d). This may be due to intrinsic differences in the mecha-nisms by which these molecules alter MT properties. Alternatively, Map1b may function via additional MT-independent mechanisms to promote NC.
Map1b functions cell-autonomously to regulate cell elongation
In order to identify the cellular mechanisms underlying delayed NC in Map1b-deficient embryos, we analyzed the morphology of hindbrain cells mosaically expressing mGFP at the neural keel (4–5 som) stage. We observed that in contrast to control (uninjected) cells (Fig 6a a–a’), cells in map1b MO1 (data not shown), map1b MO2- and δmap1b-injected embryos failed to elongate (Fig. 7a b – b’, c-c'), as was observed with drug-treated embryos (Fig. 3c, d). LWR measurements of control and Map1b-deficient cells revealed a significant difference in cell shape (LWR of uninjected cells = 3.70 ± 0.1, n = 111 cells from 7 embryos; LWR of cells from embryos injected with map1bMO2 = 2.78 ± 0.2, n = 43 cells from 5 embryos; LWR of cells from embryos injected withδmap1b = 2.41 ± 0.1, n = 135 cells from 9 embryos) (Fig. 7b). Thus, Map1b is required for cell elongation during NC and its ability to regulate MTs may underlie this process.
Since map1b is expressed in the mesoderm and neu-roectoderm (Fig. 4), it is possible that the widened neural plate of Map1b-deficient embryos is an indirect consequence of defective convergent extension move-ments in the mesoderm [52]. If Map1b functions in a cell-autonomous manner in the neuroectoderm to regu-late cell elongation, then Map1b-deficient cells isochroni-cally transplanted into WT hosts are expected to be rounded. Conversely, isochronic transplantation of control (WT) cells into Map1b-deficient embryos should not im-pact the ability of these donor cells to adopt their correct elongated morphology.
To perform the first isochronic transplantation ex-periment, donor embryos were injected with RNA en-coding mRFP with or without map1b MO1 (10 ng) and host embryos were injected with mGFP DNA (which is mosaically expressed). Cell shapes of both donor (red) and host (green) cells were analyzed in hindbrain sections of host embryos fixed at the neural keel stage
(4–5 som). We observed that transplanted control cells were similar in shape to WT host cells (LWR of control cells = 3.37 ± 0.5, n = 100 cells from 18 embryos; LWR of host cells = 3.52 ± 0.69, n = 88 cells from 14 embryos; Fig. 7c, d a–a’), whereas transplanted Map1b-deficient cells consistently appeared rounder than WT host cells (LWR of map1bMO1-injected cells = 1.51 ± 0.27, n = 135 cells from 14 embryos; LWR of WT host cells = 3.63 ± 0.52, n = 92 cells from 14 embryos; Fig. 7c, d b–b.2’). There was no apparent bias to the location of transplanted cells in the neural tube of their hosts, eliminating position as a contributing factor to differences in cell shape. These data reveal that Map1b functions cell autonomously to regulate cell elongation in the neural ectoderm.
The reciprocal isochronic transplantation could not be completed as the Map1b-deficient hosts did not survive the transplantation.
Map1b is required for polarized migration during NC To test whether Map1b plays a role in polarized cell migration during NC, mGFP-labeled cells in control (uninjected) and map1b MO1(10 ng)-injected embryos were imaged using time-lapse microscopy (Fig. 8a and Additional files 8 and 9). Cell tracing revealed that control cells (from uninjected embryos) were initially rounded and gradually elongated as they approached the midline. In contrast, cells in map1b MO1-injected embryos took longer to elongate, consistent with the LWR measurements of cells in fixed preparations. In addition, their migration towards the midline was de-layed (Fig. 8b; n = 3 embryos; 6–9 cells/embryo).
In order to determine whether delayed migration in map1bMO1-injected embryos was caused by defective protrusive activity, as observed in drug-treated em-bryos, the angular distribution of plasma membrane ex-tensions was quantified and ploted. At the neural plate (tb-1 som) and neural keel (4–5 som) stages, membrane protrusions of control cells were biased towards the medio-lateral axis, whereas the membrane protrusions in Map1b-deficient cells were less polarized and failed to align with the medio-lateral axis (Fig. 8c). Together these findings suggest that Map1b mediates both cell elongation and the polarized orientation of protrusive activity, two cell behaviors that are MT-dependent.
Discussion
MTs are required for NC
Cellular dynamics during convergent extension move-ments in vertebrates are powered by actin polymerization, cell-cell adhesion and cell-extracellular matrix (ECM) in-teractions [52]. Since MTs play a prominent role in cell migration [17, 22], it seems intuitive that they would also be implicated in the mechanics of cellular rearrangements
during convergent extension in the mesoderm and neurec-toderm. There is some experimental evidence supporting MT-mediated cellular rearrangement in the mesoderm, however, there is a dearth of data on the involvement of MTs during NC. With respect to the mesoderm, disrup-tion with nocodazole in early gastrula Xenopus embryos prevents mediolateral intercalation, involution and conver-gent extension of the marginal zone (the precursor of the mesoderm) [58]. Kwan and Kirschner further demon-strated that treatment of Xenopus dorsal marginal zone ex-plants with nocodazole but not taxol prevents lamellipodia formation, indicating that the bulk of po-lymerized tubulin rather than MT dynamics (which
would be altered by both drug treatments) is important for convergent extension [59]. In zebrafish embryos, MTs are known to mediate cell-cell contacts and initi-ation of planar polarity, by localizing PCP pathway component Prickle in a polarized manner during meso-dermal convergent extension [60].
In amniotes, narrowing of the neural plate is brought about by a combination of cell elongation and intercal-ation. In chick embryos, treatment of the neural plate with nocodazole prevents cell lengthening along the apico-basal axis, resulting in a wider neural plate [61]. While it is currently unknown whether MTs also power cell intercalation in amniotes, the medio-lateral oriented
Fig. 7 Map1b functions cell autonomously in the neural ectoderm. a Hindbrain sections of 4–5 som uninjected (a, a’), map1b MO2-injected (b, b’) andδmap1b-injected (c, c’) embryos mosaically-expressing mGFP (green). Nuclei are labeled in blue with DAPI. (a’–c’) Higher magnification of boxed areas in (a–c) respectively. Scale bars: 20 μm. b Quantification of the LWR of cells in 4–5 som uninjected, map1b MO2-injected and δmap1b-injected embryos. (*) Indicates statistical significance (P <0.01 for uninjected vs map1b MO2 and P <0.001 for uninjected vs δmap1b-injected) using a Kruskal-Wallis test followed by Dunn’s post-hoc test. c Quantification of the LWR of control donor cells vs host WT cells and map1b MO1-injected donor cells vs host WT cells. (*) Indicates statistical significance (P <0.0001) using Student’s T-test. d Hindbrain sections of 4–5 som WT hosts mosaically-expressing mGFP and transplanted with (a) mRFP-labeled control donor cells or (b) mRFP-labeled map1b-MO1 donor cells. Nuclei are labeled with DAPI (blue). (a’, b1’ and b2’) Higher magnifications of boxed areas in (a, b1 and b2) respectively. Scale bars: 10 μm
basal protrusions that drive cellular rearrangement in the mouse epithelialized neural plate [9] are reminiscent of MT-dependent polarized basal protrusions in C. elegans epithelial cells undergoing dorsal closure [62], raising the possibility that MT-based mechanisms may also be employed to narrow the neural in chick and mouse embryos.
We have previously shown that MTs in neural plate cells have a radial organization, which is characteristic of migratory cells. Following NC, MTs become linear, an architecture often observed in epithelial cells [42]. We report here that the levels of stable MTs steadily increase as neurulation proceeds. Our functional analysis using MT-disrupting drugs further suggests that proper regu-lation of MT stability is essential for both cell elongation and polarized migration during NC. In addition, the fact that protrusive activity is still observed (albeit random) in nocodazole-treated embryos, indicates that MTs are
required for polarization but not the formation of these membrane extensions.
Thus, despite the more prominent mesenchymal properties of zebrafish neural plate cells relative to their amniote counterparts, evidence suggests that MTs and their regulators play a central role in driving NC in vertebrates.
Map1b promotes stable microtubules
The prominent changes in MT stability during neurula-tion are likely to be regulated by microtubule associated proteins. We show here that stable/detyrosinated MTs are lost in Map1b-deficient embryos. The apparent se-lective reduction in detyrosinated MTs (observed in map1b MO2-injected embryos) argues against a role for Map1b as a general MT stabilizing factor. Rather, Map1b may protect stable MTs or promote theα-tub detyrosi-nation event that is revealed by glu-tub labeling.
Fig. 8 Polarized migration is disrupted in Map1b-depleted embryos. a Selected frames from time-lapse imaging of control (uninjected) and map1b-depleted mGFP-expressing cells in the neural plate. The white dotted line indicates the dorsal midline, when visible in the imaging field. Time elapsed (minutes) is indicated in the upper right corner. Red asterisks indicate individual cells identified in multiple frames. Scale bar: 10μm. b Representative traces of control and map1b-depleted cells traced over time. Traces corresponding to time 0 (t0 min, green) are to the right and traces of older cells (t56 min and higher, yellow) are to the left. c Plot of the average distribution of membrane protrusions in representative mGFP- labeled control and map1b-depleted cells at the neural plate stage. The red dotted line represents the position of the dorsal midline
Despite the focus on MTs in this study, it is likely that Map1b also influences the actin cytoskeleton. In this re-gard, Map1b is known to bind actin in addition to MTs [25, 63], thereby crosslinking the two cytoskeletons. Fur-thermore, Rac1 and Cdc42 are downstream effectors of Map1b [64] that are both implicated in the crosstalk be-tween actin and MTs [65].
Map1b regulates distinct cell behaviors during NC We have previously shown that, during NC, cells elong-ate as they migrelong-ate towards the dorsal midline. These cellular dynamics are accompanied by extensive protru-sive activity polarized along the medio-lateral axis [8]. Since perturbation of MT dynamics with nocodazole or paclitaxel prevents cell elongation and polarized migra-tion in the zebrafish neural plate (this study) and other contexts [23, 66-71], we investigated whether these cell behaviors are also altered in Map1b-depleted embryos.
We found that despite the broad distribution of mRNA in mesodermal and ectodermal cells, Map1b is required cell autonomously for cell elongation in the neural tissue. A recent study has shown that a polarized population of dynamic MTs is required for cell length maintenance in the zebrafish neural tube [23]. While our studies reveal a role for Map1b in promoting stable MTs rather than MT dynamicity, it is likely that both MT populations contrib-ute to cell elongation.
In addition to cell elongation, directional migration is also defective in Map1b-depleted embryos. Impaired migration may also be attributable to abnormal MTs, as stable MTs, anchored at the cell cortex, are thought to function as tracks to deliver regulators of actin polymerization to the leading edge [17]. Whether the same population of Map1b-regulated MTs mediates cell elongation and migration in the zebrafish neural tube is unclear.
Analysis of protrusive activity in Map1b-depleted em-bryos revealed a lack of biased orientation along the medio-lateral axis and ectopic persistent protrusions on the anterior and posterior pole of neural cells. This ab-normal protrusive activity may underlie the delay in cell elongation and migration. It is unclear how Map1b biases protrusive activity medially. However, the recent finding that Map1b binds and sequesters EB3 in the cytosol of developing neuronal cells [72] raises an inter-esting possibility. EB3 is a MT-plus end binding protein that is enriched in growth cones and has been shown to coordinate the interaction between F-actin (required for protrusive activity) and dynamic MTs during neuri-togenesis [73]. Furthermore, EB3-capped MT plus ends orient towards the leading edge in migrating cells, pos-sibly in response to an extracellular signal [17]. In this context, Map1b may regulate polarized protrusive ac-tivity by controlling the levels of EB3 available to asso-ciate with MT plus ends. In the absence of Map1b,
increased binding of EB3 to MTs plus ends could cause the formation of ectopic F-actin nucleation.
Despite the significant increase in neural plate width in map1b MO-injected embryos, the neural tube even-tually forms (albeit abnormally), indicative of a delay rather than blockage of NC. A similar outcome was also observed following depletion of PCP pathway com-ponents, suggesting compensatory mechanisms that en-sure proper completion of neural development.
Whether map1b function during NC is conserved re-mains to be determined, as neural tube defects have not been reported in mouse map1b knockouts [74], possibly due to functional redundancy among MAP family mem-bers [75, 76] or distinct cellular mechanisms underlying the narrowing of the neural plate. Despite these differ-ences, loss of Map1b function in mice also causes a delay rather than a blockage in neural development [34].
Conclusions
We show that MTs become progressively more stable as neurulation progresses. Drug treatments that either des-tabilize or hypersdes-tabilize MTs impair NC by disrupting cell elongation and polarization, indicating that the regulation of MT stability is a key event during neural tube develop-ment. We demonstrate that the microtubule-associated protein Map1b is broadly expressed during neurulation and promotes stable MTs. Furthermore, loss of Map1b function causes a delay in NC, cell autonomous disruption of cell elongation, impaired directional migration and polarized protrusive activity. Based on these findings, we propose that Map1b enables NC at least in part by maintaining a popula-tion of stable MTs.
Collectively, these studies identify map1b as a key regu-lator of early morphogenetic movements in the neural tube. It will be interesting in the future to identify the signaling pathways that function upstream of Map1b to control the MT cytoskeleton during NC.
Methods
Zebrafish strains
Studies were performed using wildtype (AB) strains. All experiments were approved by the University of Maryland, Baltimore County’s Institutional Animal Care and Use Committee (IACUC) and were performed ac-cording to national regulatory standards.
Embryo staging
Staging was done according to [77]. Stages of neurula-tion were defined as previously described [8].
Cloning of zebrafish map1b
RNA was extracted from 24 hpf AB embryos using TRIzol (Invitrogen, cat no. 15596–026). cDNA was synthesized with RETROscript (Invitrogen, cat no. AM1710) and
oligodT primers. Primers were designed to amplify a con-served, 302 bp region of zebrafish map1b corresponding to exon 5 (accession # XM_003198629):
Forward primer: 5’-AGCACCGTACATCCAGCCAACA-3’ Reverse primer: 5’-GCAAACAATGCAGAGTCACCCC GT-3’
PCR was performed using PfuUltra (Agilent Technolo-gies, cat no. 600385) and products were cloned into PCR II-TOPO vector (Invitrogen, cat no. K4600-01).
The δmap1b construct, a codon optimized sequence encoding the first 571 aa of zebrafish Map1b, was syn-thesized by Genewiz based on the published zebrafish map1bsequence (accession # XM_003198629).δmap1b was subsequently subcloned into the pCS2+ vector. Nucleic acid and morpholino injections
DNA encoding membrane-targeted Green Fluorescent Protein (mGFP) (Richard Harland, University of California, Berkeley, CA, USA) and Red Fluorescent Protein (mRFP) [78] for mosaic expression were prepared using a midi-prep kit (Macherey-Nagel, cat. no. 740410.10) and injected (50–200 pg) into one- to eight-cell stage embryos.
For RNA injections, mGFP or mRFP expressing plas-mids were linearized with NotI and transcribed using SP6 mMESSAGE mMACHINE kit (Ambion, cat. no. AM1340). 50 pg of RNA was injected into one- to four-cell stage embryos.
MOs were synthesized by GeneTools (Philomath, Ore-gon, USA) and injected into one- to four-cell stage em-bryos: map1b splice-blocking MO1 (4 or 10 ng), map1b splice-blocking MO2 (4 or 10 ng), map1b translation (ATG)-blocking MO3 (10 ng) and, as negative controls, pard3 (10 ng) and a standard negative control MO rec-ommended by GeneTools that targets a human beta-globin intron, causing little change in phenotype in any known test system (10 ng).
map1b MO1: 5’-CCAAGAAAAACAGTC ACTTACCTCT- 3’
map1b MO2: 5’-AATTTGACTTACAGA TTGGAGAGCT- 3’
map1b MO3: 5’-CCGCAGTATCAACCAGC GTCGCCAT- 3’
pard3 MO: 5’ TCAAAGGCTCCCGTGCTC TGGTGTC 3’ [79]
Gsk3β MO: 5’-GTTCTGGGCCGACCGGAC ATTTTTC-3’ [80]
Standard MO: 5’-CCTCTTACCTCAGTTAC AATTTATA- 3’ [81]
Microinjections were performed using a PCI-100 micro-injector (Harvard Apparatus, Holliston, MA, USA).
Cell transplantation
Transplantation was performed as described in [82]. 50–100 cells from donors were transplanted isochroni-cally into the animal pole of host embryos at the sphere to dome stage.
Drug treatments
Early neural keel stage (2–3 som) embryos mosaically expressing mGFP were manually dechorionated and ex-posed to nocodazole (concentrations ranging from 3 to 32μM) (Sigma, cat. no. M1404) or paclitaxel (50 μM) (Sigma, cat. no. T7191) until embryos reached 4–5 som stage (~30 min) at 28 °C. The embryos were immediately fixed overnight in 4 % paraformaldehyde (PFA) diluted in PBS at 4°C.
Time-lapse confocal microscopy
Time-lapse microscopy was performed as previously de-scribed [83]. Embryos were imaged using a Leica con-focal microscope (Leica SP5 TCS 4D) at 30 s-1 min intervals. Images were analyzed using the Leica LAS software, Image J (NIH) and Adobe PhotoShop.
Labeling and imaging of fixed preparations
For immunolabeling, embryos were fixed for 3 h with 4 % PFA diluted in MAB buffer (80mM KPIPES, 5mM EGTA, 1mM MgCl2, 0.2 % Triton-X, pH 6.4) at room temperature. Embryos were then sectioned (40μm, 1500 Sectioning System) and immunolabeling on floating sec-tions was carried out as in [84].
Antibodies used: mouse anti-β-tubulin (Sigma, Clone: TUB 2.1) at 1:500; rabbit anti-α-tubulin (Genetex, Clone: GTX108784) at 1:500; rabbit anti-tyrosinated tubulin (Millipore, ABT171) at 1:1000; rabbit anti-glu-tubulin (Millipore, Clone: AB201) at 1:1000 and rabbit anti-GFP (Invitrogen, cat. no. A11122) at 1:1000. Secondary anti-bodies conjugated to Alexa 488, Alexa 594, or Cy3 (Mo-lecular Probes, cat. nos A11001 and A11008; Mo(Mo-lecular Probes cat. A21442; Invitrogen cat. no. A10520) were used at a 1:500 dilution. Alexa Fluor 488-conjugated Phalloidin (Invitrogen, cat. no. A12379) at 1:75 and DAPI (Invitrogen, cat. No. D1306) were used according to manufacturer’s instructions.
For cell shape analysis, mGFP or mRFP RNA/DNA injected embryos were sectioned and either imaged dir-ectly (mRFP) or immunolabeled with anti-GFP prior to imaging. All fluorescently labeled sections were imaged using an SP5 confocal microscope (Leica SP5 TCS 4D). Wholemount in situ hybridization
ISH was conducted as described [85]. Plasmid contain-ing dlx3 (obtained from Igor Dawid, NIH) was linear-ized with NotI and T7 polymerase was used to generate anti-sense probe. map1b (in pCRII-TOPO vector) was
linearized using NotI and KpnI for sense and anti-sense probes, respectively. T7 and SP6 polymerases were used to generate anti-sense and sense probes respectively. ISH labeled embryos were sectioned and imaged using a Zeiss Axioscope2 microscope.
Whole cell lysis and Western blotting
~200 embryos were collected, dechorionated, and batch deyolked as described elsewhere [86] with the following modifications. After deyolking, cells were vortexed for one minute in lysis buffer (100 mM PIPES, 0.5 % Noni-det P-40, 1 mM MgCl2, 2 mM EDTA, 1 mM dithiothei-trol, 1:100 dilution of Sigma protease inhibitor cocktail, cat. No. P8340) and centrifuged for 5 min at high speed. Supernatant was boiled for 5 min in 2x SDS-loading buffer, run on a 4-20 % Tris-glycine polyacrylamide gel (BioRad, cat. no. 456–1085) and transferred onto a nitrocellulose membrane (Pall Corporation, cat. no. S80209). Blots were blocked in 5 % dry milk dissolved in PBST (1X PBS, 0.5 % Tween) for 30 min, then incubated with 1:1000 anti-α-tub (Millipore, clone DM1A) or 1:500 anti-glu-tub (Millipore, Clone: AB201). Blots were then incubated with 1:1000 anti-mouse or anti-rabbit HRP-conjugated secondary antibodies (Santa Cruz, cat. nos. SC-2005 and SC-2004). Blots were developed using an enhanced chemiluminescence kit (Thermo Scientific, cat. no. 34079).
Measurements and statistical analysis Length-to-Width ratios
LWRs were calculated as previously described [8].
Tracing and quantification of cell behaviors
Cell tracing of single cells over multiple time frames was performed using Metamorph (MolecularDevices).
Protrusion analysis
Stacks of images from time-lapse microscopy were flat-tened to a single frame per time point using Volocity v5.5 (Perkin-Elmer) and exported as tifs. Interphase cells that stayed in frame for the extent of the movie were selected. Using a plugin created for imageJ (NIH), indi-vidual cells were threshholded and the outline traced. Each cell was then divided into 8 segments based on the centroid and the orientation to the midline. Finally individual frames were overlaid and any new membrane extensions were counted for each frame. The percent protrusions for each section was then calculated and plotted in Mathematica v9 (Wolfram).
Synteny analysis
Performed using synteny (http://cinteny.cchmc.org/).
Statistical analysis
InStat (GraphPad) was used to run statistical analysis on data sets. Student’s T-test, ANOVA followed by Bonferroni or Kruskal-Wallis test followed by Dunn’s post-hoc test were used to analyze data groups as appropriate.
Quantification of Western band intensity
Band intensity was determined using digital scans followed by analysis with ImageJ (NIH). The area used to measure was constant for all experiments.
Quantification of MTs
Measurements of MT bundle length and number of MT bundles/nuclei were done using Volocity (Perkin-Elmer). A maximum intensity projection of the total confocal sections (40μm) imaged using the Leica SP5 was gener-ated. The neural keel was cropped to quantify only MT signal within the neural tissue. Filters that identified nu-clei (DAPI), stable MTs (glu-tub) and total MTs (β-tub) based on the standard deviation of intensity was used. To compensate for objects close together, an automated algorithm that separates object was run as part of the fil-ter. The measurements were automatically collected and analyzed in excel
Additional files
Additional file 1: Figure S1. Microtubule stability increases during neurulation. (A) Western blot of whole cell lysates blotted for glu-tub (stable MTs) andα-tub (total MTs) at neural plate (tb-1 som), neural keel (4–5 som) and neural rod (12 som) stages. Two bands (1) and (2) are observed for glu-tub. (B) Ratio of stable:total MTs at neural plate (tb-1 som), neural keel (4–5 som) and neural rod (12 som) stages, calculated using glu-tub bands 1 and 2 (A). (PDF 83 kb)
Additional file 2: Figure S2. Nocodazole and paclitaxol disrupt microtubule organization. (a-c’) Hindbrain sections of 4–5 som control (a, a’), nocodazole-treated (b, b’) and paclitaxel-treated (c, c’) embryos immunolabeled with anti-β-tub. (a’-c’) Higher magnifications of boxed areas in panels (a,b and c) respectively. Scale bars: 20μm. (PDF 8922 kb) Additional file 3: Time lapse imaging of cell behaviors during NC in a WT embryo (high magnification). Time-lapse movie (1 min intervals) of a control, mGFP-labeled embryo imaged from a dorsal view, anterior towards the top, beginning approximately at the 2–3 som stage and extending to the 6–7 som stage. (MOV 48 kb)
Additional file 4: Time lapse imaging of cell behaviors during NC in a nocodazole-treated embryo (high magnification). Time-lapse movie (1 min intervals) of a nocodazole-treated embryo, mosaically expressing mGFP, imaged from a dorsal view, anterior towards the top, beginning approximately at the 2–3 som stage. (MOV 163 kb)
Additional file 5: Figure S3. Efficacy of map1b MOs. (A) Schematic representation of zebrafish map1b, showing map1b MO1 binding site at the exon 4- intron 4 splice junction (red line and lettering), map1b MO2 binding site at the intron 4- exon 5 splice junction (blue line and lettering) and map1b MO3 at the translational start site (green line and lettering). Exons are represented by black boxes with corresponding numbers on top. (B) RT-PCR analysis of the region targeted by splice MOs . The upper (750bp) and lower (300bp) bands correspond to unspliced and spliced product respectively. (C) Quantification of the width of the neural plate (tb- 1 som) of control embryos and embryos injected with map1b MO1 (4 ng), map1b MO3 (10 ng) and map1b MO1 (4 ng) + map1b MO3 (10 ng).
* Indicates statistical significance using a Kruskal-Wallis test followed by Dunn’s post-hoc test (P <0.05 compared to the rest of the groups). (D) Side views of 24 hpf uninjected, map1b MO1-injected (10 ng) and map1b MO2-injected (10 ng) embryos. Black line indicates morphological defects in the hindbrain region. Anterior is to the left, dorsal is up. Scale bar: 250μm. (PDF 4983 kb)
Additional file 6: Figure S4.δmap1b construct and RNA titration. Representation of zebrafish full length Map1b andδMap1b protein indicating percent amino acid similarity to human ortholog. Black represents the highest level of homology and white, the lowest. Hatch marks indicate the MT-binding domain (MTBD). (B) Titration analysis of δmap1b RNA. Percent of embryos with WT, mild, moderate, severe and very severe phenotypes are indicated in the table for each concentration of RNA. (C) 24 hpf embryos correspond to the phenotypic categories in the table (a: WT, b: mild, c: moderate, d: severe e: very severe). Black arrowhead indicates missing eye. (PDF 2953 kb)
Additional file 7: Figure S5. Dynamic microtubules appear normal in Map1b-depleted embryos. Hindbrain sections of embryos at the neural keel (4–5 som) stage immunolabeled with anti-tyr-tub (dynamic MTs) in red (a2, b2, c2) anti-β-tub (total MTs) in green (a3, b3, c3). (a1, b1, c1) Red-Green overlay (yellow) with nuclei labeled in blue using DAPI. Boxed areas are shown in higher magnification in (a2-c3). Arrowheads indicate puncta exclusively labeled with anti-tyr-tub. Scale bars: 10μm. (PDF 9616 kb) Additional file 8: Time lapse imaging of NC in a WT embryo. Time-lapse movie (1 min intervals) of a control, mGFP-labeled embryo imaged from a dorsal view, anterior towards the top, beginning approximately at the 2–3 som stage and extending to the 6–7 som stage.] (MOV 581 kb) Additional file 9: Time lapse imaging of NC in a map1b MO1-injected embryo. Time-lapse movie (1 min intervals) of a map1b MO1 (10 ng)-injected embryo mosaically expressing mGFP, imaged from a dorsal view, anterior towards the top, beginning approximately at the 2–3 som stage and extending to the 6–7 som stage. (MOV 538 kb) Abbreviations
Hpf:Hours-post-fertilization; Map1b: Microtubule associated protein 1 b; MT: Microtubule; MO: Morpholino; NC: Neural convergence; Som: Somites. Competing interests
The author(s) declare that they have no competing interests. Authors’ contributions
PJ, VO and SS: performed the majority of the experiments and contributed to data analysis and manuscript preparation. EH: carried out the analysis of dynamic changes in MT organization in WT embryos and the initial studies on the effect of MT-disrupting drugs on cell elongation and migration. EV and JW worked with SS to perform Map1b loss of function studies using primarilyδmap1b but also map1b MO2 and performed data quantification for multiple experiments. RJM performed the analysis and quantification of the protrusive activity, assisted in the quantification of MT stability, carried out the statitiscal analyses for most experiments and helped to assemble figures. NSA designedδMap1b and assisted with the molecular work on this construct. AM characterized the function of Gsk3β. RMB supervised the research and data analysis and wrote the manuscript. All authors read and approved the final manuscript.
Acknowledgements
We thank the following people for their technical assistance: Robyn Goodman (cell transplantation experiments), Jeff Leips (statistical analysis), Lakshmi Goli (cell tracing) and Tim Ford (figure preparation). We appreciate the comments of Michelle Starz-Gaiano and Mark Van Doren on the manuscript. The Leica SP5 confocal microscope was purchased with funds from the National Science Foundation, grant # DBI-0722569. The research was supported by NIH/ NIGMS grants # GM085290-02S1 to V. Olmo and # GM085290 to R. Brewster. E. Vital was supported in part by a grant to UMBC from the Howard Hughes Medical Institute through the Precollege and Undergraduate Science Education Program, grant # 52008090.
Author details
1Department of Biological Sciences, University of Maryland Baltimore County,
Baltimore, MD, USA.2Institut de Biologie Paris Seine-Laboratoire
Neuroscience Paris Seine INSERM UMRS 1130, CNRS UMR 8246, UPMC UM 118 Université Pierre et Marie Curie, Paris, France.
Received: 21 July 2015 Accepted: 29 December 2015 References
1. Davidson LA, Keller RE. Neural tube closure in Xenopus laevis involves medial migration, directed protrusive activity, cell intercalation and convergent extension. Development. 1999;126(20):4547–56.
2. Morriss-Kay G, Wood H, Chen WH. Normal neurulation in mammals. Ciba Found Symp. 1994;181:51–63. discussion 63–59.
3. Lowery LA, Sive H. Strategies of vertebrate neurulation and a re-evaluation of teleost neural tube formation. Mech Dev. 2004;121(10):1189–97. 4. Smith JL, Schoenwolf GC. Further evidence of extrinsic forces in bending of
the neural plate. J Comp Neurol. 1991;307(2):225–36.
5. Colas JF, Schoenwolf GC. Towards a cellular and molecular understanding of neurulation. Dev Dyn. 2001;221(2):117–45.
6. Reichenbach A, Schaaf P, Schneider H. Primary neurulation in teleosts– evidence for epithelial genesis of central nervous tissue as in other vertebrates. J Hirnforsch. 1990;31(2):153–8.
7. Papan C, Campos-Ortega JA. On the formation of the neural keel and neural tube in the zebrafish Danio (Brachydanio) rerio. Roux’s Arch Dev Biol. 1994;203:178–86.
8. Hong E, Brewster R. N-cadherin is required for the polarized cell behaviors that drive neurulation in the zebrafish. Development. 2006;133(19):3895–905. 9. Williams M, Yen W, Lu X, Sutherland A. Distinct apical and basolateral
mechanisms drive planar cell polarity-dependent convergent extension of the mouse neural plate. Dev Cell. 2014;29(1):34–46.
10. Ybot-Gonzalez P, Savery D, Gerrelli D, Signore M, Mitchell CE, Faux CH, et al. Convergent extension, planar-cell-polarity signalling and initiation of mouse neural tube closure. Development. 2007;134(4):789–99.
11. Keller R, Shih J, Sater A. The cellular basis of the convergence and extension of the Xenopus neural plate. Dev Dyn. 1992;193(3):199–217.
12. Ciruna B, Jenny A, Lee D, Mlodzik M, Schier AF. Planar cell polarity signalling couples cell division and morphogenesis during neurulation. Nature. 2006; 439(7073):220–4.
13. Elul T, Keller R. Monopolar protrusive activity: a new morphogenic cell behavior in the neural plate dependent on vertical interactions with the mesoderm in Xenopus. Dev Biol. 2000;224(1):3–19.
14. Elul T, Koehl MA, Keller R. Cellular mechanism underlying neural convergent extension in Xenopus laevis embryos. Dev Biol. 1997;191(2):243–58. 15. Sausedo RA, Smith JL, Schoenwolf GC. Role of nonrandomly oriented cell
division in shaping and bending of the neural plate. J Comp Neurol. 1997; 381(4):473–88.
16. Wang J, Hamblet NS, Mark S, Dickinson ME, Brinkman BC, Segil N, et al. Dishevelled genes mediate a conserved mammalian PCP pathway to regulate convergent extension during neurulation. Development. 2006; 133(9):1767–78.
17. Siegrist SE, Doe CQ. Microtubule-induced cortical cell polarity. Genes Dev. 2007;21(5):483–96.
18. Mitchison T, Kirschner M. Dynamic instability of microtubule growth. Nature. 1984;312(5991):237–42.
19. Desai A, Mitchison TJ. Microtubule polymerization dynamics. Annu Rev Cell Dev Biol. 1997;13:83–117.
20. Waterman-Storer CM, Worthylake RA, Liu BP, Burridge K, Salmon ED. Microtubule growth activates Rac1 to promote lamellipodial protrusion in fibroblasts. Nat Cell Biol. 1999;1(1):45–50.
21. Brandt DT, Grosse R. Get to grips: steering local actin dynamics with IQGAPs. EMBO Rep. 2007;8(11):1019–23.
22. Kaverina I, Straube A. Regulation of cell migration by dynamic microtubules. Semin Cell Dev Biol. 2011;22(9):968–74.
23. Picone R, Ren X, Ivanovitch KD, Clarke JD, McKendry RA, Baum B. A polarised population of dynamic microtubules mediates homeostatic length control in animal cells. PLoS Biol. 2010;8(11):e1000542.
24. Hammarback JA, Obar RA, Hughes SM, Vallee RB. MAP1B is encoded as a polyprotein that is processed to form a complex N-terminal microtubule-binding domain. Neuron. 1991;7(1):129–39.