HAL Id: lirmm-01096039
https://hal-lirmm.ccsd.cnrs.fr/lirmm-01096039
Submitted on 16 Dec 2014
HAL is a multi-disciplinary open access
archive for the deposit and dissemination of
sci-entific research documents, whether they are
pub-lished or not. The documents may come from
teaching and research institutions in France or
abroad, or from public or private research centers.
L’archive ouverte pluridisciplinaire HAL, est
destinée au dépôt et à la diffusion de documents
scientifiques de niveau recherche, publiés ou non,
émanant des établissements d’enseignement et de
recherche français ou étrangers, des laboratoires
publics ou privés.
Attacking Randomized Exponentiations Using
Unsupervised Learning
Guilherme Perin, Laurent Imbert, Lionel Torres, Philippe Maurine
To cite this version:
Guilherme Perin, Laurent Imbert, Lionel Torres, Philippe Maurine. Attacking Randomized
Expo-nentiations Using Unsupervised Learning. COSADE: Constructive Side-Channel Analysis and Secure
Design, Apr 2014, Paris, France. pp.144-160, �10.1007/978-3-319-10175-0_11�. �lirmm-01096039�
Attacking Randomized Exponentiations Using
Unsupervised Learning
Guilherme Perin1, Laurent Imbert1, Lionel Torres1, and Philippe Maurine1,2
1
LIRMM/UM2 - 161, Rue Ada 34095 Montpellier
2
CEA-TECH LSAS laboratory - 880 Avenue de Mimet, 13541 Gardanne
Abstract. Countermeasures to defeat most of side-channel attacks on exponentiations are based on randomization of processed data. The ex-ponent and the message blinding are particular techniques to thwart simple, collisions, differential and correlation analyses. Attacks based on a single (trace) execution of exponentiations, like horizontal correlation analysis and profiled template attacks, have shown to be efficient against most of popular countermeasures. In this paper we show how an unsuper-vised learning can explore the remaining leakages caused by conditional control tests and memory addressing in a RNS-based implementation of the RSA. The device under attack is protected with the exponent blind-ing and the leak resistant arithmetic. The developed attack combines the leakage of several samples over the segments of the exponentiation in order to recover the entire exponent. We demonstrate how to find the points of interest using trace pre-processing and clustering algorithms. This attack can recover the exponent using a single trace.
Keywords: RSA, Randomized Exponentiation, Electromagnetic Analy-sis, Unsupervised Learning, Clustering Algorithms, Single-Execution At-tacks.
1
Introduction
Not only designers of cryptographic devices have to implement the algorithms efficiently, they also have to ensure that sensible information that leaks through several side-channels (time, temperature, power consumption, electromagnetic emanations, etc.) during the execution of an algorithm, remains unexploited by an attacker. If not sufficiently protected, both symmetric and asymmetric cryptographic implementations are vulnerable to these so-called side-channel attacks (SCA). For public-key algorithms such as RSA, the main operation to be armoured consists of a multi-digit exponentiation over a finite ring. In this paper, we present an improved single-execution attack on a randomized implementation of RSA. However, the ideas and tools that we exploit would also apply in the context of CRT-RSA and (hyper)elliptic curves.
Attacking an exponentiation consists of identifying the bits of the exponent, a value that is often to be kept secret (it is either a secret key or a random secret value). Simple side-channel attacks [2], which uses a single trace of execution, are easily protected using so-called constant-time algorithms such as square-and-multiply-always [4], the Montgomery ladder [7] or atomicity [23].
However, these constant-time algorithms are not sufficient to defeat the more powerful differential [3] and correlation attacks [5]. Although very efficient on not sufficiently protected implementations, these attacks suffer from the very large number of traces to be collected in order to recover (part of) the secret. Colli-sion attacks proposed by Fouque in 2003 [6] are very efficient; they only require two traces of execution on well chosen inputs. All these attacks are generally protected using exponent and/or message blinding using elementary algebraic manipulations. For example, randomization of an RSA exponent relies on the fact that md≡ md+rϕ(n)mod n for any (random) value r (see Section 5). Apart from these well known tricks, randomization can also take place at the arith-metic level. The LRA concept [9], based on the Residue Number System, seems to be a robust, yet efficient [24, 25] alternative to more expensive (hardware) countermeasures.
Novel attacks [14–17] have recently emerged. Unlike the well studied family of differential [3] and correlation attacks [5], these so-called horizontal correla-tion attacks (HCA), aim at correlating the Hamming Weight HW(m) of a known message m, with a set of well-chosen sample points tifrom one single trace. Some
of them [15, 17] are indeed efficient in the presence of message blinding. They exploit the very high regularity of multi-digit exponentiation algorithms and represent a very serious threat against classical randomization countermeasures. A major advantage of single-trace-based attacks is their natural immunity to ex-ponent blinding, since, in many cases, recovering a random exex-ponent is sufficient to break the cryptosystem (see Section 5).
Profiled template attacks can recover the exponent using few traces. As the original template attack [11] suggests, the attacker must have full control of the device. In particular, he must be able to send plain-texts of his choice to a known key device. In the case of public-key algorithms, the public-key is known and also can be used in the profiling phase. In this case, the pre-computations whose objective is to build the template set is refereed to as supervised learn-ing. In [13] supervised template attacks are successfully applied on modular exponentiations in order to differentiate squarings from multiplications. More recently, a template attack on constant-time exponentiation algorithms was pre-sented in [12], while [19] suggests a technique to attack the exponent blinding. A template attack targeting the memory addressing was presented in [22]. All those methods fall into the class of supervised attacks, i.e., a learning phase is required during which the adversary constructs templates by exploring the statistical characteristics of various types of operations.
When the adversary does not have a full control of the device, unsupervised methods are necessary. In [18], unsupervised learning has been presented to demonstrate the efficiency of localized EM attacks on exponentiations using a k-means clustering algorithm to differentiate the attacked samples. Their attack is performed on an ECC [27] implementation over a binary field using Lopez-Dahab coordinates [26]. The scalar is recovered using leakages collected during the exe-cution of a single scalar multiplication (k∈ Z, P ∈ E(F2m)−→ [k]P ∈ E(F2m).
traces from different probe positions1. The leakages obtained from these
multi-measurement sources are then combined together in order to reduce the signal-to-noise ratio. By doing so, they managed to classify the sampled points into two distinct sets which correspond to the zero bits (resp. non-zero bits) of the scalar k.
In this paper, we present a single-trace, single-probe unsupervised attack, i.e. the side-channel data is collected from one EM probe only. In the next sec-tions, we present the setting and statistical tools that we used to recover the entire exponent of a constant-time, randomized RSA implementation. Our at-tack is unsupervised because it does not require any a priori knowledge of the device, in particular we did not use the public key or send any chosen mes-sages in order to learn the characteristics of the device. The chip under attack is a constant-time, RNS-based FPGA implementation of RSA protected with the Leak Resistant Arithmetic [9] and exponent blinding. Since all manipulated data is randomized, we explore the remaining leakages due to control instruc-tions and memory activities. As previously demonstrated in the literature [20], memory and register addresses leak information related to the secret key. In-stead of using simultaneous measurements as in [18], we combine the cluster classifications of several samples from each bit of the exponent. We thus process the probabilities obtained from this first phase to recover the entire exponent. Our attack requires four phases: trace pre-processing, points of interest identi-fication, fuzzy k-means clustering, and exponent recovery. For this final phase, we present results obtained with three different statistical techniques (majority rule, normal probability density function and Bayesian classifier).
The paper is organized as follows: Section 2 gives details about the ran-domized exponentiation and the device under attack. The unsupervised learning based on clustering algorithms is detailed in Section 3. Section 4 presents the attack in details and the results that we obtained with the three statistical tools mentioned above. Possible countermeasures are suggested in Section 6.
2
The Randomized Exponentiation and the Device
Under Test
The device under attack is a RNS-based implementation of RSA mapped onto a Spartan-3E xc3s1600 FPGA. For demonstration purposes, we considered a very weak 512-bit RSA. The modular exponentiation is computed with the reg-ular and SPA-protected Montgomery ladder [8] using two sets of RNS bases A andB [10]. The atomic square-and-multiply [23] is also a regular and faster ex-ponentiation. However as proposed in [15], randomized exponentiations can be explored through horizontal correlation attacks (HCA) if one of the intermediate operands, in the case the randomized input message, is used in several modular multiplications.
1
Their setting simulates the use of 9 probes uniformly positioned over the chip under attack.
According to the leak resistant arithmetic (LRA) concepts [9], the RNS mod-uli can be randomized before each exponentiation. This countermeasure acts as a message blinding technique because and offers a high degree of randomization to the data. Furthermore, HCA exploits the regularity of long-integer multiplica-tion (or squaring). The parallel RNS arithmetic is then a very limiting factor for this attack. Moreover, our hardware is protected with exponent blinding. Alg. 1 shows the randomized exponentiation.
Algorithm 1: LRA-RNS Montgomery Powering Ladder [9] Data: x inA ∪ B, where A = (a1, a2, ..., ak),B = (b1, b2, ..., bk), A =
∏k i=1ai,
B =∏k
i=1bi, gcd(A, B) = 1, gcd(B, N ) = 1 and d = (dℓ...d2d1)2. Result: z = xdmod N inA ∪ B
1 Pre-Computations:|AB mod N|A∪B
2 randomize(A, B) 3 dr= d + r.ϕ(N ) 4 A0= M M (1, AB mod N, N,A, B) (inA ∪ B) 5 A1= M M (x, AB mod N, N,A, B) (inA ∪ B) 6 for i = ℓ to 1 do 7 A
dri= M M (Adri, Adri, N,B, A) (inA ∪ B)
8 Adri= M M (Adri, Adri, N,B, A) (inA ∪ B)
9 end
10 A0= M M (A0, 1, N,B, A) (inA ∪ B)
The operation M M (x, y, N,B, A) returns xyB−1mod N in the two RNS basesA and B. Both squarings and multiplications are computed with the same number of clock cycles.
First, as the exponent is randomized, single-trace attack was the only option. Further, because the manipulated data is randomized with LRA, the target in-formation of our unsupervised attack is not the data contribution in the EM traces. By data, we mean the intermediate variables which depend on the ran-domly selected RNS bases and the input message. Exponent-dependent decisions are taken by the architecture’s control in order to determine the memory address for reading or writing operands before, during and after the modular multiplica-tions. These conditional tests, as well as the accessed memory addresses, cause subtle leakages of information. These are the only sources of leakages that we exploit in the present unsupervised attack. We present the details of our attack in the next sections.
3
Unsupervised Learning and the Clustering Algorithms
Clustering is one of the most frequently used data mining techniques, which is an unsupervised learning process for partitioning a data set into sub-groups so that the instances within a group are similar to each other and are very dissimilar to the instances of other groups. That is, we shall see what can be done when thecollected samples are unlabelled and must be grouped in homogeneous clusters. Two different clustering methods are used in this work: the k-means and the fuzzy k-means algorithms [28].
The k-means algorithm is a geometric procedure for finding c means or cen-ters (µ1, . . . , µc) considering a set of n samples xj, where 1≤ j ≤ n. The
initial-ization phase consists in defining the number of clusters c and setting a random sample to each mean µi. Thereafter, the algorithm computes the Euclidean
dis-tances EDi,j=∥ xj− µi∥2 for all n samples to obtain the maximum-likelihood
estimation of the means µi. The k-means algorithm is shown in Alg. 2.
Algorithm 2: K-Means Clustering Algorithm
1 begin initialize x, n, c, µ1, . . . , µc
2 do classify n samples xjaccording to nearest µi by computing EDi,j
3 recompute µi
4 until no change in µi
5 return µ1, . . . , µc
6 end
The k-means algorithm iterates until no changes in µi are verified. In all
iterations each sample is assumed to be in exactly one cluster. The fuzzy k-means algorithm relaxes this condition and assumes that each sample xj has
some membership with different clusters ωi, rather than belonging completely
to just one cluster.
Initially, the probabilities of cluster membership for each point xj of a n
sample vector x are normalized according to all clusters ωi as: c
∑
i=1
P (ωi|xj) = 1 (1)
where P (ωi|xj) is the probability that the sample xj is in the cluster ωi. At
each iteration of the fuzzy k-means algorithm, the means (or centers) µi are
recomputed according to the following equation:
µj= ∑n j=1[P (ωi|xj)] bx j ∑n j=1[P (ωi|xj)]b (2) and the new probabilities are recomputed:
P (ωi|xj) =
(1/EDij)1/(b−1)
∑c
r=1(1/EDrj)1/(b−1)
, EDij =∥ xj− µi ∥2 (3)
where b > 1 is a free parameter chosen to adjust the “blending” of different clus-ters. Its appropriate choice can improve the cluster classification if the analyzed data set is too much noisy. In this work, this parameter is set to 2. Alg. 3 shows the fuzzy k-means algorithm.
Algorithm 3: Fuzzy K-Means Clustering Algorithm
1 begin initialize n, c, µ1, . . . , µc, P (ωi|xj)
2 normalize probabilities of cluster memberships by Eq. 1
3 do classify n samples according to nearest µi
4 recompute µiby Eq. 2
5 recompute P (ωi|xj) by Eq. 3
6 until no change in µi and P (ωi|xj)
7 return µ1, . . . , µc
8 end
The next section describes the unsupervised attack in four phases. The means algorithm is used in the search for the points of interest. The fuzzy k-means is employed in the cluster classification after having selected the points of interest.
4
The Unsupervised Attack
In a realistic assumption for single-execution attacks on exponentiations, the adversary works in a noisy environment and, as already stated in [19], "single
bits are never known with certainty [. . . ] and an SPA attacker [. . . ] can only give a probability that any particular operation is a squaring or a multiplication",
if the attacked device executes the square-and-multiply algorithm. If a single-execution attack is able of recovering 98% of the 1024 exponent bits and the adversary does not know the wrong bit positions inside the exponent, a brute force attack requires ∑21j=0C1024
j = 2144 steps to retrieve the incorrect bits.
Therefore, the number of wrong bits in the recovered exponent must be at least very low, otherwise a single-execution attack is impracticable.
When applying non-profiled attacks on a single trace of an exponentiation, the adversary has no knowledge about the operation features (mean µ, variance
σ2). All information must be recovered in a unsupervised manner. Regular
bi-nary algorithms [8][23] compute the exponentiation iteratively and for each bit of the exponent (or segment) same operations are performed. Thus, a initial par-titioning step is applied to the measured electromagnetic exponentiation trace in order to have ℓ segments, each one representing one exponent bit interpre-tation. The segments are aligned and compressed to reduce the noise and clock jitter effects. Thereafter, as proposed in this attack, several points of interest are identified in each segment by computing an estimated and approximated difference of means. The cluster classification using the fuzzy k-means algorithm is applied in each set of compressed samples, each set representing a selected point of interest and providing an estimated exponent. The last step consists in retrieving the randomized exponent using all estimated exponents obtained with the cluster classification. The proposed attack, divided in four phases, is detailed below.
4.1 Phase 1: Trace Pre-processings
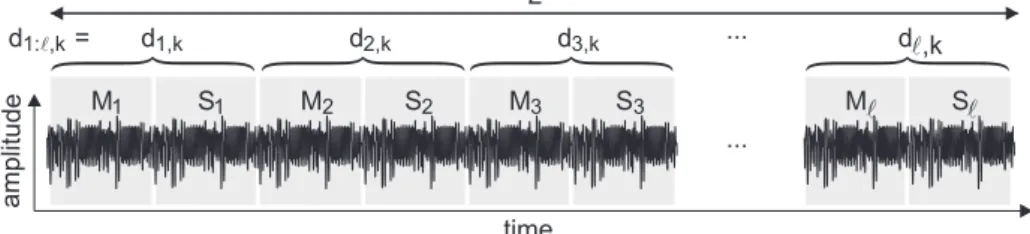
The attack starts by acquiring a single execution exponentiation trace from the device, considering the k-th randomized exponent d1:ℓ,k, where ℓ is the length
of the exponent. In our case, the exponentiation is computed using the regular Montgomery ladder algorithm. The EM trace, with size L, is sliced in ℓ opera-tions of multiplicaopera-tions and ℓ operaopera-tions of squarings, as depicted in Fig. 1.
time a m p litu d e M S M S M S M S ... L l 1 1 2 2 3 3 l d1,k d2,k d3,k ... dl,k d1: ,kl =
Fig. 1. Exponentiation trace and the segmentation in multiplications and squarings.
Each multiplication (Mi) or squaring (Si) in the acquired EM trace contains
74 clock cycles. The oscilloscope sampling rate was set to 20GS/s during the acquisition step and the hardware computes the exponentiation at a clock fre-quency of 50MHz, resulting in 59200 samples per exponent bit interpretation (MiSi). The device under attack does not feature any hardware countermeasure,
e.g., time disarrangement, dummy cycles or frequency dividers. Therefore, the
ℓ segments of multiplication-squarings MiSi, can be easily identified and
com-bined to explore the leakage of information. However, the clock jitter effect is still present in the acquired EM trace and must be suppressed using a trace alignment procedure.
Another important role in unsupervised single-execution attacks is to identify the points of interest which present greater leakages. A simple solution consists in averaging the 400 samples of one clock cycle into 1 sample and taking each averaged sample as a point of interest. Here, in order to preserve the informa-tion over smaller windows, the trace is compressed by averaging 100 samples into 1 sample. Then, this allows reducing the amount of data from 59200 to 592 compressed samples during an exponent bit interpretation di,k (denoted by
operation⟨MS⟩i in the sequel).
Now, the ℓ operations are represented by a matrix T :
T = ⟨MS⟩1 ⟨MS⟩2 .. . ⟨MS⟩ℓ = t1,1t1,2· · · t1,592 t2,1t2,2· · · t2,592 .. . ... . .. ... tℓ,1 tℓ,2· · · tℓ,592 (4)
Each row of the matrix T is a set of compressed samples ⟨MS⟩i = {ti,j}
representing an exponent bit interpretation di,k. The term ℓ is the exponent bit
length and, of course, is the iterations number in the algorithm 1 (steps 6 to 9). After the trace pre-processing, the attack enters in the second phase that consists in finding the points of interest.
4.2 Phase 2: Finding the Points of Interest
The success of the attack depends on the choice of the points of interest. With profiling or supervised attacks, these points can be found by computing a dif-ference of means and observing the highest peaks of amplitude. In such a case, the adversary has a known key d and computes averaged traces Tr0 and Tr1
representing the truncated windows of sampled points when the exponent bit is zero and one, respectively and according to:
Tr0= ∑ i ⟨MS⟩di=0 Tr1= ∑ i ⟨MS⟩di=1 (5)
Because the presented attack aims at revealing the exponent through an un-supervised manner, the attacker should be considered as having minimal knowl-edge about the target implementation to identify the points of interest. Because all data are randomized, the remaining leakage is related to addressing and con-trol executions. Therefore, by observing and studying the collected EM trace, the attacker can, for instance, localize the time points where the device per-forms such operations and discard the points that clearly show no compromising information.
Our unsupervised analysis needs a set of points of interest in each segment
⟨MS⟩i to retrieve the exponent. A basic idea is to initially apply a clustering
algorithm over each set of compressed samples {t1:ℓ,j} (each column of matrix
T ) and find 592 approximated exponents [d1:ℓ,j, for 1≤ j ≤ 592. In our practical
experiments, this leads to the recovery of around 93% of the entire exponent on the most leaking set of compressed samples {t1:ℓ,j}. It is insufficient. However,
this result can be used for calculating approximated and averaged traces dTr0
and dTr1 from the approximated exponent [d1:ℓ,j. For this initial step, we
consid-ered the k-means clustering algorithm because it is a simple and fast technique. Fig. 2(a) shows the relation between the percentage of success recovery of the exponent and the analyzed set of compressed samples{t1:ℓ,j}, for 1 ≤ j ≤ 592.
If the adversary selects the most likely exponent (in the case the set{t1:ℓ,465})
he computes the averaged traces dTr0and dTr1. Fig. 2(b) shows the approximated
difference of mean traces bD = dTr0− dTr1. The difference of means D = Tr0−Tr1,
for the real randomized exponent running in the device, is depicted in Fig. 2(c). Note that the results in Fig. 2(b) and (c) are quite similar and the adversary can select points of interest observing the highest peaks of amplitude in bD. In a
0 10000 20000 30000 40000 50000 -0.02 -0.015 -0.01 -0.005 0 0.005 0.01 0.015 0.02 0.025 0 100 200 300 400 500 50 55 60 65 70 75 80 85 90 95 100 Amplitude(V) Samples Sample Sett %ofCorrectExponentBits (a) D i: ,jl Mi Si 50 150 250 350 450 550 5000 15000 25000 35000 45000 55000 (b) Mi Si 0 10000 20000 30000 40000 50000 -0.02 -0.015 -0.01 -0.005 0 0.005 0.01 0.015 0.02 0.025 Amplitude(V) Samples D 5000 15000 25000 35000 45000 55000 (c Mi Si )
Fig. 2. (a) Percentage of correct exponent bits. (b) Approximated difference of mean tracesD =b Trc0−Trc1 (c) Difference of mean traces D = Tr0− Tr1.
traces, and selecting points of interest, from each one of the 592 possibilities. It is clear that the selection of the most leaking point of interest reduces the computational time of the unsupervised attack. Besides, we observed (see Fig. 2) that the highest percentages of correct exponent recovery match with the highest peaks of amplitude in the approximated difference of means bD. We used
4.3 Phase 3: Cluster Classification
After computing the approximated difference of mean traces from the set of compressed samples{t1:ℓ,465}, let us suppose the selection of u points of interest
P = {pj}, for 1 ≤ j ≤ u, among the 592 possibilities. Observing the
approxi-mated difference of means bD in Fig. 2(b), 17 points of interest were selected (pj
= 165, 166, 169, 281, 282, 284, 285, 342, 461, 462, 464, 465, 497, 498, 577, 580, 581), which evidently are the most leaking points.
A clustering is computed for all set of compressed samples {t1:ℓ,pj}, for
1 ≤ j ≤ u by applying the fuzzy k-means algorithm. Thus, a classification for these samples in two classes (bits zeros and ones), which leads to one estimated exponent \d1:ℓ,pj per set of samples {t1:ℓ,pj}, is obtained. Because real attacks
work on noisy environments, the clustering over each point of interest pj
con-tains errors of classification. Fig. 3 illustrates the cluster classification error for the set of compressed samples{t1:ℓ,169}. Fig. 3(a) shows the correct classification
according to the real randomized exponent d1:ℓ,k and the Fig. 3(b) presents the
cluster classification returned by the fuzzy k-means algorithm.
0 50 100 150 200 250 300 350 400 450 500 -0.020 -0.015 -0.010 -0.005 0 0.005 0 Amplitude(V) Amplitude(V) (a) (b) -0.020 -0.015 -0.010 -0.005 0 0.005 50 100 150 200 250 300 350 400 450 500 bit 1
bit 0 Centers bit 0 bit 1 Centers
Fig. 3. Errors of cluster classification: (a) Correct classification. (b) Fuzzy k-means classification.
For each point of interest pj, the fuzzy k-means clustering algorithm returns
two centers µ1and mu2and two groups of clustered samples. A common problem
would be to identify what class or operation (exponent bit zero or one) each cluster center represents. With u = 17 cluster classifications into two classes, there will be 217= 131072 different possibilities. The identification of the classes
can be performed in two different ways:
1. Instead of selecting random samples to initialize the values µ1and µ2in the
Alg. 3, we select the minimum and maximum samples from the set{t1:ℓ,pj}
according to their amplitudes. The initialization in Alg 3 is done by assigning
µ1= min{t1:ℓ,pj} and µ2 = max{t1:ℓ,pj}. It ensures that µ1 < µ2 after the
clustering. Then, comparing the resulting cluster means µ1 and µ2with the
amplitude of the approximated difference of means bD, and also dTr0and dTr1,
exponent classified exponent bitsdci,k correct \ d1:40,p1 1 0 0 0 0 0 0 1 0 0 0 0 1 0 1 1 1 0 0 1 0 1 1 0 0 0 1 0 0 1 0 0 0 0 0 0 0 0 1 0 76.02% \ d1:40,p2 1 0 0 0 0 0 1 1 0 0 0 0 0 0 1 1 0 1 1 1 1 1 1 0 0 1 0 1 1 0 0 0 1 0 0 0 0 0 1 1 76.42% \ d1:40,p3 1 1 0 0 0 1 0 1 1 0 0 0 1 0 1 1 1 1 1 1 1 1 1 0 0 1 1 1 0 1 0 0 1 1 0 0 0 0 0 1 76.42% \ d1:40,p4 1 0 0 0 0 1 1 1 1 1 0 0 0 1 1 1 0 1 1 1 1 1 1 0 0 1 1 1 0 1 0 0 1 1 1 1 0 0 1 0 76.42% \ d1:40,p5 1 1 0 0 0 0 0 1 0 1 0 1 1 0 0 1 0 1 1 1 1 1 0 0 0 1 1 1 1 1 0 0 1 0 0 1 0 0 0 1 78.86% \ d1:40,p6 1 0 1 1 0 0 0 0 1 0 0 0 1 0 1 1 0 0 0 1 1 0 1 0 1 0 1 1 0 1 0 0 1 0 1 0 0 1 0 1 79.27% \ d1:40,p7 1 0 0 0 0 0 0 1 0 0 0 1 1 0 1 1 0 1 1 1 1 1 1 0 0 1 1 1 0 1 0 0 1 0 0 1 0 0 0 1 78.86% \ d1:40,p8 1 1 0 1 0 0 0 1 0 0 0 0 1 0 1 1 0 1 1 1 0 1 1 0 1 1 1 1 0 1 1 1 1 0 0 0 0 0 0 1 80.08% \ d1:40,p9 1 0 0 0 0 0 1 1 0 1 0 0 1 1 1 1 0 0 1 1 0 1 1 0 1 1 0 1 0 0 0 0 1 0 0 0 1 0 0 0 80.08% \ d1:40,p10 1 0 0 0 0 0 0 1 0 0 0 0 1 0 0 1 0 0 1 1 1 1 1 0 0 1 1 1 0 1 1 0 0 1 0 0 0 1 1 1 80.89% \ d1:40,p11 1 0 1 0 0 0 0 1 1 0 1 0 1 0 1 1 1 1 1 1 1 0 1 0 1 1 1 1 1 1 0 0 1 0 0 0 0 0 0 1 82.52% \ d1:40,p12 1 0 0 0 0 0 0 1 0 0 0 0 1 0 1 0 0 1 0 1 1 1 1 0 0 1 1 1 0 1 1 0 1 1 0 0 0 0 0 1 82.52% \ d1:40,p13 1 0 0 0 0 0 0 0 1 0 0 0 1 1 1 0 0 1 1 1 1 1 1 0 1 1 1 1 1 1 0 0 1 0 0 0 0 1 0 1 83.74% \ d1:40,p14 1 0 0 0 0 1 0 1 0 0 0 0 1 0 1 1 0 1 0 1 1 1 1 1 1 1 1 1 0 0 0 0 1 0 0 0 0 0 0 1 89.43% \ d1:40,p15 1 0 0 0 0 0 0 0 0 0 0 0 1 0 1 1 0 1 1 0 1 1 1 0 1 1 1 1 0 1 0 0 1 0 0 0 0 0 0 1 90.65% \ d1:40,p16 1 0 0 0 0 0 0 1 0 0 0 0 1 0 1 0 0 1 1 1 1 1 1 0 1 1 1 1 0 1 0 1 1 0 0 0 0 0 0 1 91.25% \ d1:40,p17 1 0 0 0 0 0 0 1 0 0 0 0 1 0 1 1 0 0 1 1 1 1 1 0 1 1 1 0 0 1 0 0 1 0 0 0 0 0 0 1 93.06% \ d1:40,k 1 0 0 0 0 0 0 1 0 0 0 0 1 0 1 1 0 1 1 1 1 1 1 0 1 1 1 1 0 1 0 0 1 0 0 0 0 0 0 1 100% d1:40,k 1 0 0 0 0 0 0 1 0 0 0 0 1 0 1 1 0 1 1 1 1 1 1 0 1 1 1 1 0 1 0 0 1 0 0 0 0 0 0 1 100%
Table 1. Cluster classification of the (first 40) exponent bits and the recovery of [d1:ℓ,k
using the majority rule.
2. As all selected leaking points may lead to more than 50% of exponent re-covery, we take one recovered exponent [d1:ℓ,v from one point of interest v,
v ∈ {pj}, and compute the bitwise XOR between this exponent and the
other estimated exponent values. Let ℓ be the size of the exponent, \d1:ℓ,pj
all the recovered exponents for 1 ≤ j ≤ u, pj ̸= v, and the bitwise
re-sults h1:ℓ =XOR( \d1:ℓ,pj, [d1:ℓ,v) for pi ̸= v. If
∑ℓ
i=1hi < ℓ/2 then returns
NOT( \d1:ℓ,pj), otherwise keep unchanged.
After the cluster classifications and respective association of the classes, the attack enters in the last step in order to combine all estimated exponents into one final exponent.
4.4 Phase 4: Exponent Recovery
The recovery of the final randomized exponent is computed through three differ-ent statistical techniques: majority decision, probability density function (pdf) and Bayesian classifier.
Majority Decision: Table 1 shows the cluster classification results for the
first 40 bits of each estimated exponent \d1:ℓ,pj considering the u = 17 points
of interest. Using the majority decision we can retrieve a randomized exponent [
Because the majority rule is a simple statistical procedure, it requires more points of interest for achieving the correct exponent if compared to the next two adopted techniques, as will be demonstrated at the end of this section.
Probability Density Function: In [19], the probability density function,
which is based on the normal distributions parametersN (µ0, σ0) andN (µ1, σ1),
where µ and σ are the mean and the standard deviation, returns the likelihood that a sample ti,j is the operation when the exponent bit di,k = 0. As the
pre-sented analysis is unsupervised, we do not know µ0 and µ1. However, the fuzzy
k-means cluster classification returns two means or centers µ1 and µ2 for each
set of compressed samples{t1:ℓ,pj} which can be used in place of the means. The
standard deviation σ is computed from all the set of samples{t1:ℓ,pj},
consider-ing the evaluated point of interest pi. Then, the likelihood that a sample ti,pj is
an operation when di,k= 0 is given by the equation below:
p(ti,pj, µ1) =
e−12(ti,pj−µ1)2/2σ2
e−12(ti,pj−µ1)2/2σ2+ e−12(ti,pj−µ2)2/2σ2
, 1≤ i ≤ ℓ, 1 ≤ j ≤ u (6)
Following, the defined sum of probabilities gives the likelihood that a set of points of interest{ti,p1:u}, representing the operation ⟨MS⟩i, is an operation
performed when the randomized exponent bit di,k = 0 and is computed by:
S0,1:u= 1 u u ∑ j=1 p(ti,pj, µ1) 1≤ i ≤ ℓ (7)
Then, for 1≤ i ≤ ℓ, the following decision returns the estimated randomized exponent bit ddi,k:
d di,k= { 0, if S0,1:u≥ 0.5) 1, if S0,1:u< 0.5) (8) Table 2 shows the final sum of probabilities S0,1:uand the exponent decision
from Eq. 8 considering the 20 first exponent bits \d1:20,k (for space in Table 2)
and u = 17 points of interest.
Bayesian Classifier: The Bayesian decision theory makes the assumption that
the decision problem is posed in probability terms. The classifier lies on the computation of the posterior probabilities P (µc|ti,pj) which is computed from
the prior probabilities P (µc) and the probability density function for normal
distributions p(ti,pj, µc), where c = {0, 1} and p(ti,pj, µc) ∈ [0, 1]. Thus, the
classification starts by obtaining the pdf estimation for each point of interest
ti,pj of each operation i. Again, this analysis considers the two cluster centers
µ1 and µ2 in the place of means and the standard deviation is computed from
point probabilities p(ti,pj, µ1) correct \ d1:20,p1 0.1 1.0 0.5 0.6 0.7 0.9 0.9 0.4 1.0 0.7 0.6 0.9 0.0 0.8 0.0 0.2 0.3 0.7 0.5 0.1 76.02% \ d1:20,p2 0.3 1.0 0.8 0.6 0.8 0.5 0.4 0.1 0.9 0.7 0.9 0.5 0.7 0.9 0.5 0.2 0.8 0.4 0.1 0.2 76.42% \ d1:20,p3 0.5 0.5 0.5 0.5 0.5 0.5 0.5 0.5 0.5 0.5 0.5 0.5 0.5 0.5 0.5 0.5 0.5 0.5 0.5 0.5 76.83% \ d1:20,p4 0.2 0.9 0.9 0.8 0.6 0.3 0.5 0.2 0.5 0.3 0.7 0.9 0.6 0.2 0.1 0.2 0.8 0.2 0.1 0.1 76.42% \ d1:20,p5 0.5 0.5 0.9 0.9 0.9 0.6 0.8 0.3 0.9 0.1 0.8 0.3 0.2 0.6 0.7 0.1 0.8 0.0 0.3 0.3 78.86% \ d1:20,p6 0.1 0.7 0.5 0.4 0.8 0.7 0.7 0.9 0.5 1.0 0.8 0.6 0.2 0.9 0.5 0.3 0.9 0.6 0.7 0.4 78.86% \ d1:20,p7 0.5 0.8 0.9 0.8 0.9 0.8 0.8 0.0 0.9 0.6 0.9 0.5 0.1 0.6 0.2 0.1 0.9 0.0 0.3 0.1 78.86% \ d1:20,p8 0.3 0.4 0.8 0.5 0.6 0.9 0.7 0.0 0.7 0.5 1.0 0.8 0.2 0.8 0.4 0.1 0.8 0.3 0.0 0.2 80.08% \ d1:20,p9 0.4 0.7 1.0 0.9 0.9 0.5 0.4 0.1 0.8 0.2 1.0 0.8 0.1 0.4 0.3 0.1 0.7 0.7 0.1 0.4 80.08% \ d1:20,p10 0.2 0.9 0.8 0.5 0.7 0.8 1.0 0.4 0.7 1.0 0.8 0.7 0.2 0.5 0.8 0.3 0.6 0.5 0.4 0.1 80.89% \ d1:20,p11 0.1 0.7 0.3 0.9 0.7 0.7 0.7 0.2 0.5 0.9 0.3 0.8 0.1 0.5 0.0 0.2 0.2 0.3 0.0 0.2 82.52% \ d1:20,p12 0.1 0.6 1.0 0.8 0.6 0.9 0.8 0.2 0.8 0.9 0.9 0.8 0.1 0.9 0.3 0.6 0.8 0.2 0.5 0.1 82.52% \ d1:20,p13 0.1 0.8 0.7 1.0 0.7 0.9 0.8 0.7 0.5 0.8 0.9 1.0 0.1 0.2 0.2 0.6 0.6 0.3 0.2 0.3 83.74% \ d1:20,p14 0.3 0.7 0.7 1.0 0.9 0.3 0.8 0.2 0.9 0.7 0.9 0.6 0.2 0.6 0.4 0.1 0.9 0.1 0.6 0.2 89.43% \ d1:20,p15 0.1 0.7 0.7 0.9 0.7 0.7 0.7 0.6 0.7 0.9 0.6 0.9 0.2 0.9 0.2 0.4 0.8 0.4 0.2 0.7 89.43% \ d1:20,p16 0.2 0.8 1.0 0.8 1.0 0.9 0.9 0.3 0.5 0.9 0.7 0.7 0.0 0.8 0.1 0.7 0.8 0.2 0.0 0.2 90.65% \ d1:20,p17 0.3 0.7 0.6 0.6 1.0 0.7 1.0 0.1 0.8 1.0 0.8 0.7 0.3 0.8 0.3 0.1 0.6 0.5 0.3 0.1 93.06% S0,1:17 0.3 0.6 0.6 0.6 0.7 0.6 0.6 0.3 0.7 0.7 0.7 0.6 0.2 0.6 0.3 0.3 0.7 0.3 0.2 0.3 100% \ d1:20,k 1 0 0 0 0 0 0 1 0 0 0 0 1 0 1 1 0 1 1 1 100% d1:20,k 1 0 0 0 0 0 0 1 0 0 0 0 1 0 1 1 0 1 1 1 100%
Table 2. Cluster classification of the (first 20) exponent bits and the recovery of [d1:ℓ,k
using the probability density function for normal distributions.
p(ti,pj, µ1) = 1 σ√2πe −(ti,pj−µ1)2 2σ2 (9) p(ti,pj, µ2) = 1 σ√2πe −(ti,pj−µ2)2 2σ2 (10)
The probability density functions p(ti,pj, µ1) and p(ti,pj, µ2) are obtained for
1 ≤ i ≤ ℓ and 1 ≤ j ≤ u. Considering P (µc) as the prior probabilities for
the points of interest pj−1, where c ={0, 1}, by Bayes’s formula we obtain the
posterior probabilities P (µc|ti,pj) for the operations i and points of interest pj:
P (µ1|ti,pj) = p(ti,pj, µ1)P (µ1) p(ti,pj, µ1)P (µ1) + p(ti,pj, µ2)P (µ2) (11) P (µ2|ti,pj) = p(ti,pj, µ2)P (µ2) p(ti,pj, µ1)P (µ1) + p(ti,pj, µ2)P (µ2) (12) The Bayes’s formula is repeated for all points of interest pj over the same
operation i. At the end, this estimation returns the probabilities that a certain operation⟨MS⟩iis being executed when the exponent bit di,k= 0. Table 3 shows
the evolution of posterior probabilities P (µ1|ti,pj) over all points of interest ti,pj,
for 1≤ j ≤ u, and the respective percentage of correct exponent bits. Again, in this example we consider the first 20 exponent bits.
point probabilities P (µ1|t1:20,pj) correct P (µ1|t1:20,p1) 0.7 0.4 0.6 0.8 0.7 0.8 0.6 0.4 0.8 0.8 0.9 0.8 0.4 0.7 0.4 0.3 0.6 0.2 0.4 0.6 75.23% P (µ1|t1:20,p2) 0.5 1.0 0.8 0.9 0.7 0.9 0.4 0.2 1.0 1.0 0.9 0.8 0.2 0.9 0.0 0.0 0.8 0.2 0.1 0.6 82.89% P (µ1|t1:20,p3) 0.5 1.0 0.8 0.9 0.7 1.0 0.5 0.1 1.0 1.0 0.9 0.8 0.1 0.9 0.0 0.1 0.9 0.3 0.1 0.6 89.02% P (µ1|t1:20,p4) 0.1 1.0 0.9 1.0 0.7 0.9 0.9 0.0 1.0 1.0 1.0 0.8 0.0 1.0 0.0 0.0 1.0 0.1 0.0 0.1 93.45% P (µ1|t1:20,p5) 0.4 1.0 1.0 1.0 0.9 1.0 0.8 0.0 0.9 1.0 1.0 0.6 0.0 1.0 0.0 0.0 1.0 0.0 0.0 0.3 96.34% P (µ1|t1:20,p6) 0.4 1.0 1.0 1.0 0.9 1.0 0.8 0.0 0.9 1.0 1.0 0.6 0.0 1.0 0.0 0.0 1.0 0.0 0.0 0.3 97.56% P (µ1|t1:20,p7) 0.4 1.0 0.9 1.0 1.0 1.0 0.7 0.0 1.0 1.0 1.0 1.0 0.0 1.0 0.0 0.0 1.0 0.0 0.0 0.3 99.59% P (µ1|t1:20,p8) 0.0 1.0 1.0 1.0 1.0 1.0 0.7 0.0 1.0 1.0 1.0 1.0 0.0 1.0 0.0 0.0 1.0 0.0 0.0 0.0 99.59% P (µ1|t1:20,p9) 0.0 1.0 1.0 1.0 1.0 1.0 0.8 0.0 1.0 1.0 1.0 1.0 0.0 1.0 0.0 0.0 1.0 0.0 0.0 0.0 99.59% P (µ1|t1:20,p10) 0.0 1.0 1.0 1.0 1.0 1.0 0.9 0.0 1.0 1.0 1.0 1.0 0.0 1.0 0.0 0.0 1.0 0.0 0.0 0.0 99.18% P (µ1|t1:20,p11) 0.0 1.0 1.0 1.0 1.0 1.0 1.0 0.0 1.0 1.0 1.0 1.0 0.0 1.0 0.0 0.0 1.0 0.0 0.0 0.0 100.00% P (µ1|t1:20,p12) 0.0 1.0 1.0 1.0 1.0 1.0 1.0 0.0 1.0 1.0 1.0 1.0 0.0 1.0 0.0 0.0 1.0 0.0 0.0 0.0 100.00% P (µ1|t1:20,p13) 0.0 1.0 1.0 1.0 1.0 1.0 1.0 0.0 1.0 1.0 1.0 1.0 0.0 1.0 0.0 0.0 1.0 0.0 0.0 0.0 100.00% P (µ1|t1:20,p14) 0.0 1.0 1.0 1.0 1.0 1.0 1.0 0.0 1.0 1.0 1.0 1.0 0.0 1.0 0.0 0.0 1.0 0.0 0.0 0.0 100.00% P (µ1|t1:20,p15) 0.0 1.0 1.0 1.0 1.0 1.0 1.0 0.0 1.0 1.0 1.0 1.0 0.0 1.0 0.0 0.0 1.0 0.0 0.0 0.0 100.00% P (µ1|t1:20,p16) 0.0 1.0 1.0 1.0 1.0 1.0 1.0 0.0 1.0 1.0 1.0 1.0 0.0 1.0 0.0 0.0 1.0 0.0 0.0 0.0 100.00% P (µ1|t1:20,p17) 0.0 1.0 1.0 1.0 1.0 1.0 1.0 0.0 1.0 1.0 1.0 1.0 0.0 1.0 0.0 0.0 1.0 0.0 0.0 0.0 100.00% \ d1:20,k 1 0 0 0 0 0 0 1 0 0 0 0 1 0 1 1 0 1 1 1 100% d1:20,k 1 0 0 0 0 0 0 1 0 0 0 0 1 0 1 1 0 1 1 1 100%
Table 3. Cluster classification of the (first 20) exponent bits and the recovery of [di:ℓ,k
using the Bayesian classifier.
2 4 6 8 10 12 14 16 70 75 80 85 90 95 100 Majority Decision Normal PDF Bayesian Classifier (a) Points of Interest %ofCorrect Exponent Bits 1 2 3 4 5 6 7 8 85 90 95 100 Majority Decision Normal PDF Bayesian Classifier (b) Points of Interest %ofCorrect Exponent Bits 3 5 7 9 11 13 15 17 1
Fig. 4. Relation between the exponent recovery and the number of points of interest: (a) from the least to the most leaking point and (b) from the most to the least leaking point (this Figure is represented in a different scale).
For the three presented methods, we showed the cluster classification results for u = 17 points of interest. Fig. 4 demonstrates the evolution of the exponent recovery related to the number of points. In Fig. 4(a), it was considered the evolution from the least to the most leaking point. Note that using the Bayesian classifier are necessary 11 points to recovery the entire exponent. The same result can be observed in Table 3. On the other hand, in Fig. 4(b), if the evolution is from the most to the least leaking point, the Bayesian classifier achieves 100% of the exponent using only 4 points of interest per exponentiation segment.
5
Obtaining the Private Key from Randomized
Exponents
For decryption and message signing, the retrieval of the randomized exponent
dr= d + r.ϕ(N ) is the same as retrieving d. Therefore, a single-execution attack
is sufficient to break the target device. However, for non-CRT implementations of RSA and in the case when the recovered randomized exponents present few error bits, the adversary can also improve the procedure using a step-by-step attack, as proposed in [19]. In this case, the recovering of several blinding factors r in the exponent randomization is used to derive the exponent d.
Approximately the ℓ/2 most significant bits of the exponent d are exposed when the public key e is small (3, 17 or 216+ 1). In this procedure, the term
ϕ(N ) is approximated by N and the approximated exponent is given by, k∈ Z:
˜
d =
⌊1 + kN
e
⌋
Consequently, the adversary can obtain the ℓ/2 most significant bits of all the possible randomized exponents by computing ˜dri = ˜d + ri.N , for all i and
ri ∈ [0, 232− 1]. Considering λ as being the bit length of the blinding factor r,
the λ most significant bits of d + r.ϕ(N ) are equivalent to the most significant bits of ˜d + r.N . Then, the adversary can compute all possible values for r and
by observing the recovered randomized exponent dr, he can deduce r. Finally,
he constructs the attack on exponentiation traces containing possibly known blinding factors.
6
Countermeasures
The efficiency of single-execution attacks on exponentiations are related to the signal-to-noise ratio (SNR) of acquired traces. Theoretically, the Alg. 1 is SPA-protected because it is regular and all manipulated data are randomized due to algorithmic (exponent blinding) and arithmetic (leak resistant arithmetic) coun-termeasures. If different operands are read and written depending on the expo-nent bits, in a practical implementation of the Montgomery ladder the memory accesses cause addressing related leakages, as demonstrated through the unsu-pervised attack.
Hardware countermeasures as the insertion of time disarrangement, dummy cycles or frequency dividers reduce the SNR. Balancing the power consumption is an alternative to avoid the leakage of information due conditional tests or control decisions.
If the leakage is related to memory access, a possible solution is the ran-domization of the RAM addresses during the exponentiation. By doing so, the unsupervised attack was unable to entirely recover the randomized exponent. By selecting the same points of interest P ={pj}, we applied the fuzzy k-means
clustering algorithm and recovered approximately 80% of the exponent using the Bayesian classifier technique.
7
Conclusions
This paper presented an unsupervised attack on randomized exponentiations. The explored leakages are based on control executions and memory addressing. We proposed to combine the cluster classification for several points of interest over each exponent bit interpretation in order to derive the randomized expo-nent using a single EM trace. The results were presented through three different statistical techniques and specifically for the probability density function and Bayesian Classifier techniques, we showed the likelihood for the randomized ex-ponent bits.
The presented unsupervised attack demonstrated the efficiency of cluster-ing algorithms against scluster-ingle execution of exponentiations even in the presence of algorithmic and arithmetic countermeasures. The obtained results show the importance of employing hardware countermeasures in public-key architectures.
References
1. R. Rivest, A. Shamir, and L. Adleman, “A method for obtaining digital signatures and public key cryptosystems,” Communications of the ACM, vol. 21, no. 2, pp. 120–126, Feb. 1978.
2. P.C. Kocher, “Timing Attacks on Implementations of Diffie-Hellman, RSA, DSS, and Other Systems”, CRYPTO, ser. Lecture Notes in Computer Science, vol. 1109, pp. 104–1113. Springer, 1996.
3. P.C. Kocher, J. Jaffe and B. Jun, “Differential Power Analysis”, CRYPTO, ser. Lecture Notes in Computer Science, vol. 1666, pp. 388–397. Springer, 1999. 4. J.-S. Coron, “Resistance against differential power analysis for elliptic curve
cryptog-raphy,” in Cryptographic Hardware and Embedded Systems, CHES’99, ser. Lecture Notes in Computer Science, vol. 1717, pp. 292–302, Springer, 1999.
5. E. Brier, C. Clavier, and F. Olivier, “Correlation power analysis with a leakage model,” in Cryptographic Hardware and Embedded Systems, CHES’04, ser. Lecture Notes in Computer Science, vol. 3156, pp. 16–29, Springer, 2004.
6. P.-A. Fouque and F. Valette, “The doubling attack - why upwards is better than
downwards,” in Cryptographic Hardware and Embedded Systems, CHES’03, ser.
Lec-ture Notes in Computer Science, vol. 2523, pp. 269–280, Springer, 2003.
7. P. L. Montgomery, “Speeding the Pollard and elliptic curve methods of factoriza-tion”, Mathematics of Computation, 48(177), pp. 243-264, January, 1987.
8. M. Joye and S.-M. Yen, “The Montgomery powering ladder,” in Cryptographic
Hard-ware and Embedded Systems, CHES’02, ser. Lecture Notes in Computer Science, vol.
2523, pp. 291–302, Springer, 2002.
9. J.-C. Bajard, L. Imbert, P.-Y. Liardet, and Y. Teglia, “Leak resistant arithmetic,” in Cryptographic Hardware and Embedded Systems, CHES’04, ser. Lecture Notes in Computer Science, vol. 3156, pp. 62–75, Springer, 2004.
10. J.-C. Bajard, L-Stéphane Didier and P. Kornerup “An RNS Montgomery Modular Multiplication Algorithm,” in IEEE Trans. Computers, vol. 47, n.7, p. 766-776, 1998.
11. S. Chari, J.R. Rao and P. Rohatgi, “Template Attacks”, Cryptographic Hardware
and Embedded Systems, CHES’02, ser. Lecture Notes in Computer Science, vol.
12. C. Herbst and M. Medwed, “Using Templates to Attack Masked Montgomery Ladder Implementations of Modular Exponentiation”, WISA, LCNS 5379, pp. 1-13, 2009.
13. N. Hanley, M. Tunstall and W.P. Marnane, “Using templates to distinguish mul-tiplications from squaring operations”, IJIS, 10, number 4, pp. 255-266, 2011. 14. C. Clavier, B. Feix, G. Gagnerot, M. Roussellet and V. Verneuil, “Horizontal
Cor-relation Analysis on Exponentiation,” Proc. ICICS, ser. Lecture Notes in Computer Science, vol. 6476, pp. 46-61, Springer, 2010.
15. C. Clavier, B. Feix, G. Gagnerot, M. Roussellet, C. Giraud and V. Verneuil, “ROSETTA for Single Trace Analysis”, Proc. INDOCRYPT, ser. Lecture Notes in Computer Science, vol. 7668, pp. 140-155, Springer, 2012.
16. A. Bauer,E. Jaulmes, E. Prouff and J. Wild “Horizontal and Vertical Side-Channel Attacks against Secure RSA Implementations,” Proc. CT-RSA, ser. Lecture Notes in Computer Science, vol. 7779, pp. 1-17, Springer, 2013.
17. A. Bauer and E. Jaulmes “Correlation Analysis against Protected SFM Implemen-tations of RSA,” Proc. INDOCRYPT, ser. Lecture Notes in Computer Science, vol. 8520, pp. 98–115, Springer, 2013.
18. J. Heyszl, A. Ibing, S. Mangard, F. Santis and G. Sigl “Clustering Algorithms for Non-Profiled Single-Execution Attacks on Exponentiations”, IACR Cryptology
ePrint Archive, vol. 2013:438, 2013.
19. S. Bauer, “Attacking Exponent Blinding in RSA without CRT,” COSADE, ser. Lecture Notes in Computer Science, vol. 7275 pp. 82-88, 2012.
20. K. Itoh, T. Izu and M. Takenaka, “Address-Bit Differential Power Analysis of Cryptographic Schemes OK-ECDH and OK-ECDSA”, Cryptographic Hardware and
Embedded Systems, CHES’02, ser. Lecture Notes in Computer Science, vol. 2523.
Springer, 2002, pp. 129–143.
21. C. D. Walter, “Sliding Windows Succumbs to Big Mac Attack”. Cryptographic
Hardware and Embedded Systems, CHES’01, volume 2162 of Lecture Notes in
Com-puter Science, pp. 286–299, Springer, 2001.
22. G. O. Dyrkolbotn and E. Snekkenes, “Modified Template Attack Detecting Ad-dress Bus Signals of Equal Hamming Weight”, The Norwegian Information Security Conference (NISK), pp. 43–56, 2009.
23. B. Chevallier-Mames, M. Ciet and M. Joye, “Low-Cost Solutions for Preventing Simple Side-Channel Analysis: Side-Channel Atomicity”, IEEE Trans. Computers, vol. 51, n.6, pp. 760–768, 2004.
24. N. Guillermin, “A coprocessor for secure and high speed modular arithmetic,” Cryptology ePrint Archive, Report 2011/354, 2011, http://eprint.iacr.org/. 25. G. Perin, L. Imbert, L. Torres and P. Maurine, “Electromagnetic Analysis on RSA
Algorithm Based on RNS”, In Proc. 16th Euromicro Conference on Digital System
Design (DSD), pages 345–352. IEEE, September 2013.
26. J. Lopez and R. Dahab, “Fast multiplication on elliptic curves over GF(2m) without precomputation”. Cryptographic Hardware and Embedded Systems, CHES’99, ser. Lecture Notes in Computer Science, vol 2523, pp. 13-28, Springer-Verlag, London, UK (1999).
27. D. Hankerson, A. J. Menezes and S. Vanstone, “Guide to Elliptic Curve Cryptog-raphy”, Springer Professional Computing, 2004.
28. R.O. Duda, P.E. Hart, D.G. Stork, “Pattern Classification”, (2nd Edition), Wiley-Interscience, 2 edn, Nov 2001.