HAL Id: hal-01825488
https://hal.archives-ouvertes.fr/hal-01825488
Submitted on 31 May 2020
HAL is a multi-disciplinary open access
archive for the deposit and dissemination of
sci-entific research documents, whether they are
pub-lished or not. The documents may come from
teaching and research institutions in France or
abroad, or from public or private research centers.
L’archive ouverte pluridisciplinaire HAL, est
destinée au dépôt et à la diffusion de documents
scientifiques de niveau recherche, publiés ou non,
émanant des établissements d’enseignement et de
recherche français ou étrangers, des laboratoires
publics ou privés.
Correcting for Electrocatalyst Desorption and
Inactivation in Chronoamperometry Experiments
Vincent Fourmond, Thomas Lautier, Carole Baffert, Fanny Leroux, Pierre-Pol
Liebgott, Sebastien Dementin, Marc Rousset, Pascal Arnoux, David Pignol,
Isabelle Meynial Salles, et al.
To cite this version:
Vincent Fourmond, Thomas Lautier, Carole Baffert, Fanny Leroux, Pierre-Pol Liebgott, et al..
Cor-recting for Electrocatalyst Desorption and Inactivation in Chronoamperometry Experiments.
Ana-lytical Chemistry, American Chemical Society, 2009, 81 (8), pp.2962 - 2968. �10.1021/ac8025702�.
�hal-01825488�
Correcting for Electrocatalyst Desorption and
Inactivation in Chronoamperometry Experiments
Vincent Fourmond,†,‡Thomas Lautier,§,|,⊥Carole Baffert,†,‡Fanny Leroux,†,‡Pierre-Pol Liebgott,†,‡Se´ bastien Dementin,†,‡Marc Rousset,†,‡Pascal Arnoux,‡,#,∇
David Pignol,‡,#,∇ Isabelle Meynial-Salles,§,|,⊥Phillippe Soucaille,§,|,⊥Patrick Bertrand,†,‡and
Christophe Le´ ger*,†,‡
Unite´ de Bioe´nerge´tique et Inge´nierie des Prote´ines (BIP), IMM, UPR 9036, CNRS, 31 Chemin Joseph Aiguier, F-13402 Marseille Cedex 20, France, Aix-Marseille Universite´, 3 Place Victor Hugo, F-13333 Marseille Cedex 3, France, Universite´ de Toulouse, INSA, UPS, INP, LISBP, 135 Avenue de Rangueil, F-31077 Toulouse, France, INRA, UMR792 Inge´nierie des Syste`mes Biologiques et des Proce´de´s, F-31400 Toulouse, France, CNRS, UMR5504, F-31400 Toulouse, France, Laboratoire de Bioe´nerge´tique Cellulaire (LBC), SBVME, IBEB, CEA, F-13108 Saint-Paul-lez-Durance, France, and Laboratoire de Biologie Ve´ge´tale et Microbiologie Environnementales (LBVME), UMR 6191, CNRS, F-13108 Saint-Paul-lez-Durance, France
Chronoamperometric experiments with adsorbed elec-trocatalysts are commonly performed either for analytical purposes or for studying the catalytic mechanism of a redox enzyme. In the context of amperometric sensors, the current may be recorded as a function of time while the analyte concentration is being increased to determine a linearity range. In mechanistic studies of redox enzymes, chronoamperometry proved powerful for untangling the effects of electrode potential and time, which are convo-luted in cyclic voltammetric measurements, and for studying the energetics and kinetics of inhibition. In all such experiments, the fact that the catalyst’s coverage and/or activity decreases over time distorts the data. This may hide meaningful features, introduce systematic er-rors, and limit the accuracy of the measurements. We propose a general and surprisingly simple method for correcting for electrocatalyst desorption and inactivation, which greatly increases the precision of chronoampero-metric experiments. Rather than subtracting a baseline, this consists individing the current, either by a synthetic signal that is proportional to the instant electroactive coverage or by the signal recorded in a control experi-ment. In the latter, the change in current may result from film loss only or from film loss plus catalyst inactivation. We describe the different strategies for obtaining the control signal by analyzing various data recorded with adsorbed redox enzymes: nitrate reductase, NiFe hydro-genase, and FeFe hydrogenase. In each case we discuss the trustfulness and the benefit of the correction. This method also applies to experiments where electron
trans-fer is mediated, rather than direct, providing the current is proportional to the time-dependent concentration of catalyst.
Electrochemical experiments with adsorbed electrocatalysts are commonly used in analytical chemistry. Measuring a catalytic current as a function of time while the analyte concentration is being increased is a straightforward strategy for determining the linearity range of sensors and biosensors or the Michaelis constant for the substrate that is being transformed. For the last 15 years, chronoamperometric measurements with adsorbed redox en-zymes have also been used for studying their kinetic properties. This made it possible to learn about many aspects of their mechanism that are otherwise difficult to investigate.1One of the
main advantages of this technique, compared to traditional solution assays with the enzyme in solution, is that, since the activity is measured as a current, it can be sampled at high frequency. This is useful for monitoring rapid changes in activity that result from the enzyme switching between catalytically active and inactive states under certain redox conditions or from the concentration of substrate or inhibitor being varied.1-5
In all cases, although the electrochemical nature of the measurement is ideally suited for quantitative measurements, a major experimental limitation is that the measured current is proportional to the catalyst’s electroactive coverage; the latter may decrease over time, and the resulting change in current introduces systematic errors. This is a recurrent problem: browsing the last four issues of the journal Biosensors & Bioelectronics (volume 24,
* To whom correspondence should be addressed. E-mail: christophe.leger@ ibsm.cnrs-mrs.fr. †BIP (CNRS). ‡ Aix-Marseille Universite´. §Universite´ de Toulouse. | INRA. ⊥CNRS. # LBC (CEA). ∇LBVME (CNRS).
(1) Le´ger, C.; Bertrand, P. Chem. Rev. 2008, 108, 2379–2438, DOI: 10.1021/ cr0680742.
(2) Vincent, K. A.; Parkin, A.; Armstrong, F. A. Chem. Rev. 2007, 107, 4366, DOI: 10.1021/cr050191u.
(3) Le´ger, C.; Dementin, S.; Bertrand, P.; Rousset, M.; Guigliarelli, B. J. Am.
Chem. Soc.2004, 126, 12162, DOI: 10.1021/ja046548d.
(4) Almeida, M. G.; Guigliarelli, B.; Bertrand, P.; Moura, J. J. G.; Moura, I.; Le´ger, C. FEBS Lett. 2007, 581, 284, DOI: 10.1016/j.febslet.2006.12.023.
(5) Leroux, F.; Dementin, S.; Burlat, B.; Cournac, L.; Volbeda, A.; Champ, S.; Martin, L.; Guigliarelli, B.; Bertrand, P.; Fontecilla-Camps, J.; Rousset, M.; Le´ger, C. Proc. Natl. Acad. Sci. U.S.A. 2008, 105, 11188–11193, DOI: 10.1073/pnas.0803689105.
Anal. Chem. 2009, 81, 2962–2968
10.1021/ac8025702 CCC: $40.752009 American Chemical Society
issues 1-4), we found 29 articles showing chronoamperograms, out of which 13 were distorted by the desorption and/or inactiva-tion of the electrocatalyst.6The extent to which this actually limits
the information that is gained varies greatly, but the error introduced by this effect is difficult to evaluate, because it cannot be decreased by statistical means, e.g., by repeating measure-ments and averaging large numbers of results. Regarding redox enzymes noncovalently adsorbed onto electrodes, film stability ranges from tens of hours or more20,21to only minutes in the
worst cases,22,23and the mechanistic information must be gained
while the film is falling off. Chronoamperometry at the rotating disk electrode is often used for determining a Michaelis constant, but desorption precludes any accurate measurement of this parameter.24Most problematically, film loss may also hide small
changes in activity whose detection might otherwise have provided useful information, as illustrated hereinafter.
Here we present a very simple and powerful strategy for dealing with the systematic errors introduced by film loss and for correcting the data in an objective manner. This may not stabilize the biosensor or the film of enzyme, but their charac-terization will be greatly facilitated. This method is applicable if the current is the product of the time-dependent electroactive coverage g(t), whose influence we seek to remove, times the rate of catalysis k(t), which is the signal we are ultimately interested in. Both contributions (coverage and activity) can depend on time, electrode potential, and substrate or inhibitor concentration.
The method we present is based on the possibility to either record independently or synthesize a control signal, i′(t), which is proportional to the time-dependent electroactive coverage during the principal experiment:
Dividing i(t) by the control signal i′(t) yields the signal of interest,
k(t), up to a factor of proportionality 1/R. That this factor is unknown will not preclude the analysis of the dependence of k on time or substrate/inhibitor concentration. Indeed, in voltam-metric experiments with adsorbed catalysts, particularly with enzymes, the electroactive coverage is often unknown, and the information is usually gained from relative changes in current, i.e., from the shape of the electrochemical signal, rather than from its absolute magnitude.
In more complex situations, the change in activity that is of interest is superimposed on a background decrease in current
that is caused by an unavoidable inactivation of the electrocatalyst, in addition to film loss. In that case, g(t) represents the amount of electrocatalyst that has neither desorbed nor inactivated by this process, and the correction eliminates the effects of both desorp-tion and inactivadesorp-tion, as illustrated hereinafter.
In this paper, we use various experimental data to illustrate the distinct strategies that can be used for obtaining the control signal. In each case we demonstrate that the correction greatly enhances the information that is gained from the experiment. We have implemented the corresponding procedures in a free data-analysis software.
RESULTS AND DISCUSSION
No Need to Record a Control Signal When the Change in Current Is a Step Function Distorted by Film Loss. The red
trace in Figure 1B reminds the chronoamperograms reported in many studies of amperometric sensors7-19or enzymes (see, e.g.,
Figure 5 in ref 23 or Figure 2A in ref 25). This signal was obtained with Rhodobacter sphaeroides NapAB, a dimeric enzyme that catalyzes the two-electron reduction of nitrate to nitrite.26The
enzyme was adsorbed on a graphite electrode,27-29which was
rotated at high speed to avoid any limitation by mass transport and poised at low potential. The negative current, which is proportional to the rate of catalytic nitrate reduction, was moni-tored while nitrate concentration was increased by repeatedly injecting aliquots of a concentrated stock solution of NO3-in the
electrochemical cell (Figure 1A). The turnover rate is constant between any two successive injections because catalysis is in the steady state; therefore, the decrease in the magnitude of the current that is observed on certain intervals (Figure 2A) is a
(6) See Figures 5A, 3, 3A, 5B, 5A, 4, 5A, 3A, 3, 5A, 3B, 5, and 4 in refs 7-19, respectively.
(7) Guascito, M.; Filippo, E.; Malitesta, C.; Manno, D.; Serra, A.; Turco, A.
Biosens. Bioelectron.2008, 24, 1063–1069, DOI: 10.1016/j.bios.2008.07.048.
(8) Ai, H.; Huang, X.; Zhu, Z.; Liu, J.; Chi, Q.; Li, Y.; Li, Z.; Ji, X. Biosens.
Bioelectron.2008, 24, 1054–1058, DOI: 10.1016/j.bios.2008.07.039.
(9) Deng, L.; Wang, Y.; Shang, L.; Wen, D.; Wang, F.; Dong, S. Biosens.
Bioelectron.2008, 24, 957–963, DOI: 10.1016/j.bios.2008.07.066.
(10) Guo, C.; Hu, F.; Li, C.; Shen, P. Biosens. Bioelectron. 2008, 24, 825–830, DOI: 10.1016/j.bios.2008.07.007.
(11) Salimi, A.; Noorbakhash, A.; Sharifi, E.; Semnani, A. Biosens. Bioelectron.
2008, 24, 798–804, DOI: 10.1016/j.bios.2008.06.046.
(12) Wu, L.; Lei, J.; Zhang, X.; Ju, H. Biosens. Bioelectron. 2008, 24, 644–649, DOI: 10.1016/j.bios.2008.06.009.
(13) Kafi, A.; Wu, G.; Chen, A. Biosens. Bioelectron. 2008, 24, 566–571, DOI: 10.1016/j.bios.2008.06.004.
(14) Vazdominguez, C.; Campuzano, S.; Rudiger, O.; Pita, M.; Gorbacheva, M.; Shleev, S.; Fernandez, V.; Delacey, A. Biosens. Bioelectron. 2008, 24, 531– 537, DOI: 10.1016/j.bios.2008.05.002.
(15) Ozcan, L.; Sahin, Y.; Turk, H. Biosens. Bioelectron. 2008, 24, 512–517, DOI: 10.1016/j.bios.2008.05.004.
(16) Zhou, M. Biosens. Bioelectron. 2008, 24, 442–447, DOI: 10.1016/ j.bios.2008.04.025.
(17) Du, F. Biosens. Bioelectron. 2008, 24, 415–421, DOI: 10.1016/ j.bios.2008.04.020.
(18) Cao, Z.; Jiang, X.; Xie, Q.; Yao, S. Biosens. Bioelectron. 2008, 24, 222–227, DOI: 10.1016/j.bios.2008.03.021.
(19) Dondapati, S.; Lozanosanchez, P.; Katakis, I. Biosens. Bioelectron. 2008,
24, 55–59, DOI: 10.1016/j.bios.2008.03.022.
(20) Blanford, C. F.; Heath, R. S.; Armstrong, F. A. Chem. Commun. 2007, 1710, DOI: 10.1039/b703114a.
(21) Blanford, C. F.; Foster, C. E.; Heath, R. S.; Armstrong, F. A. Faraday Discuss.
2009, 140, 319–335, DOI: 10.1039/b808939f.
(22) Heffron, K.; Le´ger, C.; Rothery, R. A.; Weiner, J. H.; Armstrong, F. A.
Biochemistry2001, 40, 3117, DOI: 10.1021/bi002452u.
(23) Barker, C. D.; Reda, T.; Hirst, J. Biochemistry 2007, 46, 3454, DOI: 10.1021/ bi061988y.
(24) Film loss while the substrate concentration is being increased leads to underestimating the current at high substrate concentration and, therefore, the value of Km; see the discussion in section 3.1.4 of ref 1.
(25) Wijma, H. J.; Jeuken, L. J. C.; Verbeet, M. P.; Armstrong, F. A.; Canters, G. W. J. Biol. Chem. 2006, 281, 16 340-16 346, DOI: 10.1074/ jbc.M601610200.
(26) Arnoux, P.; Sabaty, M.; Alric, J.; Frangioni, B.; Guigliarelli, B.; Adriano, J. M.; Pignol, D. Nat. Struct. Mol. Biol. 2003, 10, 928, DOI: 10.1038/nsb994.
(27) Frangioni, B.; Arnoux, P.; Sabaty, M.; Pignol, D.; Bertrand, P.; Guigliarelli, B.; Le´ger, C. J. Am. Chem. Soc. 2004, 126, 1328, DOI: 10.1021/ja0384072.
(28) Bertrand, P.; Frangioni, B.; Dementin, S.; Sabaty, M.; Arnoux, P.; Guigliarelli, B.; Pignol, D.; Le´ger, C. J. Phys. Chem. B 2007, 111, 10300, DOI: 10.1021/ jp074340j.
(29) Fourmond, V.; Burlat, B.; Dementin, S.; Arnoux, P.; Sabaty, M.; Boiry, S.; Guigliarelli, B.; Bertrand, P.; Pignol, D.; Le´ger, C. J. Phys. Chem. B 2008,
112, 15478, DOI: 10.1021/jp807092y.
i(t) ) g(t)k(t) (principal signal) (1)
i'(t) ) R g(t) (control signal) (2)
2963
consequence of film desorption. The data in Figure 1 show that the film is all the less stable that substrate concentration is large. Film loss makes it difficult to estimate the value of Km: fitting
to the Michaelis-Menten equation the uncorrected data obtained by taking current values at the beginning of each interval returns a Kmof about 60 µM, but the Eadie-Hofstee
plot in the inset strongly deviates from linearity. Clearly, the decrease in current at high concentration is artifactual and leads to underestimating both the maximal current (at infinite concentration of nitrate) and the Michaelis constant.
We will show that, in this situation, it is possible to directly infer the time dependence of the electroactive coverage from the
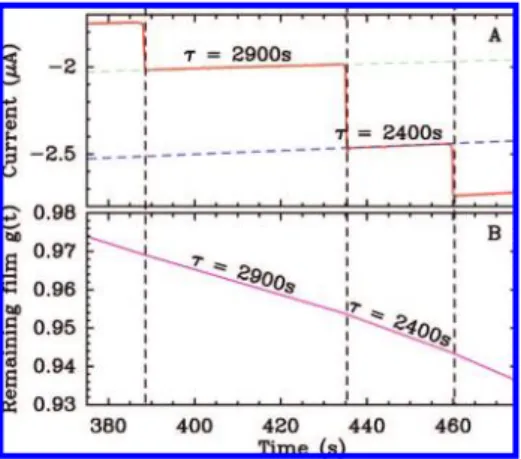
measured current. Film loss should lead to an exponential decay of the current, and the observation that it decreases linearly with time (Figure 2A) shows that the time constant of the decay is much greater than the interval between two injections. Therefore, it is possible to independently fit each segment to a line of equation
y ) at + bwhich approximates the exponential decay whose time constant is τ ) -(at0+ b)/a, where t0is the abscissa of the
first point in the interval, and we build g(t) piece by piece by using the value of τ deduced from the fit of each segment of the principal signal. We construct the normalized electroactive coverage g(t) according to the following rules: (i) g(t0+) ) g(t0-),
that is, there is no instant loss of electroactive coverage upon addition of substrate. (ii) g(t) ) g(t0+)(at + b)/(at0+ b) during
the interval (Figure 2B). Figure 1C shows the entire function
g(t) calculated using the initial value g(0) ) 1. Dividing the original signal i(t) by the reconstituted control signal yields the green step function in Figure 1B, where film desorption is no longer apparent. The Eadie-Hofstee plot shows that the corrected data do not deviate from the expected Michaelian behavior. The slope of this Eadie-Hofstee plot is Km) 97±3 µM.31Independent runs gave
the same value within 5 µM.
This procedure can be applied whenever the function k(t), i.e., the activity of the enzyme or the response of the sensor, is a step function. It may be used for precisely determining either Michaelis or inhibition constants, in experiments where the substrate or inhibitor concentration is stepwise increased. It should increase the accuracy of amperometric sensors. We have implemented the above correction procedure in a software we freely distribute; with the use of this program, constructing the g(t) function and correcting the data according to the above method is only a matter of minutes (see the Methods section).
Control Experiment Carried Out with the Same Film When the Catalyst Is Irreversibly Transformed by the Reac-tion of Interest. When k(t) is not a step funcReac-tion, the principal
signal must be divided by a control signal in which the decrease in current reveals only the effects that should be corrected for, e.g., film loss. If the process whose kinetics one seeks to define occurs spontaneously, but only once per film, the control signal can be obtained from a subsequent experiment carried out with the same film. We used this strategy in our recent study of the irreversible activation of R. sphaeroides nitrate reductase, taking advantage of the fact that this activation proceeds only the first time the enzyme is reduced.29
R. sphaeroides nitrate reductase, the enzyme used in the experiment described in Figure 1, can be purified as either a dimer (NapAB) or a monomer (NapA).26The films of the dimeric form
are much more stable than those of the monomer. This is most likely because NapB is the proteic subunit that helps NapAB interact with the electrode. The enzyme undergoes an irreversible first-order activation the first time it is taken to low potentials (E<-250 mV vs SHE).29In the case of NapAB, this is clearly
seen as an increase over time of the nitrate reduction current (see ref 29 and Supporting Information Figure S1), but the analysis of the activation process of NapA is difficult because, in addition to electroactive coverage being smaller, film loss tends to make the current decrease faster than the enzyme activates. This is
(30) Cornish-Bowden, A. Fundamental of Enzyme Kinetics; Portland Press: London, 2004.
(31) This error is the 95% confidence interval calculated from the covariance matrix. For details, see, e.g., section 4.B in the manual of the software ODRPACK at http://www.netlib.org/odrpack/.
Figure 1. (A) Nitrate concentration against time. (B) Raw and corrected chronoamperograms (red and green lines) for R.
sphaeroi-des nitrate reductase (NapAB) adsorbed at a rotating electrode. The
current is proportional to the rate of nitrate reduction. Each increase in current results from nitrate being added; pH 7, T ) 25°C, ω ) 5 krpm, E ) -510 mV vs SHE. The inset shows the Eadie-Hofstee plots of rate against rate divided by substrate concentration. Such plot is linear if the data follow Michaelis-Menten kinetics (ref 30). (C) Normalized electroactive coverage reconstituted piece by piece from the data in panel B and used as a synthetic control signal for correcting the raw chronoamperogram.
Figure 2. Synthesis of the control signal shown in Figure 1C. Panel A is a close-up on the raw data in Figure 1B, illustrating the piece by piece construction of the control signal shown in Figure 1C. τ is the time constant of film loss on each interval.
illustrated by the red chronoamperogram in Figure 3: panel A shows the sequence of electrode potential steps which was applied to a fresh film on NapA. Panel B shows that the nitrate reduction current evolves in a complex manner, but clearly, at a given potential, the magnitude of the current continuously decreases over time. (The sharp variations of current result from double layer effects when the potential is stepped.) The control signal recorded with the same film, under the same conditions but after the enzyme has fully activated, is shown as a blue trace in panel B. The ratio of the two is shown in green in Figure 3C.
The corrected signal in Figure 3C is the change in activity induced by the first reduction of the enzyme. The fit of the activation phase to y(t) ) y0(1 - β exp(-kat)) is perfect (dashed
purple line); this demonstrates that the activation simply follows first-order kinetics and that the correction was successful. The fit returns the first-order rate of activation (ka) and the relative
amplitude of the activation (β). In ref 29, we show that the latter equates the fraction of enzyme that was initially inactive. We deduced ka) 31×10-3s-1and β ) 0.6 from the data in Figure
3, which is consistent with our previous results.29Ten independent
experiments returned values of β in the range of 0.6-0.7, and the dispersion of the values of kawas±10%.
We conclude that the corrected data clearly show that NapA activates under reducing conditions, and the kinetics of this process is easily characterized, despite the fact that the film is very unstable and activation is hidden by film loss in the raw signal. That the same activation process is observed with both NapA and NapAB clearly demonstrates that it results from a chemical transformation of the subunit NapA.29
Control Experiment Carried Out with a Fresh Film When the Reaction of Interest Is Triggered by the User. The use of
two different films for the principal and the control experiments
should prove useful if (i) the process of interest is triggered by the user during the principal experiment and (ii) the background decrease in current is not an exponential decay toward zero (if it is, there is no need to use a different film). Both conditions are fulfilled, for example, in experiments with hydrogenases adsorbed onto electrodes poised at very high potential, under conditions commonly used for studying the oxygen sensitivity of these enzymes.1,2
To characterize the kinetics of inhibition of hydrogenases by O2using direct electrochemistry, a method consists in injecting
in the electrochemical cell an aliquot of aerated solution while the potential of the enzyme-coated electrode is poised at a high value and the H2-oxidation activity is continuously
monitor-ed.3-5,32Oxygen concentration increases within a fraction of a
second after the injection, and then slowly returns to zero because hydrogen is flowed through the buffer. The whole process takes a few minutes, during which the activity is continuously measured, and the data can be analyzed without having to independently measure the time-dependent concentration of O2 (see section
2.4.2 in ref 1). Such experiments easily yield inhibition constants;3,33most importantly, any delay in inhibitor binding and
release can be interpreted to determine the rates of inhibition.4,5,32
This method can be used with any gaseous inhibitor, but when it is molecular oxygen, the electrode potential must be high enough that it is not directly reduced onto the electrode, else this would add a faradaic contribution to the current and decrease the effective oxygen concentration in the vicinity of the electrode. However, under such very oxidizing conditions, hydrogenases slowly inactivate even before oxygen is added, because the active site is slowly oxidized into one of its inactive forms (the so-called NiB and Hinactox states of NiFe and FeFe hydrogenases,
respec-tively).34 Anaerobic inactivation and film loss combine to
produce a decrease in hydrogen oxidation current that appears to be at least biphasic,35,36although the reason for this has not
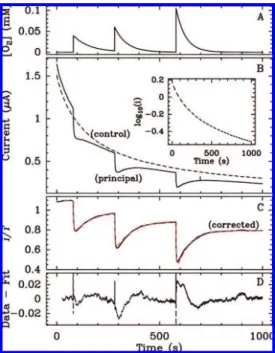
been clarified yet. The dashed line in Figure 4B shows such current decay recorded with Clostridium acetobutylicum FeFe hydrogenase adsorbed at a rotating disk graphite electrode.32The
semilog plot in the inset clearly shows the deviation from first-order kinetics. The effect of adding oxygen in the buffer super-imposes on this complex decay to produce the signal shown as a plain line in Figure 4B, where the three abrupt variations in current result from injections of aliquots of solution equilibrated under 1 atm of oxygen, as depicted in panel A. In analyzing these data, our goal is to precisely measure the rates of inhibition and reactivation of the enzyme. Unlike in the experiment described in Figure 1, the only reason we repeat the injections in Figure 4 is to increase the statistics of the measurement.
In a recent paper about C. acetobutylicum FeFe hydrogenase, we showed that transients like those in Figure 4B could be fitted
(32) Baffert, C.; Demuez, M.; Cournac, L.; Burlat, B.; Guigliarelli, B.; Soucaille, P.; Bertrand, P.; Girbal, L.; Le´ger, C. Angew. Chem., Int. Ed. 2008, 47, 2052–2054, DOI: 10.1002/anie.200704313.
(33) Ludwig, M.; Cracknell, J. A.; Vincent, K. A.; Armstrong, F. A.; Lenz, O.
J. Biol. Chem.2009, 284, 465–477, DOI: 10.1074/jbc.M803676200.
(34) de Lacey, A. L.; Fernandez, V. M.; Rousset, M.; Cammack, R. Chem. Rev.
2007, 107, 4304, DOI: 10.1021/cr0501947.
(35) Jones, A. K.; Lamle, S. E.; Pershad, H. R.; Vincent, K. A.; Albracht, S. P. J.; Armstrong, F. A. J. Am. Chem. Soc. 2003, 125, 8505, DOI: 10.1021/ ja035296y.
(36) Parkin, A.; Cavazza, C.; Fontecilla-Camps, J.; Armstrong, F. J. Am. Chem.
Soc.2006, 128, 16808, DOI: 10.1021/ja064425i.
Figure 3. Chronoamperograms demonstrating the irreversible re-ductive activation of nitrate reductase. Panel A shows the sequence of potential steps at +240, -160, and -460 mV, which was applied to a fresh film of as-prepared R. sphaeroides NapA. Panel B shows the principal experiment and the subsequent control experiment (red and blue traces, respectively). (C) Corrected data (green) and their fit to y(t) ) y0(1 - β exp(-kat)) (dashed magenta). Panel D shows the difference between the corrected data and the fit; pH 7,
T ) 25°C, ω ) 5 krpm, [NO3
-] ) 100 µM.
2965
by using the model depicted in Scheme 1A, which assumes that the enzyme inactivates in two concurrent processes: the anaerobic formation of the Hinactox state, with a first-order rate constant k1,
and the two-step formation of an oxygen-damaged species (oxygen binds with a bimolecular rate constant k2to form an
adduct which either dissociates with first-order rate constant
k-2or irreversibly inactivates with rate k3). The values of k1
that were obtained by fitting the successive transients showed a twofold variability, as observed in the right panel of Figure 5 in ref 32. This results from the fact that when Scheme 1A is used to fit the principal signal, the value of k1 incorporates
processes (film loss and anaerobic inactivation) that are approximated by a first-order reaction, whereas the inset in Figure 4B clearly shows that this approximation is wrong.
However, analyzing corrected data will prove more satisfactory. The corrected signal in Figure 4C (plain line), which results from dividing the principal signal in panel B by the control obtained under anaerobic conditions, is shown as a dashed line. The downward trend has disappeared, showing that the division has suppressed the effects of both film loss and anaerobic inactivation. That the corrected current reaches well-defined plateaus after each injection of oxygen demonstrates that the correction is trustful. The corrected signal is easily interpreted in terms of the simplified model depicted in Scheme 1B: the enzyme inactivates transiently when oxygen is injected, and the activity is mostly recovered after O2has been flushed away; the fraction of activity that is not
recovered corresponds to the enzyme that has irreversibly reacted with O2 (rate constant k3). We no longer include
anaerobic inactivation, which was represented by k1in Scheme
1A; therefore, the data are fitted by adjusting one fewer param-eters. The dashed line in panel B was calculated by adjusting a
uniqueset of rate constants: k2 ) 3.1 s-1/atm(O2), k-2) 0.26
s-1, k
3) 3.6× 10⁻³s-1. The values obtained in ref 32 were
similar, but the present analysis is more reliable because we no longer face the confusing observation that the apparent value of k1depends on time. Hence, this method provides a simpler
and more accurate strategy than that used in ref 32 for quantitatively examining the reaction of the enzyme with oxygen. The correction is also greatly beneficial for interpreting the data in a qualitative manner: unlike the raw data, the corrected signal in panel B is a very clear footprint of how transient exposure to oxygen affects catalytic activity.
The above correction is particularly simple and efficient because the background decay in current that results from film loss and inactivation is very reproducible.
Synthetic Control Signal Interpolated or Extrapolated from Certain Parts of the Principal Signal. Last, we illustrate
situations in which a control signal must be synthesized when the strategy consisting in dividing the principal experiment by a chronoamperogram obtained with a different film of enzyme fails. For this, we consider the same experiment as above, but carried out with mutants of the NiFe hydrogenase from Desulfovibrio
fructosovorans5,37(solid lines in Figure 5A). Initially, we observed
that proceeding as for FeFe hydrogenase returned “corrected” signals that did not show the expected plateaus, not even during the period preceding the injection of oxygen (see Supporting Information Figure S2). We concluded that the background decay in current was not reproducible enough that independent experi-ments could be used as controls.
If the effect of O2were reversible on the time scale of the
experiment, a control signal could be calculated by fitting a spline function to the current measured under anaerobic
(37) Dementin, S.; Leroux, F.; Cournac, L.; de Lacey, A. L.; Volbeda, A.; Léger, C.; Burlat, B.; Martinez, N.; Champ, S.; Martin, L.; Sanganas, O.; Haumann, M.; Fernández, V. M.; Guigliarelli, B.; Fontecilla-Camps, J. C.; Rousset, M. Submitted to J. Am. Chem. Soc.
Figure 4. (A) Plot of O2concentration against time, calculated using the volume of oxygenated buffer injected in the cell and the time constant of the decay deduced from fitting the data in panel B. (B) The black line shows how C. acetobutylicum FeFe hydrogenase is inhibited by successively injecting three aliquots of a buffer equili-brated under 1 atm of O2 (ref 32). Oxygen is flushed away by the stream of H2and vanishes with a time constant of about 1 min. The volumes of the aliquots divided by the total volume of buffer in the cell were x ) 0.032, 0.046, and 0.085; pH 7, 25°C, ω ) 2 krpm, E ) +190 mV, 1 atm of H2. The dashed line shows the control signal recorded in an experiment carried out with a fresh film of enzyme handled in the same manner, except that no oxygen was added. (C) The plain line is the corrected signal obtained by dividing the principal signal in panel B by the control signal. This removes the effect of both film loss and anaerobic inactivation. The dashed line shows the fit of these data to the current equation given by Scheme 1B. Panel D shows the difference between the corrected data and the fit.
Scheme 1. Schemes Used for Modelling the Inhibition of C. acetobutylicum FeFe
conditions (that is, before the injection of oxygen and after oxygen has vanished), and the data could be divided by this
interpolatedpolynomial function. This is the strategy we used to correct for film loss the chronoamperograms for CO inhibition of nitrite reductase (see supplementary Figure S4 in ref 4) and NiFe hydrogenase,5 but it cannot be applied to
the data in Figure 5A, since in this case oxygen inhibition is mostly irreversible.
To design a strategy for correcting the data in Figure 5A, we characterized a number of signals recorded while NiFe hydroge-nase was inactivating at high electrode potential in the absence of oxygen, and we found that the chronoamperograms could always be fitted to y(t) ) a exp(-t/τ) + b. Moreover, analyzing several chronoamperograms recorded with the same film of enzyme, the value of τ was reproducible (within 15%) and of the order of the characteristic time of the experiment (about 1000 s), see Supporting Information Figure S3. This allowed us to calculate the synthetic control signals shown as dashed lines in Figure 5A in the following manner: (i) we recorded chronoamperograms showing the inactivation of the enzyme in the absence of oxygen and we fitted them to determine the average time constant τav;
(ii) we fitted the quasi-linear phase of the principal signal (0<
t<100 s in Figure 5A) to y(t) ) a exp(-t/τav) + b; (iii) we used
this function to extrapolate the control signal over the entire time frame of the experiment. (Supporting Information Figure S3 illustrates the complete series of anaerobic and aerobic experiments carried out to record these signals.)
Importantly, the above method is unbiased: it makes no assumption about whether or not the inhibition is reversible since the current recorded after exposure to O2is not used to calculate
the control signal.
Generally speaking, the simpler strategy which would have consisted in fitting the initial, anaerobic part of the data to y(t) )
aexp (-t/τ) + b by adjusting three parameters (rather than two above) is unlikely to predict a correct control function. Indeed, if the time constant of the decay is of the order of, or larger than, the time scale of the experiment, it cannot be deduced from the anaerobic, linear region of the data, and the three parameters are ill-defined. Alternatively, if τ is small and b/a is small, that is, the current rapidly decays to zero, the extrapolated function and the corrected data will be very sensitive to the value of τ. Last, if
τ is small and b/a is not small, it would make more sense to wait
until the initial decay phase is over before proceeding with oxygen injections, and to use uncorrected data.
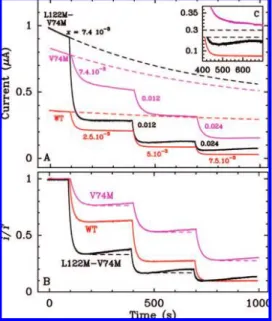
Figure 5A shows the chronoamperograms recorded with wild-type (WT) NiFe hydrogenase (in red), and the L122M-V74M and V74M mutants5,37(black and magenta, respectively). For the WT
and V74M mutants, the activity continuously decreases as a consequence of film loss and both anaerobic and aerobic inactiva-tion; the latter slows each time oxygen is flushed away by the stream of H2. The L122M-V74M mutant behaves differently:
there is a small amplitude reactivation after oxygen has been removed from the cell (see the inset). This partial recovery of activity is significant because under the very oxidizing condi-tions used in this experiments, one expects nothing but the inactivation of the enzyme. We wondered whether this reactiva-tion process also takes place in the V74M and WT enzymes, but at a slower rate, so that it is overcome by film loss and anaerobic inactivation. The corrected data shown in panel B provide the answer: a small but meaningful reactivation phase is apparent for the V74M enzyme once the data have been corrected for film loss and anaerobic inactivation, whereas the corrected current given by the WT enzyme reaches well-defined plateaus before and after each injection of oxygen.
We conclude that in the V74M mutant, but not in the WT, the reactivation observed for the L122M-V74M mutant can occur and yet be undetected because it is slow and it can easily be blurred by film loss and anaerobic inactivation. The spectacular observa-tion here is that correcting the data uncovers an intriguing feature that is hidden in the raw signal.
CONCLUSION
In many different fields, and indeed in spectrometry, chroma-tography, and electrochemistry alike, correcting data usually involves subtracting a background signal. This is so because the different elements which contribute to a particular result are generally additive. For example, in electrochemistry, the capacitive current always adds to the faradaic signal, and the currents that arise from independent reactions can be deconvolved because they are cumulative also.
In contrast, we have shown in this paper that in various situations the contributions to a chronoamperogram are multipli-cative, and correcting the data to take away the influence of a certain contribution must involve a division rather than a subtrac-tion. That only the latter operation is available in commercial electrochemistry softwares suggests that this conclusion had not been grasped before.
We exposed a method that makes it possible to “remove” from a chronoamperogram the influence of processes that cannot be eliminated from an experiment defined as the control experiment.
Figure 5. (A) Chronoamperograms showing the effect of oxygen on the activity of D. fructosovorans NiFe hydrogenase. The red signal was obtained with the wild type, the black with the L122M-V74M mutant, and the magenta with the V74M mutant; pH 7, 40°C, ω ) 2 krpm, E ) +190 mV, 1 atm of H2. The parameter x denotes the volumic fractions of buffer equilibrated in air and injected in the cell solution. The dashed lines show the synthetic control signals constructed as explained in the text. Panel B shows the corrected data. The dashed lines are horizontal guidelines.
2967
The delicate point of the method is to obtain a reliable control signal. We have shown that it can be synthesized in the most common situation in which the variation of turnover rate consists of discrete steps due to the stepwise addition of substrate or inhibitors. When the time dependence of the catalytic rate is more complex, a control signal must be recorded, which is such that the variation of electroactive coverage is the same as (or very close to that) in the principal experiment. This requires that the process whose kinetics one seeks to define does not interfere significantly with the background decrease in current. Different strategies can be used for obtaining the control signal. It may be possible to record it with a different film handled as in the principal experiment or from a subsequent experiment carried out with the same film. Alternatively, one may use a spline function to inter-polate the control signal,4or model film loss or inactivation by
fitting several control experiments to an ad hoc function, and use the result as a control signal.
METHODS
The data were analyzed using an inhouse program called SOAS, which is available free (under GNU General Public License)38 and free of charge on our Web site.39 Mac OS X
binaries can also be downloaded, thanks to Dr. Kevin Hoke (Department of Chemistry, Berry College, Mount Berry, GA). This program proposes commands for handling voltammetric and chronoamperometric data, including smoothing signals, differen-tiation, subtracting baselines, fitting current responses, measuring limiting currents, and searching for peak positions. Dividing two data sets is obtained with the “div” command. Dividing a signal by an ad hoc (user-defined) baseline is obtained with the “v” key while the baseline is being adjusted (a number of options are available for defining baselines). Analyzing chronoamperograms according to the procedure described in Figures 1 and 2 is simplified by the film_decay command, as described in the online manual,40under the heading “baseline corrections.”
The samples of R. sphaeroides nitrate reductase26,41and D.
fructosovorans NiFe hydrogenase mutants were prepared as described previously.5,42,43 Homologous expression of C.
aceto-butylicumFeFe hydrogenase HydA1 in the form of a C-terminal Strep-tag-II-tagged protein was performed using C. acetobutylicum (pPHhydACa-C-tag) strain using the procedure of Girbal et al.44
modified by Demuez et al.45To improve purification yield and
purified hydrogenase concentration, the protocol was further modified as follows. To limit oxygen exposure, the entire purifica-tion is performed in an anaerobic glovebox (JACOMEX); this includes cells recovery, centrifugation, and proteins extraction. To speed up the purification, the one-step affinity chromatography is done with a 5 mL Strep-Tactin Superflow (IBA, Go¨ttingen, Germany) column connected to an A¨kta purifier 10 system located in the anaerobic glovebox.
The electrochemical cell, thermostatted using a water circula-tion, was housed in a Faraday cage. A pyrolytic graphite edge rotating disk working electrode (area ≈ 5 mm2) was used in
conjunction with an EG&G M636 electrode rotator, a platinum wire was used as a counter electrode, and a saturated calomel electrode (SCE), located in a Luggin side arm containing 0.1 M NaCl and maintained at room temperature, was used as a reference. All potentials are quoted versus the standard hydrogen electrode (SHE), using ESHE ) ESCE + 241 mV.
Experiments were performed with an Autolab electrochemical analyzer (PGSTAT 12, Eco Chemie) and carried out in an anaerobic glovebox (JACOMEX) filled with N2 (residual O2 <1 ppm). The methods we use to form the enzyme films were described previously.29,32,43The buffer contained 5 mM each of
MES, sodium acetate, HEPES, TAPS, and CHES, 0.1 mM EDTA, and 0.1 M NaCl.
ACKNOWLEDGMENT
Our work is funded by the CNRS, CEA, INRA, INSA, ANR, Aix-Marseille Universite´, and the city of Marseilles. We acknowl-edge support from the “poˆle de compe´titivite´s CAPENERGIES”.
SUPPORTING INFORMATION AVAILABLE
Supplementary Figures S1-S3. This material is available free of charge via the Internet at http://pubs.acs.org.
Received for review December 5, 2008. Accepted February 18, 2009.
AC8025702
(38) GNU General Public License, version 2.0 GNU Project-Free Software Foundation (FSF), http://www.gnu.org/licenses/old-licenses/gpl-2.0.html (accessed March 1, 2009).
(39) SOAS Electrochemistry software, http://bip.cnrs-mrs.fr/bip06/software.html. Fourmond, V.; Hoke, K.; Heering, H. A.; Baffert, C.; Leroux, F.; Bertrand, P.; Léger, C. Bioelectrochemistry, in press, 2009, DOI: 10.1016/ j.bioelechem.2009.02.010.
(40) SOAS Manual, http://bip.cnrs-mrs.fr/bip06/soas/.
(41) Dementin, S.; Arnoux, P.; Frangioni, B.; Grosse, S.; Le´ger, C.; Burlat, B.; Guigliarelli, B.; Sabaty, M.; Pignol, D. Biochemistry 2007, 46, 9713, DOI: 10.1021/bi700928m.
(42) Dementin, S.; Burlat, B.; de Lacey, A. L.; Pardo, A.; Adryanczyk-Perrier, G.; Guigliarelli, B.; Fernandez, V. M.; Rousset, M. J. Biol. Chem. 2004,
279, 10508, DOI: 10.1074/jbc.M312716200.
(43) Dementin, S.; Belle, V.; Bertrand, P.; Guigliarelli, B.; Adryanczyk-Perrier, G.; Delacey, A.; Fernandez, V. M.; Rousset, M.; Le´ger, C. J. Am. Chem.
Soc.2006, 128, 5209, DOI: 10.1021/ja060233b.
(44) Girbal, L.; von Abendroth, G.; Winkler, M.; Benton, P. M.; Meynial-Salles, I.; Croux, C.; Peters, J. W.; Happe, T.; Soucaille, P. Appl. Environ. Microbiol.
2005, 71, 2777–2781, DOI: 10.1128/AEM.71.5.2777-2781.2005.
(45) Demuez, M.; Cournac, L.; Guerrini, O.; Soucaille, P.; Girbal, L. FEMS