HAL Id: halshs-00844446
https://halshs.archives-ouvertes.fr/halshs-00844446v2
Preprint submitted on 13 May 2014
HAL is a multi-disciplinary open access archive for the deposit and dissemination of sci-entific research documents, whether they are pub-lished or not. The documents may come from teaching and research institutions in France or
L’archive ouverte pluridisciplinaire HAL, est destinée au dépôt et à la diffusion de documents scientifiques de niveau recherche, publiés ou non, émanant des établissements d’enseignement et de recherche français ou étrangers, des laboratoires
The long Term Effects of the Printing Press in Sub
Saharan Africa
Julia Cage, Valeria Rueda
To cite this version:
Julia Cage, Valeria Rueda. The long Term Effects of the Printing Press in Sub Saharan Africa. 2013. �halshs-00844446v2�
WORKING PAPER N° 2013 – 22
The Long-Term Effects of the Printing Press in Sub-Saharan Africa
Julia Cagé
Valeria Rueda
JEL Codes: D72, N37, N77, O33, Z12, Z13
Keywords: Historical persistence, Printing press, Protestant missions,
Newspaper readership, Political participation, Economic development
P
ARIS-
JOURDANS
CIENCESE
CONOMIQUES48, BD JOURDAN – E.N.S. – 75014 PARIS
TÉL. : 33(0) 1 43 13 63 00 – FAX : 33 (0) 1 43 13 63 10
The Long-Term E↵ects of the Printing Press
in Sub-Saharan Africa
Julia Cag´e Harvard University⇤ Paris School of Economics
Valeria Rueda SciencesPo Paris†
April 2014
Abstract
This article delves into the relationship between newspaper readership and civic attitudes, and its e↵ect on economic development. To this end, we investigate the long-term consequences of the introduction of the printing press in the 19th century. In sub-Saharan Africa, Protestant missionaries were the first both to import the printing press technology and to allow the indigenous population to use it. We build a new geocoded dataset locating Protestant missions in 1903. This dataset includes, for each mission station, the geographic location and its characteristics, as well as the educational and health-related investments under-taken by the mission. We show that, within regions located close to missions, proximity to a printing press significantly increases newspaper readership today. We also document a strong association between proximity to a printing press and contemporary economic development. Our results are robust to a variety of identification strategies.
Keywords: historical persistence, printing press, Protestant missions, newspa-per readership, political participation, economic development.
JEL No: D72, N37, N77, O33, Z12, Z13.
⇤Department of Economics, Harvard University, Littauer Center, 02138 Cambridge.
cage@fas.harvard.edu.
†Department of Economics, SciencesPo, 28 rue des Saint P`eres, 75007 Paris.
valeria.rueda@sciences-po.org.
This research was generously supported by Nathan Nunn and the Warburg Fund at Harvard University. We gratefully thank Yann Algan, Marcella Alsan, Denis Cogneau, Jeremiah Dittmar, James Fenske, Claudia Goldin, Rick Hornbeck, Elise Huillery, James Long, Rachel McCleary, Nathan Nunn, Gerard Padr´o i Miquel, Elias Papaioannou, Nancy Qian, Tristan Reed, Andrei Shleifer, James Snyder and Joachim Voth for their helpful comments. We thank Giovanni Zambotti for his help with ArcGISR. We are also grateful to seminar participants at Harvard University, the Paris School of
Economics, the WGAPE and EHS Conferences for input on this project. We thank Nathan Nunn for data and the Centre Protestant de Mission (DEFAP) in Paris for granting us free access on library material. Danamona Andrianarimanana and Graham Simpson provided outstanding research assistance. All errors remain our own.
1
Introduction
This article delves into the relationship between newspaper readership and civic atti-tudes, and its e↵ect on economic development. To this end, we investigate the long-term consequences of the early introduction of the printing press in the 19th century in sub-Saharan Africa.
The long-term consequences of religious incentives for economic success have been widely studied in the social sciences, the most well-known theory being Max We-ber’s “Protestant Ethic” (Weber, 1930). In addition, according to the principle of the Sola Scriptura, central to the Protestant doctrine, every Protestant should be able to read the Bible. Recent work has emphasized this incentive to increase literacy as an alternative explanation for the economic success of regions that first converted to Protestantism (Becker and Woessmann, 2009; Bai and Kung, 2011; McCleary and Pesina, 2012; Woodberry, 2012; Cantoni, 2013). These studies consider Protestant conversion as a whole. Instead of using such a binary approach, we exploit di↵erent types of missionary treatment. Missions invested in numerous activities. We focus on the introduction of the printing press and show that it still has consequences on news-paper readership nowadays. We discuss other long-term e↵ects of the printing press; we document in particular a strong association between proximity to a printing press and contemporary economic development, and show that newspaper readership might explain this positive relationship. For this purpose, we built and geocoded an entirely new dataset of Protestant mission settlements. For each settlement, we document the exact geographic location, the educational, health-related and printing investments, as well as geographic and historical characteristics. Producing these data is our first con-tribution. Our second contribution is to identify the long-term e↵ects of the printing press using an original empirical strategy relying on our reading of history.
Protestant missionary activity played a central role in the development of a written tradition in sub-Saharan Africa. Because they needed to print Bibles and educational material, Protestant missionaries were among the first to bring the printing press to Africa. They made it accessible to the indigenous populations by both exposing them to the printing technology and granting them access to it (Woodberry, 2012). Investing in printing necessitated a large fixed cost. Protestant missionaries imported the press from Europe and it could not be easily exported to other regions due to transportation costs, and to the specific know-how required to use it. This early availability of the printing technology enabled the local development of a culture of writing and infor-mation di↵usion, beyond the single field of religious literature (Reports of the LMS,
1913). Publishing material for Africa was indeed central to the missionary ambitions since the commencement of their work (Fahs and Davis, 1935); mission presses not only published Christian texts but were also the first to produce all sorts of written mate-rial and newspapers in indigenous languages (Maake, 2000).1 Local newspapers thus
developed first around missionary printing presses, yielding a persistent geographic concentration of publishing activities and newspaper readership.
Using contemporary individual-level data from the Afrobarometer, we find that proximity to the closest location of a mission with a printing press has a positive and statistically significant impact on the probability of reading the news. A one-standard deviation increase in the proximity to a mission with a printing press increases the probability of reading the news on a monthly basis from 3 to 14% of a standard deviation, depending on the specifications. In contrast, proximity to a mission without a printing press has no significant impact on newspaper readership. Moreover, we also find that a one-standard deviation increase in the proximity to a mission with a printing press increases contemporary economic development by around 10% of a standard deviation.
Our econometric analysis attempts to move beyond two forms of selection. First, historical and geographical characteristics might have determined mission station lo-cation preventing us from comparing regions close and far from these settlements. Protestant missionaries did choose to locate in geographically favored areas (Johnson, 1967; Nunn, 2010). Second, Protestant stations invested in di↵erent activities such as printing, health and education. There may be endogenous selection of missions into printing.
To address selection from missions’ location we restrict our sample of analysis to re-gions near historical mission settlements. These are rere-gions for which there is a Protes-tant mission within alternatively a 200-kilometer (124 miles), 150-kilometer (93 miles) and 100-kilometer (62 miles) radius. Because regions near Protestant missions shared similar geographic, institutional and cultural environments, this restriction isolates the specific e↵ect of the printing technology from other possible long-term determinants of newspaper readership embedded in specific mission locations.
To address selection of missions into printing, we first control for observable covari-ates. The set of observable covariates include geographic and historical characteristics as well as distance to historical mission stations that invested in health and
educa-1Fahs and Davis (1935) mention that “the term “Christian literature” was used [by missionaries on
the field] in the widest sense, included all printed matter needed for the pioneer work of evangelization and for the development and expansion of the Church, from tracts, leaflets, school books to such publications as in the strict sense of the matter may be designed “literature””.
tional facilities.2 Despite our attempts to control for observable factors, our estimates
might be driven by unobserved determinants of long-term development and proxim-ity to a historical mission settlement endowed with a printing press. To deal with this problem, we instrument the proximity to the closest printing press. In the 19th Century, missionaries formed numerous societies that were not equally inclined to the same activities. For each mission, we estimate the probability that it was endowed with a printing press using the share of missions from the mission’s society equipped with a printing press in all the regions of the world outside sub-Saharan Africa. Our results are robust to the IV approach.
Related literature Woodberry (2004, 2012) and Woodberry and Shah (2004) first document the role of Protestant missionaries on the consolidation of liberal democracy and emphasize the introduction of the printing press and newpapers as a potential mechanism. They identify the relationship between Protestantism and democracy using a cross-country identification strategy. On the contrary, we estimate the long-term e↵ects of the printing press in sub-Saharan Africa using a variety of within-mission empirical strategies. Our econometric analysis moves beyond selection from missions’s location and selection of missions into printing. Our empirical work relies on the building of a new geocoded dataset and on the use of several previously-unexploited historical archives. Moreover, we explore various channels that may explain persistence and document the e↵ect of the printing press on economic development.
Our results also complement a growing literature documenting the persistence of development paths in developing countries (Acemoglu et al., 2001; Glaeser and Shleifer, 2002; Porta et al., 2008). While this literature mainly compares regions with di↵erent institutional or colonial history, we highlight access to the printing press as a specific long-term determinant of newspaper readership, political participation and economic development, even within regions sharing the same institutional framework. As no-ticed by Feyrer and Sacerdote (2009), Huillery (2009) and Huillery (2011), historical events can explain heterogenous development dynamics. Recent micro-oriented studies therefore isolate specific channels through which a development dynamic was durably established (Nunn, 2008; Huillery, 2009; Dell, 2010; Cogneau and Moradi, 2011; Alesina et al., 2011; Michalopoulos and Papaioannou, 2011, 2013; Voigtl¨ander and Voth, 2012). Of particular importance for sub-Saharan Africa are early investments. Wantchekon
2In the online Appendix, we also use insights from Altonji et al. (2005) and Oster (2013) to assess
the bias due to unobservables using the sensitivity of the treatment to added controls. From this approach, it seems unlikely that the entire estimated e↵ect of the distance to the printing press is driven by unobserved variables.
et al. (2012) highlight for example the durable impact of the first schools in Benin. With the notable exception of Dittmar (2011), there has been no research on the long-term consequences of the printing press. Dittmar (2011) shows that European cities where printing presses were established between 1450 and 1500 grow faster between 1500 and 1600 than similar cities which were not early adopters. While its focus is on urbanization and economic change in the 16th and 17th Century Europe, we iden-tify the e↵ect of the early arrival of the printing press on contemporary newspaper readership, political participation and economic development in sub-Saharan Africa. Consistently with the hypothesis from historians of sub-Saharan Africa (Omu, 1978; Tudesq, 1995), we are the first to show empirically that proximity to the missionary press is associated with higher newspaper readership today. Moreover, we find that contemporary economic development is higher in regions close to the missionary press. Media and the quality of information have recently been shown to a↵ect economic and democratic development (Casey, 2013; Cag´e, 2014). We show that the development of the media might be a channel explaining the relationship between proximity to the printing press and contemporary economic development.
The rest of the paper is organized as follows. Section 2 presents some histori-cal background on missionary history in sub-Saharan Africa and the development of newspapers. Section 3 describes the data, in particular our new geocoded dataset of missions and discusses the determinants of missions’ location and investments. In Section 4, we provide empirical evidence of the long-term impact of proximity to a printing press on newspaper readership. We discuss extensively endogenous selection of missions into printing. Section 5 presents the long-term relationship between prox-imity to a printing press and economic development, and analyzes channels explaining this relationship. Section 6 concludes.
2
Historical Background and Persistence
The introduction of the printing press Protestant missionaries pioneered in the development of a written tradition for sub-Saharan African languages. Wherever they went, Protestants quickly formalized indigenous languages and printed Bibles and ed-ucational material in these languages. Following the principle of the Sola Scriptura, every Protestant should be capable of reading and interpreting the Bible (Eisenstein, 1980; Woodberry and Shah, 2004; Woodberry, 2012). On this topic, Eisenstein (1980, p.158) writes: “(...) Christian missionaries continued to set up printing presses in remote parts of the world to turn out Gospels and Psalters as had been done in Mainz
four hundred years earlier ”. On the contrary, for the Catholic religious practice, read-ing the Bible is not necessary. This di↵erence between Protestants and Catholics appears on the title page illustration of Actes and Monuments (Foxe et al., 1830) showing “devout Protestant with books on their laps and Catholic with prayer beads in their hands” (Eisenstein, 1980, p.173).
Protestant missions facilitated the access to the printing press, acting as the in-termediaries of its di↵usion. For example, in South Africa, several mission societies acquired the printing press in Cape Colony between the 1820s and the 1870s. The Methodists acquired a printing press in Grahamstown in the 1830s. The Anglicans acquired presses for several stations in the eastern Cape in the 1860s and 1870s. In the later 19th and early 20th centuries, missionary societies outside the Cape Colony were also active in publishing, especially in Natal (Switzer, 1984).
Investing in printing technology was a better strategy than importing books, as transportation was long and native languages were mostly unknown in Europe. Due to technological constraints, printing presses could hardly be built in sub-Saharan Africa and had to be imported from Europe. Missionaries mainly imported hand press machines; nevertheless, importation was far from easy.3 Wooden printing presses were,
for instance, highly inflammable materials. In 1819, Thomas Stingfellow and Robert Godlonton, both English settlers and qualified printers, set sail for South Africa with a large crate containing a second-hand wooden press. Their “inflammable” machine was however impounded in Table Bay by the Acting Governor, calling a halt to their printing project before it even started (Gordon-Brown, 1979). Similarly, the Wesleyan missionaries in Grahamstown (South Africa) decided to import an iron printing press at the end of the 1820s. But their project was almost as complicated. When Reverend Stephend Kay arrived with the machine in 1830, the missionaries realized that certain characters required for the Xhosa language were missing from the typing range. The printing press therefore could not be used for almost three years, the time it took for the missing material to arrive to Grahamstone.
This anecdotal evidence illustrates the complexity of starting the printing activ-ity in sub-Saharan Africa. The printing press was, furthermore, a costly object to transport because of its size and weight. It is difficult to have exact information on the size of the press. Some useful information is nevertheless given in Moran (1973) who details the sizes as found in catalogs. The platen of one of the smallest wooden
3At the time of Protestant missions’ settlement in sub-Saharan Africa, there existed three kinds of
printing presses: the wooden press directly inherited from the old Gutenberg’s printing press (Clair, 1976); the iron press, the most famous one being the Stanhope press which appeared around 1800; and the more technological steam press that uses a rolling cylinder in printing to overcome excessive manual strain.
presses found in the 1820s (the Brooke) was 30cm⇥3.8cm⇥45cm (1ft⇥11
2in⇥1ft5in)
while it was 91cm⇥30cm (3ft⇥111
2in) for the largest one. Iron presses were larger.
For example, the size of the Columbian press introduced between 1812 and 1814 and which, according to Moran (1973),‘‘looks much like others of the period”, ranges from 53cm⇥40cm (21in⇥16in) to 106cm⇥68cm (42in⇥27in).
Printing presses were also costly. According to Moran (1973), at the beginning of the 19th Century, wooden presses cost between £60 and £70. When Stanhope introduced his first iron press around 1800, its price was £90. The price began to drop with competition; in 1808, however, it still ranged from £21 to £73. A few years later, at the end of the 1810s, the price of the Columbian press, another iron model, ranged from £100 and £125. In 1820 the price was still above £75. In the 1840s, the Albion press – following the Columbian Press – varied in size from Amateur (15cm⇥12cm or 7⇥51
2in) to Double Royal (100cm⇥58cm or 40in⇥23in). The price of the Double
Royal was £75.4 In 1830, the average annual income in the United Kingdom per
adult was £30, while the average annual wage was £20. The average worker (blue-collar) annual wage was £15.5 According to Maddison’s historical per capita GDP
series, average incomes in Africa around 1820 were about five times smaller than in the United Kingdom. In other words, a printing press cost on average twenty-five years of a worker’s wage.
Printing presses were costly and sizable and missionaries had to import them from Europe. Furthermore, specific knowledge was required to use them. When bringing a printing press to sub-Saharan Africa, the owner had to train apprentices and do much of the mechanical work himself: “the editor, printer, publisher and proprietor were all combined in one person” (Gordon-Brown, 1979). Printing presses were often operated by settlers who had experience on a printing office in England. Moreover, specific educational investments had to be made. Printing schools were established by Protestant missionaries for the indigenous population to acquire the specific knowl-edge required. In 1896, four printing schools were already active in South Africa (Cape Colony), Zanzibar and Malawi (Lake Nyasa) with close to 300 students (Church Mis-sionary Society, ed, 1896). As a consequence, printing presses were not available to the native population outside Protestant mission stations with a printing press.
4Not to refer to the prices of the cylinder machine which were used in the United States at the
time. The simplest Koenig machine, the single cylinder, cost £900. A double machine cost £1,400 and the most advanced one £2,000.
The introduction of the first newspapers Because Protestant missionaries made printing presses available to the indigenous population, most of the first indigenous newspapers were printed and sponsored by mission centers. Woodberry (2012) qualifies conversionary Protestants as being “a crucial catalyst initiating the development and spread (. . . ) of newspapers”.
The first newspaper intended for black readers, the Umshumayeli Wendaba (“Pub-lishers of the News”), written in Xhosa, was published as an irregular quarterly in 1837 and printed at the Wesleyan Missionary Society in Cape Colony.6 The Iwe
Iro-hin (“The Newspaper”) was founded in 1859 as a publication directed by Reverend Henry Townsend from the Anglican Church missionary society in Nigeria. Isigidimi samaXhosa (“The Xhosa Messenger”), the first African newspaper edited by Africans, was first released in January 1876 and printed at the Lovedale Mission Press in South Africa. Eight years later, in November 1884, the English/Xhosa weekly Imvo Za-bantsundu (“The African Opinion”) was published. It was the first black-owned news-paper in South Africa. The Imvo Zabantsundu was edited by John Tengo Jabavu, former editor of the Isigidimi, and perhaps “the most widely known mission-educated African in Southern Africa” at the time (Switzer and Switzer, 1979).
In regions where Protestant missions were less active, the first newspapers appeared only at the beginning of the 20th Century and no indigenous newspapers were created before World War I. Before the war, the printing presses were mostly owned by the colonial powers. The first paper in Abidjan (Ivory Coast) to be owned and edited by an African, the Eclaireur de la Cote d’Ivoire, was first published in 1935 (Mytton, 1983).
This lag of more than one century in the timing of creation of the first indigenous newspapers might explain the persistent e↵ect of the proximity to a printing press on newspaper readership today. Newspapers take time to consolidate. In most sub-Saharan African countries, the newly-established government tried to take control of the press after independence. These nationalizations did not succeed in countries where newspapers were well established, stable and independent before colonization. In Nigeria, for instance, despite the 1966 coup d’´etat, the ensuing military regime and the development of a state-owned press, independent newspapers managed to survive. Similarly, even during Apartheid in South Africa, the black press and anti-Apartheid white-owned presses continued to exist. The Daily Dispatch, the SASO Newsletter or
6The London Missionary Society and Methodist missions also produced the earliest journals aimed
at the Tswana Christian community from their stations at Kuruman and Thaba’Nchu. Mokaeri Oa Becuana, Le Muleri Oa Mahuku (“The Teacher of the Bechuana, the Announcer of the News”), which started in 1857, is regarded as the oldest newspaper in the Tswana language (Switzer, 1984).
The World regularly di↵used their anti-Apartheid stances. This was not the case in former French colonies.
Reading habits exhibit strong persistence over time. A survey on newspapers made by the Lumina Foundation across Lagos, Enugu, Oyo, Edo, Kogi, Kaduna and the River States, highlights the persistence of reading habits in southern and middle-belt Nigeria. 59% of the respondents replied that they read newspapers as a family-inherited culture (Fraser, 2008).
The persistence of newspaper readership is of particular importance today despite growing questioning of the future of newspapers in the internet era. Sub-Saharan Africa is one of the few places in the world where the newspaper market is still growing. This market expands as literacy steadily increases whereas other media like television or internet require capital that most sub-Saharan Africans do not have. Moreover, as suggested by Bratton et al. (2005), it is harder for governments to control newspa-pers while they can control radio or television by restricting supply and imposing a government monopoly.
Testing for the long-term impacts of the historical printing press on newspaper concentration ideally requires information on newspaper supply. Such information is not available at the local level in sub-Saharan Africa. The few datasets available only provide information on the main national newspapers. In the online Appendix, we pro-vide cross-country epro-vidence of the persistence of newspaper supply.7 Figure A.6 shows
the cross-country correlation between the number of newspapers that have existed and the average distance of the cities surveyed in the Afrobarometer to the closest histori-cal mission settlement with a printing press. The figure displays a negative correlation between the average distance to the printing press and the total number of newspapers recorded. Figure A.7 shows the correlation between the date of publication of the first newspaper and the average distance of the cities surveyed in the Afrobarometer to the closest historical Protestant mission station with a printing press. We observe a posi-tive correlation between the distance to the printing press and the publication date of the first newspaper: the closer a location is to a historically attested printing press, the sooner the first newspaper is recorded. This suggestive evidence supports the notion of the early emergence of newspapers around mission stations and the persistence of the concentration pattern. In the remainder of the paper, newspaper readership is our variable of interest.
7In the online Appendix, we present the few data sources on sub-Saharan African newspapers that
3
Data and Missionary Locations
3.1
Data
3.1.1 Historical data
Missionary activity We construct the mission-level data from the Geography and Atlas of Christian Missions (Dennis et al., eds, 1903). We geocode the maps of sub-Saharan African regions from this atlas. The maps locate all the Protestant mission stations in 1903 (an example of these maps is provided in the online Appendix Fig-ure A.2).
As opposed to other available geographic datasets of Protestant missions (Nunn, 2009a), ours contains detailed information for each mission settlement. In the Geog-raphy and Atlas of Christian Missions, each mission station is uniquely identified in a statistical appendix providing information on the mission’s size (number of students, of missionaries, etc) and a detailed record of its activities and investments. For ex-ample, we know whether each mission had a printing press, a school, a high school, a dispensary, or a hospital. The exhaustive list of variables and a reproduction of one page of the statistical index are provided in the online Appendix Figure A.1. We digitize this information for the entire world and geocode it for Africa. Our sample of sub-Saharan African missions includes a total of 723 Protestant missions out of which 27 were equipped with a printing press in 1903. Figure 1 shows the location of mission stations and their printing presses in 1903. This dataset is, to the extent of our knowledge, the most exhaustive recording of missionary investments in the world, and it is geocoded for Africa. We hope this dataset will be of use for future research. Since very few Catholic missions are recorded in the Geography and Atlas of Chris-tian Missions, we use data from B´ethune (1889) to locate them. This source does not provide information on the investments conducted. This is not an empirical issue since Catholic missionaries had no role in bringing the printing press. Moreover, our specifications always controls for the distance to the closest Catholic mission.
[FIGURE 1 HERE]
Population density Historical population density comes from the HYDE 3.1 database (Klein Goldewijk et al., 2011). This database provides rasters of estimated historical population density on a 0.5 by 0.5 degree latitude longitude grid. The estimates are the results of a bio-geographic model that combines information on population density at
the national and subnational levels with climatic and geographic data to infer a local es-timate of the population density (Klein Goldewijk et al., 2010, 2011). For the national-level population density, data are from the Maddison Project Database, McEvedy and Jones (1978) and Livi-Bacci (2001). Sub-national level data come from censuses. The HYDE 3.1 database provides 56 rasters covering the period from 10000 BC to AD 2000. According to the documentation, the data is reliable for Africa starting from AD 1700. Figure A.3 in the online Appendix gives examples of the population density maps in 1700, 1800, 1900 and 2000. We extract all these estimates in a bu↵er of 10 km around each mission and around each town from the Afrobarometer.
Figure 2 shows the evolution of population density, as estimated in the HYDE 3.1 database, around missions depending on whether they had a printing press. Missions start to diverge in the late 19thCentury. Population density is estimated to be
system-atically higher around missions with a printing press after missions started to settle (the average arrival date of missions in Africa is 1850). Such divergence between mis-sions with and without the printing press supports our hypothesis of a positive impact of the missionary printing press for long-term development. However, because data from HYDE 3.1 is based on imperfect estimates of population density, we can only interpret this figure as suggestive evidence.
[FIGURE 2 HERE]
Publication records We gather information on the number of publications printed at the mission press until 1923, twenty years after the publication of Geography and Atlas of Christian Missions. The Bibliography of Christian Literature (Rowling and Wilson, 1923) inventories all the books and reviews, religious or not, published by the missionaries. From this source, we identify 18 presses from our original sample that had a publication record in 1923. These printing presses were probably the most productive or the ones with the most stable production across time.
Historical controls The Ethnographic Atlas (Murdock, 1967) provides precolo-nial characteristics at the ethnic group-level such as initial population density. The slave trade data come from Nunn (2008). We geocode this data at the mission-level. Geocoded town-level data are from Nunn (2008).
3.1.2 Contemporary data
Newspaper readership Data on newspaper readership are from the 2005 Afro-barometer surveys. There are 17 sub-Saharan African countries in these surveys:
10 former English colonies (Ghana, Kenya, Lesotho, Malawi, Nigeria, South Africa, Tanzania, Uganda, Zambia and Zimbabwe), 4 French (Benin, Madagascar, Mali and Senegal), 2 German (Botswana and Namibia) and 1 Portuguese (Mozambique). Sur-veys are based on interviews conducted in the local languages from a random sample of either 1,200 or 2,400 individuals of voting age in each country. Overall, they cover approximately 21,000 individuals sampled to constitute representative groups at the national level.
The Afrobarometer provides individual-level subjective data on media consumption and civic attitudes. On average only 34% of the individuals surveyed read a newspaper at least once a month. The Afrobarometer also provides information on a set of individual controls: education, age, sex and ethnicity, among others. This data is geocoded at the district level.8 Table A.2 in the online Appendix provides summary
statistics for these variables.
Light density at night To proxy for contemporary economic development, we fol-low Michalopoulos and Papaioannou (2013) and use satellite images of light density at night. The data come from the Defense Meteorological Satellite Programs Operational Linescan System of the National Geophysical Data Center. This system reports im-ages of the earth at night captured from 8:30pm to 10:00pm local time. The satellite detects lights from human settlements, fires, gas flares, lightning, and the aurora. The measure ranges from 0 to 63 and is calculated for every 30-second area (approximately 1 square kilometer). The resulting annual composite images of lights are created by overlaying all images captured during a calendar year, dropping images where lights are shrouded by cloud or overpowered by the aurora or solar glare (near the poles), and removing ephemeral lights like fires and lightning (the map used is presented in the online Appendix Figure A.4). We construct average light density in 2012 for each mission and each Afrobarometer town. This measure is the average light density re-ported on the night light raster in a 10 km bu↵er around each location. Following Michalopoulos and Papaioannou (2013), we use the natural logarithm of average light density.
In the online Appendix, Figure B.1 plots our measure of average light density for Afrobarometer towns as a function of the distance to the printing press. The plot presents first suggestive evidence of the negative relationship between the two
8Individual-level readership data allows us to control for other individual characteristics. There is
no data on African newspaper circulation available at the district level. Moreover, as our identifica-tion strategy uses precise geographic variaidentifica-tion, we need extensive district-level informaidentifica-tion and such information is not available for newspaper circulation.
variables.
Geographic characteristics Finally, to control for geographic characteristics at the town and mission level, we use the Global Agro-Ecological Zones (GAEZ) data. The data are geocoded and provide information on annual precipitation levels, the average suitability for rainfed crops, the number of agriculture growing days per year and the accumulated temperature in the year.
3.2
Determinants of Missions’ Location and Investments
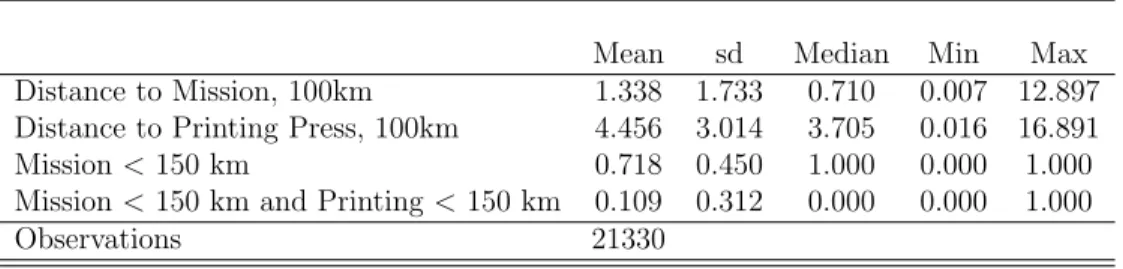
Protestant missions were the first to make the printing press available to the indigenous population and to sponsor the first indigenous newspapers. Before turning to the empirical analysis, we analyze the determinants of mission location. We also compare missions that invested in the printing technology and missions that did not. On average, towns from the Afrobarometer are located 133.8 km away from the closest mission settlement and 70% of them are located 150 km away or closer to the closest mission settlement (Table 1). As a baseline, we use the 150 km threshold to define towns close to a mission.[TABLE 1 HERE]
Mission location A number of factors played a role in determining the location of mission settlements. Among them are access to a clean water supply, the ability to import supplies from Europe, the abundance of a fertile soil that could be used to grow crops, and a high altitude with a temperate climate (Johnson, 1967). Moreover, mission locations exhibited a form of path-dependence. The routes of initial missionary explorers determined which parts of Africa were the best-known to Europeans, as well as the locations of the earliest mission stations from which larger networks of stations were developed. The colonial railway network is another factor that a↵ected mission locations, as well as the slave trade (Johnson, 1967; Nunn, 2010).
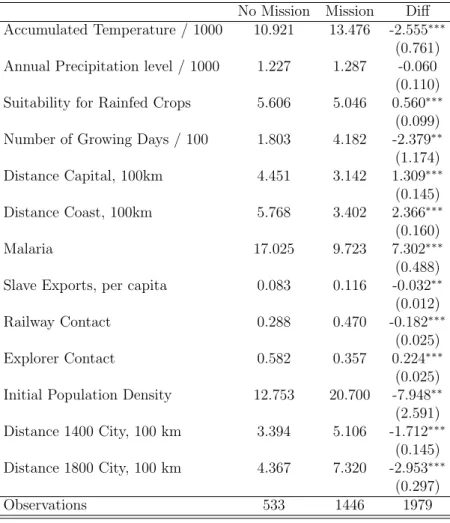
These known trends are for the most part confirmed in our data. In Table 2 we perform a t-test on the equality of means for geographic and historical characteristics of towns located near (less than 150 km) and far (more than 150 km) from a historical mission settlement. As for the geographic characteristics, we find that missions locate in places with a lower prevalence of malaria and a more favorable climate (measured by the accumulated temperature and the annual precipitation level). They also locate in places more suitable for agriculture (measured by the suitability for rainfed crops and the number of agricultural growing days). Moreover, they locate closer to the
coast. As for the historical determinants of mission location, slave exports are higher in places near missions. We also find that missions have a higher probability to be located near historical railway networks, and a lower probability to locate near an explorer’s route.
An open question in the literature is the general e↵ect of population density. Some missionaries intentionally built missions in more remote locations where the “word of God” otherwise would not have reached; whereas other missionaries recognized the benefits associated with dense populations and targeted these groups (De Gruchy, 1999; Nunn, 2010).
According to Table 2 regions near historical mission settlements had on average a higher population density and more favorable geographic conditions. In our empiri-cal analysis we only focus on regions near historiempiri-cal mission settlements. Moreover, our specifications always control for all the geographic and historical characteristics described in Table 2.
[TABLE 2 HERE]
Location of the printing press Did missions with a printing press locate in regions with specific geographical or historical characteristics correlated with determinants of newspaper readership? Table 3 compares the geographic and historical characteristics of missions with and without a printing press and perform a t-test on the equality of means. Missions with the printing press were not, on average, located in more geographically favored areas. None of the geographical indicators are significantly dif-ferent between the two groups, except for malaria ecology which is higher for missions that invested in the printing press.
Historical characteristics exhibit a di↵erent pattern. Slave export and railway con-tact have similar means between the two groups, as well as initial population density. On the contrary, missions with a printing press have more favorable historical charac-teristics: they are closer to historical cities and explorer routes. All our specifications control for these characteristics.
[TABLE 3 HERE]
3.2.1 The printing press and other investments
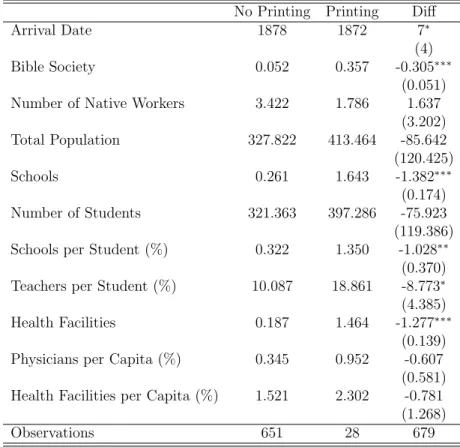
Did missions with a printing press conduct di↵erent types of investments or have dif-ferent characteristics? Table 4 presents descriptive statistics comparing investments
and characteristics of missions with and without a printing press. Mission character-istics are similar between the two groups, except that missions with a printing press also have a much higher probability of being Bible Societies.
Missions with a printing press have on average more schools, both in level and per student than missions without, as well as more teachers per student. We use various empirical strategies to check that our results are not driven by these higher investments in education. Finally, missions with a printing press have more health facilities in level. However they do not invest more in health per capita. Our specifications always control for missions’ characteristics and investments.
[TABLE 4 HERE]
4
Newspaper Readership and the Printing Press: Empirical
Analysis
4.1
Specification and Identification Strategy
Let i index individuals, j index the village in which individuals live9, e index the
ethnicity and c index the country. Standard errors are clustered at the village level. Equation 1 describes our preferred identification equation:
Newsijec= ↵ Distance Printing Pressj
+ 1Distance Missionj+ Xi0 2+ Yj0 3+ Ze0 4+ c+ uijec
(1) “Distance Printing Pressj” is the logarithm of the distance from village j to the
closest mission with a printing press. Distances are measured in kilometers. The parameter ↵ is our parameter of interest. It captures the impact of the proximity to a printing press on newpaper readership today.
“Distance Missionj” is the logarithm of the distance from village j to the closest
mission. The distances are computed using the geocoded information described in Figure 1 and Section 3.1.
We control for a large set of covariates that might determine individual behaviors today and historical mission settlement. The choice of the control set is inspired from Nunn (2008) and Michalopoulos and Papaioannou (2011).
The vector of individual controls X0
i includes the age of the surveyed individuals,
their age squared, their sex, their level of education, their religion (two binary variables
9In the Afrobarometer, individuals are assembled by the smallest unit among villages, cities or
districts. We defined this unit using the latitude and longitude provided in the Afrobarometer. We call “village” this unit in the remainder of the paper.
indicating whether the individual is Protestant or Catholic), their television and radio consumption, and two indices ranging from 0 to 4 indicating the intensity of cash and water constraints. These two indices are proxies for living standards and geographical constraints.10
The vector of village-level controls Y0
j includes a wide range of historical and
ge-ographical factors that may have played a role in determining both mission center locations and long-term economic development. At the village level, we control for the distance to the capital city, whether the village is located in an urban area, current and historical distance to the coast11, the historical exposure to the trans-Atlantic and
Indian slave trades, the precolonial population density (in 1700), and the population density in 2005.
At the ethnicity-level (vector of ethnicity-level controls Z0
e), we control for the
malaria ecology of the land, average elevation, and the share of land within 10 km of water.
The three vectors of individual-, village- and ethnicity-level controls (X0
i, Yj0 and
Z0
e) plus the country fixed e↵ects constitute the baseline set of controls.
4.2
OLS Estimation
4.2.1 Baseline Results
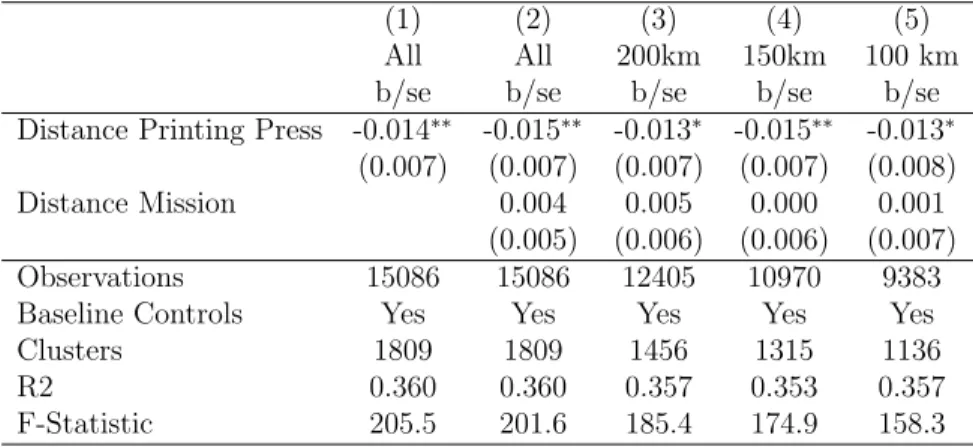
Table 5(a) presents OLS estimates of the impact of the proximity to a mission with a printing press on newspaper readership. In all the specifications we include the baseline controls. Column 1 shows that a 1% increase in the proximity to the closest mission with a printing press is associated with an increase in the probability of reading a newspaper by nearly 1.4 percentage points. Controlling for the proximity to the closest mission increases slightly the point estimate to 1.5 percentage points; there is no e↵ect of the proximity to a mission without a printing press (Column 2). This negative coefficient is statistically significant and economically meaningful. A one-standard deviation increase in the logarithm of the proximity to the printing press increases the probability of reading newspapers by 3.6% of a standard deviation (Column 2). In the following tables we include the proximity to a mission without a printing press in our baseline set of controls.
Reducing the sample to individuals close to a Protestant mission As shown in Section 2, regions near historical mission settlements have on average a higher
10This set of individual level controls is similar to the one used in Nunn and Wantchekon (2011). 11Historical distance to the coast is the distance to the coast of the respondent’s ethnicity.
population density and better geographic conditions than regions further. Moreover, all the mission stations invested in activities, especially education, that are probably correlated with long-term development. Therefore, we restrict our sample of analysis to regions near historical mission settlements. Such restrictions aim at correcting for possible selection in mission location. The rest of the analysis is conducted within regions near missions.
In Columns 3 to 5 of Table 5(a) we present the results of the estimation of equa-tion (1) when the sample is restricted to individuals near a Protestant mission. Near is sequentially defined as being in a village with at least a Protestant mission in a 200 km (Column 3), 150 km (Column 4), and 100 km (Column 5) radius around the village. These restrictions represent, respectively, 80%, 70% and 60% of the sample.
For all the di↵erent specifications, we find a negative and statistically significant impact of an increase in the proximity to a printing press. The point estimates vary between 1.3 and 1.5 percentage points. Considering individuals living in a village with at least one mission in a 150 km radius around the village (Column 4), we find that a one-standard deviation increase in the proximity to the closest printing press increases newspaper readership by 3.1% of a standard deviation. A variance decomposition of the results shows that the proximity to the printing press and the other covariates together explain 21.3% of the total variation in newspaper readership. Of these 21.3%, 0.4 to 2.9% is explained by the distance to the printing press.
The online Appendix Table B.1 reports the estimated coefficients for all the covari-ates. All the coefficients are of the expected sign. Table B.2, reports the standardized coefficients (beta coefficient) for all the covariates. The impact of the distance to the printing press is of the same order of magnitude as the intensity of cash constraints, the distance to the capital and smaller than the urban area dummy. The e↵ect of the respondent’s level of education is around ten times higher. This di↵erence is not surprising since distance to the printing press captures a historical e↵ect that might have been attenuated over time. The e↵ect of the interaction between proximity to the printing press and education is discussed in Section 5.
As the sample is restricted to regions close to historical mission settlements, the e↵ect found can be lower than the real ones if the printing press has a spillover e↵ect across regions. If the e↵ect of the printing press vanishes in regions outside the thresh-old but is present in regions considered, then our estimates might indeed be downward biased because of spatial externalities (Miguel and Kremer, 2004; Michalopoulos and Papaioannou, 2011).
4.3
Endogenous Selection of Missions into Printing
A crucial empirical challenge is the possibility of endogenous selection of missions into printing. Therefore, we augment regression (1) with an extensive set of covariates. We then develop an instrumental variable approach.
4.3.1 Selection on Observables
We augment our baseline set of controls with additional potential determinants of the location of the mission stations and of the missions with a printing press among mission stations. These determinants include a binary variable equal to one if any part of the railway network was built on land historically inhabited by the ethnic group and zero otherwise; a binary variable equal to one if an European explorer traveled through land historically occupied by the ethnic group; and the distance to the closest precolonial city (cities in 1400).
We also control for the distance to the closest missionary investments that may be correlated with long-term development: di↵erent types of schools (high school, boarding school, college, etc) and health facilities. Similarly, we add geographic and investment characteristics of the closest mission: the annual precipitation level, the suitability for rain-fed crops, the number of agricultural growing days and the accumu-lated temperature, the number of native workers, students, teachers and physicians, the total population of the mission and the arrival date of the mission. Finally, we add the logarithm of the distance to the closest Catholic mission in 1889.
Table 5(b) shows the results of the estimation of equation (1) when all these addi-tional controls are added. Our results are robust to the inclusion of these controls and they are more statistically significant. Moreover the magnitude of the e↵ect is larger. The point estimates vary from 1.8 to 2.3. A one-standard deviation increase in the proximity to the closest printing press increases newspaper readership by 5.2% of a standard deviation when considering the 100 km threshold (Column 3).12
4.3.2 IV Estimation
Despite our attempts to control for observable factors, our estimates might be driven by unobserved factors correlated both with long-term development and proximity to historical location of a mission with a printing press. We thus develop an instrumental variable approach. This approach is based on our historical readings of the di↵erent
12In the online Appendix Table C.4 we report the coefficients for all the di↵erent distances. Only
preferences of missionary societies for the printing press.13
In the early period of missionary expansion, missionaries faced numerous difficulties despite the support of an increasing number of church ministers (Ellis, 1844). Travels were often costly and required careful planning. Moreover, independent missionaries could face the hostility of colonial powers, especially fearing anti-slavery positions. In the late 18th Century, they also endured the hostitility of the clergymen who disagreed with the conversion methods used by the evangelists.
As a result of the raising popularity of the missionary work and the struggles missionaries faced, di↵erent associations of missionaries and evangelists started to emerge in the late 18th Century. The first societies were mostly launched under the impulsion of the evangelists, for instance the Baptist Missionary Society (BMS) founded in 1792 by William Carey. Many of them had no denominational affiliation and emerged as the association of churchmen convinced of the importance of the missionary work. In 1795, several meetings between di↵erent churchmen (among which John Love, John Townsend, John Eyre and George Townsend) established the founding principles of the London Missionary Society (LMS). These principles reflect the will to overcome denominational barriers and join e↵orts for the purpose of missionary work. This will is clear in the founding letter of the LMS signed in 1795:
“We [. . . ] declare our earnest desire to [. . . ] unite together, purposing to use our best endeavors that we may bring forward the formation of an extensive and regularly organized society, to consist of evangelical ministers and lay brethren of all denominations, the object of which society shall be, to concert and pursue the most e↵ectual measures for accomplishing this important and glorious design.” (Ellis, 1844, p.19).
In the early 19th Century, numerous and diverse societies had been created. The Church Missionary Society (CMS), for instance, was founded in 1800 by the Church of England in response to the raising popularity of the missionary work (Stock, 1899). The aim of these organizations was to coordinate e↵orts and funds of the missionary work. Their priorities di↵ered and depended on the preferences and means of the soci-eties’ command. The CMS, for instance, “in the absence of missionaries,[. . . ] fell back upon the printing press as an agent of evangelization” from the start of its activity
13Bai and Kung (2011), in their study of protestantism and economic prosperity in China,
sim-ilarly compare the e↵ects di↵erent Protestant denominations had on economic outcome, di↵erent denominations emphasizing Calvinist principles di↵erently. We improve this empirical strategy in two important ways. First, while Bai and Kung (2011) work at the denomination level, we work at the society level (see more on this below). Second and most importantly, we are able to measure the exact investments made by each society.
(Stock, 1899, p.75). Similarly, The Du↵, the first vessel sent abroad by the LMS to Tahiti, carried “a valuable collection of articles of clothing, books, printing apparatus, and useful tools” (Ellis, 1844, p.40). On the contrary, the Christian Missionary Al-liance, founded in 1887 by the wealthy Reverend Albert B. Simpson, had not invested in a single printing press ten years later, even though it had already settled 52 missions around the globe (Dennis et al., eds, 1903).
IV strategy There are 5,535 missions in the entire world outside sub-Saharan Africa (6,258 including sub-Saharan Africa) reported in the Geography and Atlas of Christian Missions. Only 2.3% of these missions had a printing press.14 These missions were
affiliated with 262 di↵erent societies among which 69 are present in both sub-Saharan Africa and the rest of the world. Moreover, the arrival date of missions with a printing press to Africa and to the rest of the world is almost identical (1877 for both samples). Let “Society PPm” be the share of missions from mission m’s society equipped with (at least) a printing press in all the regions of the world outside sub-Saharan Africa. In sub-Saharan Africa, we know the originating society for 679 out of our 723 missions (44 missions were either affiliated to a society existing only in sub-Saharan Africa or not affiliated to a society). Among the 69 originating societies recorded, 16.8% had a printing press in at least one of their missions. Our instrumenting assumption is that the larger this share, the more likely it was for a mission associated with this society to invest in a printing press in sub-Saharan Africa. In the online Appendix Table B.5 we find a statistically significant and positive correlation of “Society PP” with the probability that a mission has a printing press.
Let “Village Printingj(k)” be the sum of Society PPm for all the missions
his-torically located less than k km away from village j. For each village j, we call mj(x) any mission station historically located x km away from j. The variable
“Village Printingj(k)” is defined in equation (2):
Village Printingj(k) =
X
xk
Society PPm(x) (2)
Figure 3 represents the construction of the instrumental variable. Take the example of two di↵erent villages j1and j2and two di↵erent distances given by the radii k0and
k1. If we consider the smaller radius k0 then village j1 has a higher probability – as
estimated by Village Printingj1(k0) – to be closer to a mission with a printing press
than village j2. By construction, the larger the radius, the higher the potential value
14This is slightly lower than in sub-Saharan Africa where the percentage of the missions with a
of Village Printingj(k).
[FIGURE 3 HERE]
“Village Printingj(k)” is used as an instrument for “Distance Printing Press”. The
exclusion restriction is that the share of missions from a society having invested in a printing press outside sub-Saharan Africa (“Society PPm”) is not correlated with long-term determinants of newspaper readership in sub-Saharan Africa. For instance, societies that invested the most in printing presses should not be the richest, nor have invested more, nor be located in places with the best geographic characteristics. We provide evidence supporting the exclusion restriction in Table 6 and online Appendix Tables B.3. Table 6 compares the average investments of missionary societies outside sub-Saharan Africa depending on whether they invested in the printing press. There is no significant di↵erence other than the arrival date. In 1903, societies that had invested in the printing press had settled, on average, earlier than those that did not. Similarly, Table B.3 in the online Appendix reports OLS estimates of the mission-level regression of “Society PP” on mission characteristics, investments, geographic and historical characteristics. None of the coefficients are statistically significant. Societies that invested the more in printing outside sub-Saharan Africa did not systematically conduct other type of investments in sub-Saharan Africa, nor did they settle in more geographically favored regions.
[TABLE 6 HERE]
Results Table 7 presents the results using a 50 km radius for the construction of “Village Printing (k)”.15 Table 7 Panel A gives the results of the first stage of the
es-timation. All the coefficients are negative and statistically significant. A one-standard deviation increase in “Village Printingj(50)” decreases the distance to the closest
print-ing press by 5.7% of a standard deviation for regions located less than 150 km away from a historical mission settlement (Column 2).
Table 7 Panel B presents the results of the second stage of the estimation. The positive impact of the proximity to a printing press on newspaper readership is robust to the instrumentation strategy. If anything, the results tend to be larger than those obtained in the previous sections. A one-standard deviation increase in the distance to the closest printing press decreases individual newspaper readership nowadays by 10% of a standard deviation for regions located less than 150 km away from a historical
15In the online Appendix Tables B.6 and B.7, we show that the results are robust to the use of
mission settlement (Column 2). Results for regions located less than 200 km or 100 km away from a historical mission settlement are of similar magnitude.
The magnitude of the IV coefficients is larger than the OLS’s. The OLS estimates might be su↵ering from attenuation bias due to measurement error in mission locations. This measurement error might come from the “manual” construction of the dataset or errors in placement from the historical maps. It might make it more difficult to gauge the e↵ect of the proximity to a mission with a printing press in the OLS estimation. The instrumentation would then be correcting for the attenuation bias, hence increasing the point estimates.
[TABLE 7 HERE]
Taken together, all the results from Section 4 are consistent with the idea that the introduction of the printing press has a long-lasting e↵ect on newspaper readership.
4.3.3 Robustness Checks
We perform several robustness checks. This section briefly describes them; the detailed results for these tests are in the online Appendix.
In the online Appendix Section C.1, we check that the results of Table 5(b) are robust to using a matching strategy. As opposed to the OLS estimator that imposes linearity in the parameters, the matching estimator allows for non-linear e↵ects of observables (Acemoglu, 2005). Our results robust to using matching (Table C.3).
Moreover, in the online Appendix Section C.2, we use insights from Altonji et al. (2005) and Oster (2013) to assess the bias from unobservables using the sensitivity of the treatment to added controls under the proportional selection assumption. The resultsmake it unlikely that the entire estimated e↵ect of the distance to the printing press is driven by unobserved variables.
Some of the contemporary controls, especially education, may be bad controls in the sense of Angrist and Pischke (2009). This issue would arise if any of the contemporary controls were also outcomes. Online Appendix Table C.6 presents the results of the estimation of equation (1) with the additional observables added in Table 5(b) but without education, religion, cash constraints, water constraints, population density in 2005, distance to the capital, watching the news on television and listening to the news on the radio in the controls set. The results are not significantly di↵erent from those presented in Table 5(b).
Because missions that invested in the printing press might be larger, we also check that our e↵ect is not driven by the mission size. As a falsification test, we estimate
equation (1) with the distance to the 30 largest missions as the main explanatory variable.16 The results are given in the online Appendix Table C.7. Distance to the
largest missions has no e↵ect on newspaper readership nowadays.
Online Appendix Table C.9 shows the results of the estimation of equation (1) for a sample restricted to former British colonies. Our results are robust to this restriction and the magnitude of the e↵ect remains unchanged. Our results thus cannot be entirely attributed to the colonizer’s legal origins.
We also estimate equation (1) using two-way clustering at the closest mission and the village levels. Clustering the standard errors at the mission level might be relevant should the closest mission be also considered as a treatment. Table C.8 shows that our results are robust to this two-way clustering strategy. Our results are also robust to a Probit rather than an OLS specification (online Appendix Table C.5).
Finally, online Appendix Table C.10 presents the results of the estimation of equa-tion (1) when the dependent variable N ewsijc is a binary variable equal to one if
individual i in village j and country c listens to the news on the radio (Columns 1 to 3) or watches the news on television (Columns 4 to 6) at least once a month. We find no statistically significant e↵ect of the printing press on listening to the news on the radio or watching them on television.
5
Discussion
Is newspaper readership today really measuring regional persistence in newspaper reading habits? Or are our results driven by an increase in education in regions close to the printing press, even within regions close to missions? This section first explores the possible channels explaining the e↵ect of the printing press on newspaper readership. It then investigates the relationship between proximity to a printing press and political participation. Finally, it documents the long-term consequences of the printing press on economic development and studies the channels explaining this relationship.
5.1
Printing Press and Newspaper Readership: Channels of
Transmission
Education As one of the missionaries’ objectives was to maximize conversion through reading the Bible, they taught literacy to the native population (Woodberry, 2004).17
16The size of the mission is the total number of students, missionaries and indigenous teachers and
workers. Within these 30 largest mission, only two have a printing press.
17The role of missionary activity on literacy was significantly reduced later in the Century (around
A number of recent studies emphasize the positive consequences on human capital of conversion through reading the Bible (Becker and Woessmann, 2009; Bai and Kung, 2011; McCleary and Pesina, 2012; Woodberry, 2012). In the sub-Saharan African con-text, Nunn (2009b) finds that Protestant missions increased educational attainment (see also Nunn and Wantchekon, 2011). Human capital accumulation, fostered by missionary activity, might thus be driving our results. We show in this section that it is not the case.
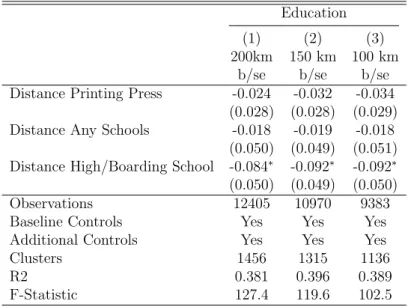
Two aspects of our econometric analysis account for the e↵ect of education on newspaper readership, independently of proximity to the printing press. First, educa-tion is included in our baseline set of controls. Second, we control for the number of teachers and the number of students in the nearest mission and the distance to the nearest mission with a school or a high school. These controls capture the historical regional determinants of education. Moreover, as a falsification test, we estimate the impact of the proximity to a printing press on education. Table 8 shows no statistically significant e↵ect of the distance to a printing press on education.
This result does not imply that missionaries had no long-term impact on edu-cation and human capital accumulation. Consistently with the existing literature (Wantchekon et al., 2012), we find a positive and statistically significant impact of the proximity to a mission with a high-school on education (Table 8). For regions located less than 150 km away from a mission, a one-standard deviation increase in the distance to the closest mission with a high school increases education today by 6.9% of a standard deviation. Moreover, distance to the printing press can only a↵ect newspaper readership if people are educated enough to read the news. In Table 9(a), we interact the distance to the printing press with a binary variable equal to one if the education level of the individual is above the median (equivalent to having com-pleted elementary schooling). As expected, proximity to a printing press only a↵ects newspaper readership when education is high enough.
[TABLE 8 HERE]
Publication records Is newspaper readership today really capturing the regional historical development of the newspaper and printing industry? To answer this ques-tion, we use a proxy for the regional development of the publishing industry; we gather information on the number of publications printed at the mission press until 1923. In the publication record data, we find that 18 missions with a printing press (out of the 27 missions equipped with a printing press in 1903) had a publication record in 1923. The missions where these printing presses were located did not exhibit any particular
type of geographical or historical characteristics nor did they specialise in any kind of specific investments (online Appendix Tables A.3 and A.4). We therefore interpret the presence of such records as a proxy for the activity of the printing presses: printing presses with a publication record in 1923 were probably the most active. Table 9(b) shows the result of regression (1) when we add distance to the closest mission with a publication record (“Distance PP with Publication”) as a control. The coefficient as-sociated with “Distance PP with Publication” is negative and statistically significant. Moreover, once we control for the distance to a mission with a printing press and a publication record, the coefficient associated with the distance to a printing press is no longer statistically significant. This suggests that the impact of the distance to a printing press on newspaper readership may be explained by the development of publishing activities.
The results of Table 9(b) have to be taken carefully since they rely heavily on the only archival source we found to track the middle-run evolution of the publishing activ-ities of missions with a printing press. However, they are in line with our assumption that the long-term impact of the printing press on newspaper readership may be due to the early development of the newspaper industry around missions with a printing press.
[TABLE 9 HERE]
5.2
Political Participation
The literature on the determinants of political participation in sub-Saharan Africa has mainly focused on the role of ethnicity (Gibson and Long, 2012; Ichino and Nathan, 2013a) and clientelism (Ichino and Nathan, 2013b). We contend that media access – through proximity to a printing press – might be another important determinant of political participation. Information may indeed a↵ect political outcomes (DellaVigna and Kaplan, 2007; Enikolopov et al., 2011) and participation at elections (Str¨omberg, 2004; Oberholzer-Gee and Waldfogel, 2009; Gentzkow et al., 2012; Cag´e, 2014).18
We estimate the impact of the distance to a printing press on three di↵erent
mea-18With the notable exception of Reinikka and Svensson (2005), there has been very little
quanti-tative work in economics on mass media focusing on Africa although Africa is an exemplary place to study newspaper activity.
sures of political participation19: registration for elections20; voting in past elections21;
and a proxy for political participation at the local level (“Actions as Citizen”22). We
also estimate its impact on a measure of satisfaction with the democratic system (“Sat-isfaction”23) as well as on a proxy for the quality of political discussion at the local
level (“Listen”24).
Proximity to the printing press might have a↵ected political participation through newspaper readership. However, the historical dynamics associated with the arrival of the printing press might also a↵ect directly political participation. For instance, the introduction of the printing press may have increased nationalism through the strengthening of a common language (Anderson, 1991).25 Moreover, newspaper
read-ership may have increased political participation, but the latter may also exhibit a persistent pattern.
Results We aim at determining whether there is a relationship between distance to a printing press and political participation.
Table 10 presents the results of the OLS regression of the di↵erent measures of political participation on distance to the printing press and the baseline and additional controls. Distance to the printing press only has a negative and statistically significant e↵ect on political participation (or local political activism) as measured by “Actions”. A one-standard deviation increase in distance to the printing press decreases “Actions”
19Each variable is described in a subsequent footnote. The description provides the question used
in the Afrobarometer to construct the variable. The variables are summarized in the online Appendix Table A.1.
20Understanding that some [Ghanaians/Kenyans/etc.] were not able to register as voters for the
[20xx] elections, which statement is true for you? You were registered to vote, You did not want to register, You could not find a place to register, You were prevented from registering, You were too young to register, Did not register for some other reason, Don’t Know/Can’t remember.
21With regard to the most recent, [20xx] national elections, which statement is true for you? You
voted in the elections, You decided not to vote, You could not find the polling station, You were prevented from voting, You did not have time to vote, Did not vote for some other reason, You were not registered, Don’t Know/Can’t remember.
22Here is a list of actions that people sometimes take as citizens. For each of these, please tell me
whether you, personally, have done any of these things during the past year. If not, would you do this if you had the chance: attend a community meeting; go together with others to raise an issue; attend a demonstration or protest march.
23Binary variable indicating that an individual both thinks that his country is a democracy and is
“fairly” or “very satisfied” with “the way democracy works”.
24Binary variable indicating whether respondent disagreed with the statement: “As far as politics
is concerned, friends and neighbors do not listen to you?”
25“If we consider the character of these newer nationalisms which, between 1820 and 1920, changed
the face of the Old World, two striking features mark them o↵ from their ancestors. First, in almost all of them “national print-languages” were of central ideological and political importance.” (p.67) Similarly, Eisenstein (1980) argues that “it is not accident that nationalism and mass literacy have developed together. The two processes have been linked ever since Europeans ceased to speak the same language when citing their Scriptures or saying their prayers” (p.165).


![[PDF] Apprendre J2EE documentation de cours | Formation informatique](data:image/gif;base64,R0lGODlhAQABAIAAAP///wAAACH5BAEAAAAALAAAAAABAAEAAAICRAEAOw==)