HAL Id: cea-01270927
https://hal-cea.archives-ouvertes.fr/cea-01270927
Submitted on 8 Feb 2016
HAL is a multi-disciplinary open access
archive for the deposit and dissemination of
sci-entific research documents, whether they are
pub-lished or not. The documents may come from
teaching and research institutions in France or
abroad, or from public or private research centers.
L’archive ouverte pluridisciplinaire HAL, est
destinée au dépôt et à la diffusion de documents
scientifiques de niveau recherche, publiés ou non,
émanant des établissements d’enseignement et de
recherche français ou étrangers, des laboratoires
publics ou privés.
Dust spectral energy distributions of nearby galaxies: an
insight from the Herschel Reference Survey
L. Ciesla, M. Boquien, A. Boselli, V. Buat, L. Cortese, G. J. Bendo, S. Heinis,
M. Galametz, S. Eales, M. W. L. Smith, et al.
To cite this version:
L. Ciesla, M. Boquien, A. Boselli, V. Buat, L. Cortese, et al.. Dust spectral energy distributions of
nearby galaxies: an insight from the Herschel Reference Survey. Astronomy and Astrophysics - A&A,
EDP Sciences, 2014, 565, pp.A128. �10.1051/0004-6361/201323248�. �cea-01270927�
A&A 565, A128 (2014) DOI:10.1051/0004-6361/201323248 c ESO 2014
Astronomy
&
Astrophysics
Dust spectral energy distributions of nearby galaxies: an insight
from the Herschel
?
Reference Survey
??
L. Ciesla
1,2, M. Boquien
2,3, A. Boselli
2, V. Buat
2, L. Cortese
4, G. J. Bendo
5, S. Heinis
6, M. Galametz
7, S. Eales
8,
M. W. L. Smith
8, M. Baes
9, S. Bianchi
10, I. de Looze
9, S. di Serego Alighieri
10, F. Galliano
11, T. M. Hughes
9,
S. C. Madden
11, D. Pierini
12, A. Rémy-Ruyer
11, L. Spinoglio
13, M. Vaccari
14, S. Viaene
9, and C. Vlahakis
151 University of Crete, Department of Physics, 71003 Heraklion, Greece
e-mail: ciesla@physics.uoc.gr
2 Aix-Marseille Université, CNRS, LAM (Laboratoire d’Astrophysique de Marseille) UMR 7326, 13388 Marseille, France 3 Institute of Astronomy, University of Cambridge, Madingley Road, Cambridge CB3 0HA, UK
4 Centre for Astrophysics & Supercomputing, Swinburne University of Technology, Mail H30 − PO Box 218, VIC 3122 Hawthorn,
Australia
5 UK ALMA Regional Centre Node, Jodrell Bank Centre for Astrophysics, School of Physics and Astronomy, University of
Manchester, Oxford Road, Manchester M13 9PL, UK
6 Department of Astronomy, University of Maryland, College Park MD 20742-2421, USA
7 European Southern Observatory, Karl Schwarzschild Str. 2, 85748 Garching bei München, Germany 8 School of Physics and Astronomy, Cardiff University, Queens Buildings The Parade, Cardiff CF24 3AA, UK 9 Sterrenkundig Observatorium, Universiteit Gent, Krijgslaan 281 S9, 9000 Gent, Belgium
10 INAF − Osservatorio Astrofisico di Arcetri, Largo Enrico Fermi 5, 50125 Firenze, Italy
11 CEA/DSM/IRFU/Service d’Astrophysique, CEA, Saclay, Orme des Merisiers, Bâtiment 709, 91191 Gif-sur-Yvette, France 12 Max-Planck-Institut für extraterrestrische Physik (MPE), Giessenbachstrasse, 85748 Garching, Germany
13 Istituto di Fisica dello Spazio Interplanetario, INAF, via Fosso del Cavaliere 100, 00133 Roma, Italy
14 Astrophysics Group, Physics Department, University of the Western Cape, Private Bag X17, 7535 Bellville, Cape Town,
South Africa
15 Joint ALMA Observatory/European Southern Observatory, Alonso de Córdova 3107, Casilla 19001 Vitacura, Santiago, Chile
Received 13 December 2013/ Accepted 13 February 2014
ABSTRACT
Although it accounts only for a small fraction of the baryonic mass, dust has a profound impact on the physical processes at play in galaxies. Thus, to understand the evolution of galaxies, it is essential not only to characterize dust properties per se, but also in relation to global galaxy properties. To do so, we derive the dust properties of galaxies in a volume limited, K-band selected sample, the Herschel Reference Survey (HRS).
We gather infrared photometric data from 8 µm to 500 µm from Spitzer, WISE, IRAS, and Herschel for all of the HRS galaxies. Draine & Li (2007, ApJ, 663, 866) models are fit to the data from which the stellar contribution has been carefully removed. We find that our photometric coverage is sufficient to constrain all of the parameters of the Draine & Li models and that a strong constraint on the 20−60 µm range is mandatory to estimate the relative contribution of the photo-dissociation regions to the infrared spectral energy distribution (SED). The SED models tend to systematically underestimate the observed 500 µm flux densities, especially for low-mass systems. We provide the output parameters for all of the galaxies, i.e., the minimum intensity of the interstellar radiation field, the fraction of polycyclic aromatic hydrocarbon (PAH), the relative contribution of PDR and evolved stellar population to the dust heating, the dust mass, and the infrared luminosity. For a subsample of gas-rich galaxies, we analyze the relations between these parameters and the main integrated properties of galaxies, such as stellar mass, star formation rate, infrared luminosity, metallicity, Hα and H-band surface brightness, and the far-ultraviolet attenuation. A good correlation between the fraction of PAH and the metallicity is found, implying a weakening of the PAH emission in galaxies with low metallicities and, thus, low stellar masses. The intensity of the diffuse interstellar radiation field and the H-band and Hα surface brightnesses are correlated, suggesting that the diffuse dust component is heated by both the young stars in star-forming regions and the diffuse evolved population.
We use these results to provide a new set of infrared templates calibrated with Herschel observations on nearby galaxies and a mean SED template to provide the z= 0 reference for cosmological studies. For the same purpose, we place our sample on the S FR−M∗
diagram. The templates are compared to the most popular infrared SED libraries, enlightening a large discrepancy between all of them in the 20−100 µm range.
Key words.galaxies: ISM – infrared: galaxies – dust, extinction
? Herschel is an ESA space observatory with science instruments
provided by European-led Principal Investigator consortia and with im-portant participation from NASA.
??
Table 4 and appendices are available in electronic form at
http://www.aanda.org
1. Introduction
In the interstellar medium (ISM), dust holds a major role: a) it acts as a catalyst in the transformation of atomic hydrogen into molecular hydrogen from which stars form (Wolfire et al. 1995);
b) it allows gas to cool and condense to form new stars by absorbing the ultraviolet (UV) emission of surrounding young stars (Draine 1978;Dwek 1986; Hollenbach & Tielens 1997); and c) it reemits the absorbed energy in the infrared domain (IR), where the thermal emission by dust grains dominates the spectral energy distribution (SED) of galaxies between ≈10 and 1000 µm. Dust is thus an important tracer of star forma-tion activity. Formed by the aggregaforma-tion of metals injected into the ISM by stars through stellar winds and supernovae explo-sions, its composition still remains uncertain. The most popular models assume that dust consists of a mixture of silicate and graphite grains (Mathis et al. 1977; Draine & Lee 1984; Kim et al. 1994), and are extended by adding the contribution of the polycyclic aromatic hydrocarbons (PAH), producing the broad spectral features seen in the mid-IR (MIR), such as in mod-els by Siebenmorgen & Kruegel (1992),Li & Draine (2001),
Weingartner & Draine(2001), andDraine & Li(2007).
Because of the important role of dust in the ISM and its tight link with the other components of galaxies, the study of dust emission is mandatory to have a better understanding of all of the processes at play. IRAS (Infrared Astronomical Satellite,
Neugebauer et al. 1984), COBE (Cosmic Background Explorer, 1989), ISO (Infrared Space Observatory, Kessler et al. 1996), Spitzer(Werner et al. 2004), and AKARI (Murakami 2008) al-lowed us to study dust emission up to 240 µm. While these telescopes sampled well the dust properties from the MIR to around the peak of the dust SED, going to longer submil-limeter (submm) wavelengths, well beyond the peak, is cru-cial for modeling the distribution of the dust size, temperature, and composition. In this way, the inventory of the bulk of the dust mass in galaxies, manifested in the submm, is also not missed (Devereux & Young 1990;Gordon et al. 2010). Ground-based facilities, such as SCUBA (Submillimeter Common-User Bolometer Array,Holland et al. 1999), provide us with submm data, but observations of large samples of normal galaxies are still prohibitive due to the long integration times needed for these instruments, which suffer from limited sensitivity.. Furthermore, a large part of the far-IR (FIR) and submm domains are not accessible from the ground. The Herschel Space Observatory (Pilbratt et al. 2010) opened a new window on the FIR/submm spectral domain (55 to 672 µm), allowing us to probe the cold dust component in a large number of nearby objects.
We now have a global view of the emission from all of thermal dust components, covering a broad range of temper-atures and the different heating mechanisms for these compo-nents. Before Herschel, it was already evident that a significant part of the IR SEDs of galaxies potentially includes cold (17 to 20 K) diffuse cirrus components heated by the diffuse interstellar radiation field from the total stellar population, and not just the light from star forming regions (e.g.,Helou 1986;Xu & Helou 1996;Li & Draine 2002;Boselli et al. 2004;Komugi et al. 2011;
Totani et al. 2011). However, the emission for these colder com-ponents often appears intermixed with emission from warmer dust heated by star forming regions at λ lower than ≈240 µm, and in many cases, the emission is poorly constrained. Multiple authors using Herschel, including Bendo et al. (2010,2012b),
Boquien et al. (2011), Groves et al. (2012), and Smith et al.
(2012b), have used comparisons of FIR colors to NIR emission from the evolved stellar population to demonstrate that the cirrus component is often the primary source of >250 µm emission and also contributes at shorter wavelengths.
Understanding the heating processes of the dust is of paramount importance to provide physical models than can reproduce the FIR/submm SED of galaxies. Multiwavelength
radiative transfer modeling of galaxies is a powerful tool to an-alyze the properties of dust in galaxies in a self-consistent way (e.g.,Xilouris et al. 1999;Popescu et al. 2000,2011;de Looze et al. 2012b;Alton et al. 2004;Bianchi 2008;Baes et al. 2010;
MacLachlan et al. 2011;de Looze et al. 2012a). However, as-sumptions regarding the geometry of the dust need to be made, and these codes require large computational resources, espe-cially for a large sample of galaxies. Therefore, models, as well as empirical templates, are widely used to extract information about galaxies from their IR SED (Chary & Elbaz 2001; Dale & Helou 2002; Boselli et al. 2003a;Draine & Li 2007, here-after CE01, DH02, B03, and DL07). The pre-Herschel empir-ical libraries of templates (CE01, DH02) were calibrated on FIR observations and detections of galaxies up to ≈200 µm, and were constructed from local normal and IR luminous star form-ing galaxies. Recent studies, makform-ing use of the new Herschel data, provided new IR templates for low- and high-redshift objects (Elbaz et al. 2011; Smith et al. 2012a; Magdis et al. 2012). However, there is a lack of templates representative of the broad variety of nearby normal galaxies, reference of the z= 0 Universe.
The Herschel Reference Survey (HRS,Boselli et al. 2010b) is composed of 322 nearby galaxies spanning the entire range of morphological types and environment. The aim of this volume-limited, K-band selected sample is to investigate the dust proper-ties of galaxies for which a wealth of ancillary data are available, both photometric (from UV to radio,Bendo et al. 2012a;Boselli et al. 2010b,2011;Ciesla et al. 2012;Cortese et al. 2012b, 2014) as well as spectroscopic (Boselli et al. 2013,2014;Hughes et al. 2013). With this set of data, the HRS is one of the best samples to study the dust properties of nearby galaxies versus parameters such as the stellar mass, the metallicity, the star formation rate (SFR), etc., giving us a better understanding of its role in the ISM and the interplay with the stellar radiation field.
In this work, we derive the physical properties of the dust by fitting the integrated IR SED of the HRS galaxies with the mod-els of DL07. Although these modmod-els are physical, they have been mainly tested on FIR data (Draine et al. 2007), and recently, us-ing Herschel data (Dale et al. 2012;Aniano et al. 2012;Draine et al. 2014). We thus discuss the ability of these models to repro-duce the submm observations of our galaxies. For a subsample of gas-rich galaxies, we then investigate the relations between the derived output parameters and the integrated galaxy prop-erties (stellar mass, SFR, birthrate parameter, metallicity, FUV attenuation, Hα surface brightness, and H-band effective surface brightness). Based on this analysis, we derive a set of SED tem-plates, binned according to those parameters that better charac-terize the shapes of the SED, and compare them with libraries available in the literature.
This paper is organized as follows: in Sect.2, we describe the HRS and define a gas-rich subsample on which we will focus our analysis. The ancillary data associated with this subsample are presented in Sect.3. We present the procedure used to per-form the fitting, analyze our ability to constrain the models with the data and present the results in Sect.4. For the gas-rich galaxy subsample, we outline the most interesting relations between the output from the fitting and galaxy parameters in Sect. 5. The derivation and discussion of the new IR library is presented in Sect.6. In AppendixA, we present the MIR photometry of all of the HRS galaxies at 8, 12, and 22 µm, which are important constraints for the SED modeling. In AppendixB, we explain the method derived to remove the stellar contribution from our data and provide new coefficients useful for future works. For completeness, in Appendix C, we give the output parameters
from the SED fitting for the galaxies that are not discussed in the main part of this work (early-type galaxies and H
-deficient galaxies). Finally, all of the relations between the output of DL07 models and the properties of the gas-rich sample are presented and discussed in AppendixD.2. Sample
The HRS galaxies are selected according to three criteria fully described in Boselli et al.(2010b). The HRS is a volume lim-ited sample composed of galaxies lying at a distance between 15 and 25 Mpc. The galaxies are then selected according to their K-band magnitude, the luminosity of which is a proxy for the total stellar mass (Gavazzi et al. 1996). Based on optical extinc-tion studies and FIR observaextinc-tions at wavelengths shorter than 200 µm, we expect late-type galaxies to have a larger content of dust than early-types (Sauvage & Thuan 1994). Thus, two di ffer-ent Kmaglimits have been adopted: Kmag≤ 12 for late-types and
Kmag≤ 8.7 for early-types (in Vega magnitudes). Finally, to limit
the contamination from Galactic cirrus, galaxies are selected at high Galactic latitude (b >+55 deg) and in low Galactic extinc-tion regions (AB < 0.2,Schlegel et al. 1998). The final sample
contains 3221galaxies, among which are 62 early-types and 260
late-types. The HRS covers all morphological types and contains field galaxies as well as objects in high-density regions such as the Virgo cluster. We use the morphological classification pre-sented inCortese et al.(2012a).
Even if we present the NIR photometry and perform the SED fitting of all of the HRS galaxies, the paper focuses on the study of a subsample of 146 gas-rich galaxies. From the whole HRS sample, we remove early-type galaxies (E-S0-S0/Sa) from the analysis as the dust properties and the dust heating sources of el-liptical and lenticular galaxies are different from late-type galax-ies (e.g., Boselli et al. 2010a;Smith et al. 2012b). Indeed, the relative contribution of X-ray heating, stochastic heating, heat-ing from fast electrons in the hot gas, and the size-distribution of dust grains in these environments with low-density ISM might differ from that of late-types and thus need further investiga-tion (Wolfire et al. 1995). Furthermore, only 32% of the ellipti-cal galaxies and 60% of the lenticulars are detected at 250 µm (Ciesla et al. 2012), yielding an incomplete photometric cov-erage of the IR-submm domain. Finally, some of the physical properties used in this work (birthrate parameter, Hα surface brightness, and metallicity) are not available for all of the early-type galaxies. Furthermore, a number of late-early-type galaxies of the HRS lie in the very dense environment of the Virgo clus-ter. These galaxies have their gas content stripped by the envi-ronment (Boselli & Gavazzi 2006). Herschel observations have recently shown that the dust component of H
-deficient2galax-ies is also affected by the cluster environment (Cortese et al. 2010,2012b). In the following, we define as “gas-rich” galax-ies those with H
−def ≤ 0.4, and “H
-deficient” those with H
−def > 0.4, to be consistent withBoselli et al. (2012). We decide to not consider H
-deficient galaxies in our analysis to remove the effects of the environment as a free parameter that could bias the interpretation of the results. The study of theef-1 With respect to the original sample given inBoselli et al.(2010b),
the galaxy HRS 228 is removed from the complete sample because its updated redshift on NED indicates it as a background object.
2 The H
-deficiency, H
–def, is defined as the difference, inlogarith-mic scale, between the HI mass expected from an isolated galaxy with the same morphological type and optical diameter and the observed HI mass (Haynes et al. 1984).
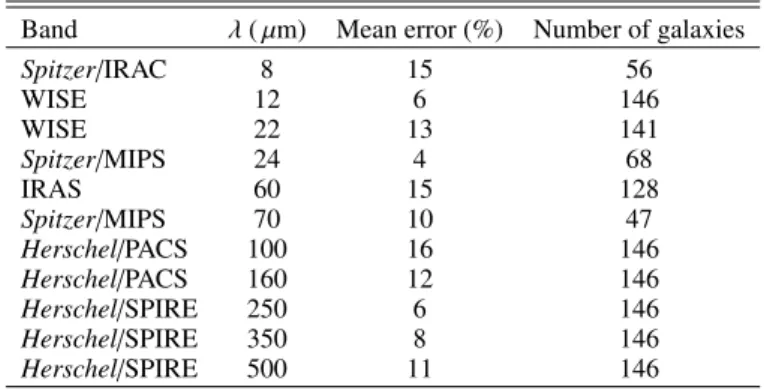
Table 1. Completeness of the photometric coverage of the 146 gas-rich galaxies.
Band λ ( µm) Mean error (%) Number of galaxies
Spitzer/IRAC 8 15 56 WISE 12 6 146 WISE 22 13 141 Spitzer/MIPS 24 4 68 IRAS 60 15 128 Spitzer/MIPS 70 10 47 Herschel/PACS 100 16 146 Herschel/PACS 160 12 146 Herschel/SPIRE 250 6 146 Herschel/SPIRE 350 8 146 Herschel/SPIRE 500 11 146
Notes. Only detections are considered.
fect of the environment on the dust properties of galaxies will be presented in a future work.
The main part of this paper is focused on the data, the SED fitting, and the analysis of the gas-rich late-type sample. The NIR photometry of all of the HRS galaxies, and the output parame-ters from the SED fitting obtained for the early-type galaxies and the H
-deficient galaxies are presented in AppendixAand AppendixC, respectively.3. Data
In order to compute the IR SEDs of the HRS galaxies, we use data from 8 to 500 µm performing the photometry on Spitzer/IRAC and WISE images and using measurements available in the literature from Spitzer/MIPS, Herschel/PACS, Herschel/SPIRE, and IRAS. These data are publicly available through the Hedam database3.
3.1. Mid-infrared: Spitzer/IRAC and WISE
For the purpose of this work, we perform the photometry of 56 out of the 146 galaxies of our subsample for which obser-vations at 8 µm from Spitzer/IRAC were available in the Spitzer archive. The procedure is presented in AppendixAand the flux densities and associated errors are given in TableA.2. Our proce-dure to estimate the errors associated with the 8 µm data, based onBoselli et al. (2003a), results in a mean error of 15% (see Table 1). We also perform the WISE photometry of the gas-rich galaxies at 12 and 22 µm. As for the IRAC 8 um data, AppendixAdescribes the procedure we used, and gives the re-sulting flux densities and their associated errors. The mean errors associated with the 12 µm and the 22 µm flux densities are 6% and 13%, respectively. Comparisons between our measurements and results from the literature, as presented in AppendixA, are in good agreement. The IRAS 12 µm flux densities are avail-able only for 15% of our galaxies, whereas all of our subsample galaxies have a 12 µm flux density from WISE. To have a homo-geneous set of data, we use the WISE 12 µm flux densities. 3.2. Far-infrared: Spitzer/MIPS, IRAS, and Herschel/PACS The reduction and photometry of MIPS data are fully described inBendo et al.(2012a). Flux densities of 68 gas-rich galaxies are available at 24 µm, and 47 are available at 70 µm. For most of the
galaxies, aperture photometry was performed using an elliptical region with major and minor axes of 1.5 times the axis sizes of the D25 isophotes given byde Vaucouleurs et al.(1991). The
same aperture was used in the two bands. In the case of HRS 20-NGC 3395 and its companion 20-NGC 3396, the flux densities pro-vided correspond to one of the pair as it is hard to disentangle the emission from the two galaxies within a pair. Thus, we do not use these measurements. The error calculation takes into account the calibration error, 4 and 10% at 24 and 70 µm (Engelbracht et al. 2007;Gordon et al. 2007), respectively, the uncertainty based on the error map, and the background noise. The three are added in quadrature. We should note that a transcription error was made inBendo et al.(2012b) for the flux density of HRS 142. Its flux density at 70 µm is 8200 mJy instead of 1237 mJy. Despite the incompleteness of the MIPS 24 µm data, we choose to use them, when available, instead of the WISE 22 µm. This choice is due to the poor quality of some WISE 22 µm images resulting in a mean error of 13% in this band when the mean error of MIPS 24 µm is 4% only. The IRAS 25 µm data are also available for only a small part of our subsample (15%), we thus decided to not use these measurements to keep a homogeneous set of data from one galaxy to another.
Because of the incompleteness at 70 µm, we also use, when available, the 60 µm measurements from IRAS presented in Boselli et al. (2010b). The IRAS 60 µm flux densities of 128 galaxies of the subsample, with a typical uncertainty of 15%, are provided by multiple references in the literature and col-lected on NED:Sanders et al.(2003);Moshir & et al. (1990);
Thuan & Sauvage (1992); Soifer et al. (1989); Young et al.
(1996).
All of the gas-rich galaxies are detected by PACS at 100 and 160 µm, respectively (Cortese et al. 2014). They performed aperture photometry following the method used byCiesla et al.
(2012) to build the HRS SPIRE catalog (see Sect.3.3). The aper-tures used to extract the fluxes are identical to those used for the SPIRE photometry. However, a refinement of the photomet-ric aperture has been applied to some of the objects for various reasons (some galaxies were unresolved in SPIRE bands and re-solved in PACS bands, some PACS maps were too small to en-compass the SPIRE aperture, or the FIR emission of the galaxy was much less extended than the SPIRE aperture). Errors were estimated following the method described in Roussel (2013). The mean errors are 16% and 12% at 100 and 160 µm, respec-tively. The data reduction and the integrated photometry are de-scribed in Cortese et al. (2014).
3.3. Submillimetre: Herschel/SPIRE
In the SPIRE bands, all of the galaxies of the subsample are detected at 250, 350, and 500 µm, respectively. The SPIRE pho-tometry is fully described in Ciesla et al.(2012). In summary, aperture photometry was performed in elliptical regions for ex-tended galaxies. All apertures have been chosen to encompass the emission and to minimize the contamination of background sources. The stochastic error takes into account the instrumen-tal uncertainty, the confusion uncertainty (due to the presence of faint background sources), and the background uncertainty (due to large scale structure, such as cirrus), with all three added in quadrature. Flux densities of point-like sources have been mea-sured using PSF fitting on timeline data (Bendo et al. 2013). We take the last updates into account by applying the cali-bration corrections (1.0253, 1.0250, and 1.0125 at 250, 350,
and 500 µm, respectively) and the new beam areas4 of 450, 795 and 1665 arcsec2at 250, 350, and 500 µm, respectively. We do
not take the variations of the beam sizes into account, depending on the shape of the SED, as they are generally within the SPIRE errors. The result of these updates lowers the flux densities pre-sented inCiesla et al.(2012) by ≈5%. The mean errors are 6%, 8% and 11% at 250, 350, and 500 µm, respectively.
The photometric completeness of the gas-rich sample of galaxies is presented in Table1. Upper limits are not taken into account in our fitting procedure and will thus correspond to an absence of data in Table1.
4. SED fitting with the Draine & Li (2007) models 4.1. Draine & Li (2007) models
DL07 modeled the dust with a mixture of astronomical amor-phous silicate and carbonaceous grains with the size distribu-tion observed in the Milky Way (Weingartner & Draine 2001). Models of the LMC and SMC grain size distribution are also available.
The bulk of the dust present in the diffuse ISM is heated by a large number of stars responsible for the diffuse radiation. However, another part of the dust is located in regions close to very luminous O and B stars, in photodissociation regions (PDR). In PDRs, the light coming from the young stars is heat-ing the dust and is much more intense than the emission comheat-ing from the old stars responsible for the diffuse radiation. In DL07 models, the relative dust mass fraction heated by each source, the diffuse component and the PDRs, is given by the γ parame-ter. Thus, the fraction (1 − γ) of the total dust mass is heated by U = Umin, where U is the intensity of the interstellar radiation
field (ISRF) and Umin is the intensity of the diffuse ISRF, both
normalized to the intensity of the Milky Way ISRF.
Recently,Aniano et al.(2012) linked the temperature of the cold dust component to the Uminparameter by approximating the
DL07 SED with a blackbody multiplied by a power-law opac-ity and obtained Td ≈ 20 Umin0.15 K. The fraction γ of the total
dust mass is exposed to a range of stellar intensities following a power-law distribution from Uminto Umaxwith dM/dU ∝ U−2.
From these three parameters, we can compute hUi, the mean in-tensity of the ISRF, from Eq. (17) ofDraine et al.(2007). A last parameter aims at characterizing the emission due to the PAH. Their abundance is quantified with the parameter qPAH, which
corresponds to the fraction of the total grain mass contributed by PAH containing less than 103C atoms. Each model depends
on the set of parameters {dustcomposition, qPAH, γ, Umin, and
Umax}. Finally, the dust mass is also a free parameter
deter-mined from the normalization of the model to the observations. Following the recommendations ofDraine et al.(2007), we use only the Milky Way dust type and fix Umax= 106. Thus, the free
parameters of the fit are qPAH, γ, and Umin. The normalization of
the model to the data provides us with the dust mass Mdust, and
the integration of the model between 8 and 1000 µm gives us the infrared luminosity LIR.
4.2. Fitting procedure
As DL07 model the emission of the dust from 1 µm to 1 cm, we need to remove the stellar emission that contributes to the MIR data to have only the emission from the dust. In AppendixB, we
4 See http://herschel.esac.esa.int/twiki/bin/view/
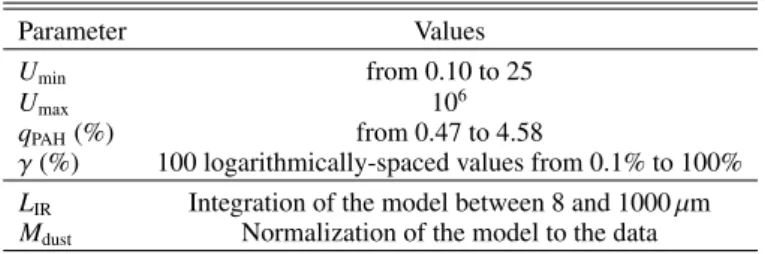
Table 2. Ranges of parameter used in our fitting procedure.
Parameter Values
Umin from 0.10 to 25
Umax 106
qPAH(%) from 0.47 to 4.58
γ (%) 100 logarithmically-spaced values from 0.1% to 100% LIR Integration of the model between 8 and 1000 µm
Mdust Normalization of the model to the data
describe the method we use to remove the stellar contribution and provide morphological type dependent coefficients normal-ized to several NIR bands, and determined using the CIGALE5
code (Code Investigating GALaxy Emission,Noll et al. 2009). The code computes modeled galaxy SEDs by using stellar popu-lation models fromMaraston(2005), which are convolved with a given star formation history (SFH). We use an exponentially decreasing SFH, which we present in Appendix B. The coe ffi-cients (Sν,stellar/Sν) applied to the MIR photometry of the sam-ple are 0.093, 0.075, 0.016, and 0.017 at 8, 12, 22, and 24 µm, respectively (see AppendixB).
The DL07 models are integrated into the filters of the cor-responding photometric bands, and these modeled flux densi-ties are compared to the observations. The ranges allowed for each parameter are presented in Table2. For galaxies that do not have any MIPS 24 µm observations, the fit is performed using the WISE 22 µm flux densities as explained in Sect.3.2.
We use a χ2 minimization method to fit our data with the models of DL07. For each galaxy, we compute the χ2
corre-sponding to every model using the equation: χ2(a 1, ..., ai, ..., aN)= M X i= 1 "y i−αy(xi, a1, ..., ai, ..., aN) σi #2 , (1) and the reduced χ2as:
χ2 red=
χ2
M − N (2)
where y is the model, aiare the parameters values of this model,
xi correspond to the observations, and σi the errors attributed
to these observations. The number of parameters is N and M the number of observed data. We obtain the normalization factor through the following equation:
α = PN i= 1yi×y(xi, a1, ..., ai, ..., aM)/σ2i PN i= 1y(xi, a1, ..., ai, ..., aM)2/σ2i · (3) As the reduced χ2(χ2
red) is calculated for each value of a
param-eter, we can build the probability distribution function (PDF) of this parameter. For each value of a discrete parameter, we select the corresponding minimum χ2red. Thus, we have the distribution of the minimum χ2redassociated with the set of values of the pa-rameter. From this distribution, we obtain the estimated value of the parameter, as the mean value of this distribution, and the as-sociated error as its standard deviation, proceeding as described inNoll et al.(2009). For parameters with a large range of val-ues, we compute bins and take the minimum χ2redcorresponding to each bin. Then we build the distribution. In the following dis-cussions, we will refer to the “best” parameter as the parameter obtained directly from the model providing the minimum χ2
red, 5 http://cigale.lam.fr/
and to the “estimated” parameter as the parameter derived from the distribution of χ2
red.
This SED fitting procedure is applied to all of the galaxies of the HRS. However, from now on, this work only focuses on the gas-rich galaxy subsample, and the results for the other galax-ies (early-type, and late-type deficient galaxgalax-ies) are presented in AppendixC.
4.3. Mock catalogs
The χ2fitting described in the previous section provides us with a best-fit model for each galaxy. However, we need to know if the output parameters obtained from these models are reliable, i.e., if the data we have allow us to constrain these parameters. To do so, we create mock catalogs following the procedure outlined inGiovannoli et al.(2011). We first run our χ2procedure on our
sample to obtain the best-fitting model and the corresponding pa-rameters for each galaxy. The resulting best SEDs are integrated in the filters adding an error randomly distributed according to a Gaussian curve. The σ of the Gaussian curve is chosen to be the median value of the error for each band. We now have a mock catalog in which the exact values of the parameters are known. As a final step, we run our fitting procedure on this mock cat-alog and compare the input “best” values of the parameters to the output “estimated” values. This test allows us to evaluate the ability to constrain a parameter with the photometric coverage available for our galaxies.
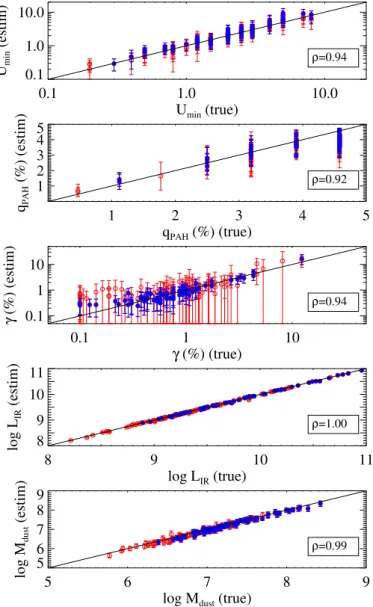
We note that some galaxies of our sample are lacking 8 µm, 22−24 or 60−70 µm measurements. To estimate the impact of the lack of data on the estimation of the parameters, we build several mock catalogs using different combinations of bands to understand the importance of every photometric band. Indeed, all of the galaxies in our sample were not observed in every band. To understand the effect of the inhomogeneity of the photomet-ric coverage of our sample and to evaluate the impact of submm data on constraining the models, we also build a mock catalog omitting SPIRE data. We present the results from the mock cat-alogs for Umin, γ, qPAH, log LIR, and log Mdust in Fig. 1and in
Fig.2. For each parameter, we show the case where the photo-metric coverage is complete (Fig.1), where there is no 8 µm flux density, in the absence of 22−24 µm data, the case where there are no 60−70 µm data and, finally, in the absence of SPIRE data (Fig.2). For each panel of Figs.1 and2, we provide the best linear fit, the Spearman correlation coefficient and the median value and standard deviation of the estimated to true value ratio in Table3. We separate galaxies having a 24 µm measurement from Spitzer/MIPS (blue filled points) from galaxies having a 22 µm measurement from WISE (red empty points). This sepa-ration allows us to see the impact of the precision of the photom-etry on the determination of the parameters, especially for γ, as we will discuss.
A complete photometric coverage from 12 to 500 µm is su ffi-cient to constrain the Uminparameter, with a mean ratio between
the estimated value to the true one of 1.07 ± 0.20 (Table3). The absence of 8 µm measurement does not affect the estimation of Umin. The lack of data at 22−24 µm yields an underestimation
of the parameter Uminof ≈14%, whereas the lack of 60−70 µm
yields an overestimation of 18%. The worst case is when no SPIRE data is available with an overestimation of 25%, show-ing the importance of submm data to properly constrain Umin.
Indeed, as the Uminparameter directly probes the position of the
IR peak, constraints from both parts of the peak are needed for a good estimate.
0.1 1.0 10.0 Umin (true) 0.1 1.0 10.0 Umin (estim) ρ=0.94 1 2 3 4 5 qPAH (%) (true) 1 2 3 4 5 qPAH (%) (estim) ρ=0.92 0.1 1 10 γ (%) (true) 0.1 1 10 γ (%) (estim) ρ=0.94 8 9 10 11 log LIR (true) 8 9 10 11 log L IR (estim) ρ=1.00 5 6 7 8 9
log Mdust (true) 5 6 7 8 9 log M dust (estim) ρ=0.99
Fig. 1.Comparison between the true values of the parameters, from top to bottom: Umin, qPAH, γ, log LIR, log Mdust, and the mock catalogs
pa-rameters values estimated from the PDF. Blue filled dots correspond to galaxies having a 24 µm measurement and red empty dots are galax-ies with a 22 µm measurement. The solid black line is the 1:1 relation-ship. The DL07 parameters are constrained, but γ needs the 24 µm from MIPS to be properly estimated.
Considering the γ parameter, the median ratio between the estimated and true values of the parameters is 1.18. However, this median drops to 1.01 when values of γ are larger than 0.5%. With our photometric coverage, we tend to overestimate the low values of γ. The importance of the 22 and 24 µm measurements and the associated errors is clear. When all bands are available, the precision of the MIPS 24 photometry provides good con-straints on the estimate of γ, especially for values above a few percent. With a mean error of 13% on the WISE 22 photometry, there is a good correlation for values of γ above a few percent, but the errors on the estimated parameters are very large, indi-cating a large PDF linked to the estimation of γ. The impact of this 22−24 µm range is confirmed in the panel where these two bands are removed, the median value of the estimated to true values ratio is 3.77 ± 6.43, and the relation is flat. When the 22−24 µm bands are removed, the estimated gamma derived from the model is rather constant in whatever galaxy we model. The absence of 60−70 µm or SPIRE data does not have a large
impact on the estimation of γ, but yields to a slightly more dis-persed relation.
The 8 µm band directly probes the PAH emission: in the absence of the IRAC 8 band, the Spearman correlation coe ffi-cient between the estimated qPAH and the true qPAH decreases
from 0.92 to 0.88 and the standard deviation of the estimated to true values ratio increases from 0.11 to 0.20. Interestingly, the absence of 22−24 µm data provides a median underestimation of the parameter of 23%, showing the importance of constrain-ing the continuum to estimate the qPAHparameter with our
pho-tometric coverage. From Fig.1, we conclude that the presence of the 12−22−24 µm data is sufficient to have a relatively good constraint on the fraction of PAH, qPAH, provided by the DL07
models. For our sample of galaxies, the 8 µm measurement is thus not mandatory to study qPAH.
The LIR and the Mdust are well constrained in all
configu-rations. Even without the SPIRE bands, the Mdust is well
con-strained despite a slightly larger scatter. This constraint on Mdust
comes from the fact that β is fixed in DL07 (to ≈2.06) and, as this parameter is provided by the normalization of the models to the observed data, observations at 160 µm seem to be sufficient to constrain Mdust.
All the parameters are constrained with the combination of IR bands available for this study, except γ for which MIPS 24 µm measurement is mandatory. Therefore, the discussion of γ and hUi (as hUi depends on γ) will be restricted to the galax-ies having a 24 µm flux density. However, we note that this analysis from mocks allows us only to characterize our abil-ity to constrain the parameters of DL07 given our photometric coverage.
4.4. Results of the fits
Table4presents the results of the fit for the 146 galaxies: the output parameters from DL07 models, LIRand Mdust.
4.4.1. Assessment of the quality of the fit
To have a global look at the quality of the fits, we show in Fig.3
the ratio between the observed and the modeled flux densities for each photometric band versus the stellar mass (the calcula-tion of M∗is described in Sect.5), as the HRS was selected in
K-band, which is a proxy for stellar mass. For each galaxy, the values predicted by the models are obtained by integrating the best SEDs resulting from the fits into the filters of every band. Points are color coded according to the χ2redvalue associated with the fit.
The analysis of Fig.3shows that:
– Fits of galaxies with log(M∗/M ) < 10 have a better χ2redthan
higher mass systems for which χ2
redcan reach up to 20.
– At 8 µm, the models seem to systematically overpredict the observed flux density by ≈7% from low- to high-mass systems.
– At 12 µm, there is good agreement between both observed and modeled flux densities up to log(M∗/M ) ≈ 10. For
higher mass galaxies, the models underpredict the observed flux densities.
– There is a systematic overestimation of the 22−24 µm by the models of 10% at 22 µm and 5% at 24 µm. For the MIPS 24 µm, this overestimation increases with the stellar mass and can reach up to 20%. Despite this trend, with a mean ratio of 0.95 and a small dispersion 0.05, there is a good
0.1 1.0 10.0 Umin (true) 0.1 1.0 10.0 Umin (estim) ρ=0.94 no 8µm 0.1 1.0 10.0 Umin (true) ρ=0.91 no 22-24µm 0.1 1.0 10.0 Umin (true) ρ=0.92 no 60-70µm 0.1 1.0 10.0 Umin (true) ρ=0.87 no SPIRE 1 2 3 4 5 qPAH (%) (true) 1 2 3 4 5 qPAH (%) (estim) ρ=0.88 no 8µm 1 2 3 4 5 qPAH (%) (true) ρ=0.79 no 22-24µm 1 2 3 4 5 qPAH (%) (true) ρ=0.89 no 60-70µm 1 2 3 4 5 qPAH (%) (true) ρ=0.92 no SPIRE 0.1 1 10 γ (%) (true) 0.1 1 10 γ (%) (estim) ρ=0.94 no 8µm 0.1 1 10 γ (%) (true) ρ=0.74 no 22-24µm 0.1 1 10 γ (%) (true) ρ=0.94 no 60-70µm 0.1 1 10 γ (%) (true) ρ=0.93 no SPIRE 8 9 10 log LIR (true) 8 9 10 11 log L IR (estim) ρ=1.00 no 8µm 8 9 10 log LIR (true) ρ=1.00 no 22-24µm 8 9 10 log LIR (true) ρ=1.00 no 60-70µm 8 9 10 log LIR (true) ρ=1.00 no SPIRE 5 6 7 8
log Mdust (true)
5 6 7 8 9 log M dust (estim) ρ=0.99 no 8µm 5 6 7 8
log Mdust (true)
ρ=0.99
no 22-24µm
5 6 7 8
log Mdust (true)
ρ=0.99
no 60-70µm
5 6 7 8 9
log Mdust (true)
ρ=0.98
no SPIRE
Fig. 2. Comparison between the true values of the parameters (from top to bottom) Umin, qPAH, γ, log LIR, log Mdust, and the mock catalogs
parameters values estimated from the PDF. The different panels correspond to different observed band combinations. For each parameter and from left to right: all bands but the 8 µm, all bands but the 22 and 24 µm, all bands but the 60 and 70 µm, and all bands but SPIRE. Blue filled dots correspond to galaxies having a 24 µm measurement and red empty dots are galaxies with a 22 µm measurement. The solid black line is the 1:1 relationship. DL07 parameters are constrained, but γ needs the 24 µm from MIPS to be properly estimated.
agreement between the models and the observations at this wavelength.
– The 60 µm ratio is very dispersed, and the mean value of 0.96 is not representative as there is a clear trend with the stellar mass. Models underpredict the 60 µm observations of low-mass systems and overpredict them for high-low-mass objects. However, the mean photometric error of 15% is one of the largest of all bands and is not a strong constraint for the fit. The 70 µm observed to modeled flux density ratios follow the same trend with the stellar mass than the 60 µm, but with a smaller dispersion (σ= 0.18).
– At 100 and 160 µm, despite a large dispersion, there is a rel-atively good agreement between observations and models with a slight overprediction at 100 µm and underprediction at 160 µm of ≈3%.
– The 250 and 350 µm SPIRE bands are in average well fitted by the models, even if the 250 µm is slightly overestimated for the whole sample. A small trend is seen at 350 µm, the flux densities from the models tend to be lower than the ob-servations for low-mass galaxies.
– At 500 µm, this trend becomes stronger. The 500 µm ob-servations seem to be underpredicted by the models, es-pecially for low-mass systems. Indeed, for galaxies with log(M∗/M ) ≈ 10, there is a clear underprediction of the
500 µm data, up to ≈40%, that increases when the stellar mass decreases.
A submm excess, such as the one observed at 500 µm, was already noticed by previous works in low-metallicity systems (e.g.,Reach et al. 1995;Galliano et al. 2003,2005,2011;Bot et al. 2010;Gordon et al. 2010;Boselli et al. 2010b;Galametz et al. 2011; Boselli et al. 2012). Different hypotheses have been proposed to explain this excess. A very cold dust com-ponent was proposed byGalliano et al.(2003,2005), showing that it would need to lie in a small number of dense parsec scale clumps, butGalliano et al. (2011) showed that this hy-pothesis was not verified in the LMC, where they had the spa-tial resolution to test it. Meny et al.(2007) proposed a solid-state-based, temperature-dependent emissivity increases at long wavelength, in amorphous materials. Finally,Draine & Hensley
(2012) argued that this excess could be due to ferromagnetic free-flying small grains or ferromagnetic inclusions in normal grains. Changing the FIR β slope can make the excess diminish but it is not sufficient (Galliano et al. 2011).Boselli et al.(2012) noticed that a modified blackbody with an emissivity index of β = 1.5 better represents the SPIRE data of the HRS galax-ies than the DL07 models, which submm slope can be approxi-mated by β ≈ 2. However, they outlined that β = 2 is possible
Table 3. Statistics from the relations of the mock catalogs (Fig.1).
Parameter Bands Linear fit: A+ Bx Spearman coef. Stat of Xest/Xtrue
A B ρ median σ Umin all 0.03 1.07 0.94 1.07 0.20 no 8 µm 0.03 1.07 0.94 1.06 0.20 no 22−24 µm 0.08 0.81 0.91 0.86 0.19 no 60−70 µm 0.07 1.18 0.92 1.18 0.30 no SPIRE 0.21 1.15 0.87 1.24 0.34 γ all 0.00 1.25 0.94 1.18 1.36 no 8 µm 0.00 1.17 0.94 1.19 1.43 no 22−24 µm 0.02 1.25 0.74 3.77 6.43 no 60−70 µm 0.00 1.14 0.94 1.23 1.36 no SPIRE 0.00 1.10 0.93 1.17 1.33 qPAH all 0.74 0.71 0.92 0.89 0.11 no 8 µm 1.00 0.61 0.88 0.85 0.20 no 22−24 µm 0.88 0.55 0.79 0.77 0.15 no 60−70 µm 1.01 0.63 0.89 0.89 0.17 no SPIRE 0.84 0.69 0.92 0.89 0.14 log LIR all 0.00 1.00 1.00 1.00 0.00 no 8 µm 0.01 1.00 1.00 1.00 0.00 no 22−24 µm −0.03 1.00 1.00 1.00 0.00 no 60−70 µm −0.09 1.01 1.00 1.00 0.00 no SPIRE −0.02 1.00 1.00 1.00 0.00
log Mdust all −0.03 1.00 0.99 0.99 0.01
no 8 µm −0.04 1.00 0.99 0.99 0.01
no 22−24 µm −0.05 1.01 1.01 1.00 0.01
no 60−70 µm 0.06 0.98 0.98 0.99 0.01
no SPIRE −0.14 1.01 1.01 0.99 0.02
Table 5. Statistics from the fitting of the 146 normal LTGs. Best fit from χ2
median σ min max
χ2 red 2.25 5.33 0.10 42.72 Umin 2.00 1.70 0.20 8.00 qPAH(%) 4.58 0.85 0.47 4.58 γ (%) 0.76 1.73 0.1 12.3 log(LIR/L ) 9.48 0.54 8.21 10.96 log(Mdust/M ) 7.07 0.50 5.77 8.42
Estimation from the PDF
median σ min max
Umin 1.96 ± 0.47 1.76 0.26 8.58
qPAH(%) 4.16 ± 0.42 0.76 1.22 4.58
γ (%) 0.75 ± 0.5 2.03 0.23 14.7 log(LIR/L ) 9.47 ± 0.03 0.53 8.24 10.94
log(Mdust/M ) 7.02 ± 0.08 0.48 5.77 8.38
for metal-rich high-mass galaxies, confirming what we observe in Fig. 3.Rémy-Ruyer et al. (2013) showed with a sample of galaxies with metallicities ranging from 0.03 to 1 Z that β
ob-tained from modified blackbody fit shows a large spread from 0.5 to 2.5.
These disagreements between the observations and the mod-els are difficult to interpret as they can have different origins. On the one hand, the way that errors in the photometry are com-puted determine the relative weights of the different bands, and thus play an important role in constraining the models, the case of the 22 and 24 µm being one illustration. On the other hand, the trend between the stellar mass and the χ2
redalso suggests that the
models do not reproduce the observations of high-mass galaxies very well, and the 500 µm observations of low-mass systems are not reproduced by the DL07 models.
4.4.2. Statistics of the output parameters
The statistics of the fits and of the derived parameters are pre-sented in Table5. The median χ2redis 2.25. The median estimated value of Uminis 1.96 ± 0.47. If we consider the relation obtained
byAniano et al.(2012), this median Umincorresponds to a
me-dian temperature of the dust of 22 K. We find a meme-dian estimated qPAH of 4.16 ± 0.42%. We obtain a median γ of 0.75 ± 0.5%
when considering only the 24 µm sample. Finally, this late-type nondeficient sample is characterized by a median log(LIR/L ) of
9.47 ± 0.03 and log(Mdust/M ) of 7.02 ± 0.08. We compare the
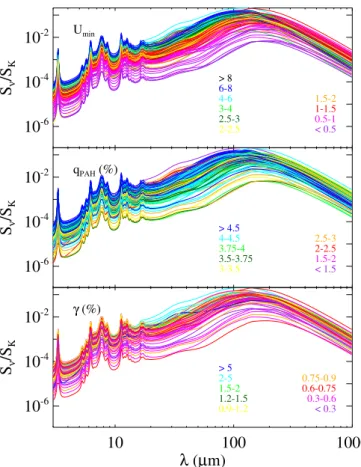
dust masses we derive with those obtained for the same galax-ies byCortese et al.(2012b), using only SPIRE bands, and find good agreement. The median ratio between the MdustofCortese et al.(2012b) and ours is 1.02, with a standard deviation of 0.02. The SEDs obtained from the minimum χ2red fit for each galaxy are shown in Figs.4and5. They are normalized to the observed 2MASS K-band flux densities as the galaxies of our sample were selected in this band (seeBoselli et al. 2010b, for a description of the K band flux densities). In each panel, we show the best-fitted SEDs, color-coded according to the estimated val-ues of the three output parameters from the models (Umin, qPAH
and γ), plus the LIRand the Mdustdirectly derived from the fits.
We notice a color gradient with Umin, indicating a relation
with the shape of the SED. By definition, Umincontrols the
mini-mum and dominant equilibrium dust temperature, therefore con-trolling the wavelength peak of the SED, as we can see on the top panel of Fig.4. The middle panel of Fig.4shows that qPAH
parameter impacts the shape of the SED handling the intensity of the PAH bands. However, our sample is dominated by galaxies with qPAH > 4%. This concerns 91 out of 146 galaxies,
imply-ing that there is a need for models with a larger range of PAH. Furthermore, the most massive galaxies, with log(M∗/M ) > 10,
have a PAH fraction >4% and larger χ2 values. This suggests
8.5 9.0 9.5 10.0 10.5 11.0 log M* (MO •) 0.5 1.0 1.5 S500 obs /S500 mod 1.12+/- 0.11 0.5 1.0 1.5 S350 obs /S350 mod 1.03+/- 0.05 0.5 1.0 1.5 S250 obs /S250 mod 0.98+/- 0.04 0.5 1.0 1.5 S160 obs /S160 mod 1.03+/- 0.10 0.5 1.0 1.5 S100 obs /S100 mod 0.97+/- 0.16 0.5 1.0 1.5 S70 obs /S70 mod 0.89+/- 0.18 0.5 1.0 1.5 S60 obs /S60 mod 0.96+/- 0.24 0.5 1.0 1.5 S24 obs /S24 mod 0.95+/- 0.05 0.5 1.0 1.5 S22 obs /S22 mod 0.90+/- 0.10 0.5 1.0 1.5 S12 obs /S12 mod 1.06+/- 0.09 0.5 1.0 1.5 S8 obs /S8 mod 0.93+/- 0.15 0 4 8 12 16 20 χ2red
Fig. 3. Observed to modeled flux densities ratios for every photomet-ric band (from 8 µm, top panel, to 500 µm, bottom panel) versus the stellar mass. Points are color-coded according to the reduced χ2
asso-ciated with the fit. For each wavelength, we indicate the mean value and the standard deviation of the ratios. High-mass systems have larger χ2. DL07 models underestimate the 500 µm observations, especially for
low-mass systems.
10
100
1000
λ (µm)
10
-610
-410
-2S
ν/S
K γ (%) 0.9-1.2 1.2-1.5 1.5-2 2-5 > 5 < 0.3 0.3-0.6 0.6-0.75 0.75-0.910
-610
-410
-2S
ν/S
K qPAH (%) 3-3.5 3.5-3.75 3.75-4 4-4.5 > 4.5 < 1.5 1.5-2 2-2.5 2.5-310
-610
-410
-2S
ν/S
K Umin 2-2.5 2.5-3 3-4 4-6 6-8 > 8 < 0.5 0.5-1 1-1.5 1.5-2Fig. 4. Best-fit SEDs normalized to the observed K-band flux densities and color-coded according to the estimated value of the DL07 output parameter (top panel: γ, middle panel: qPAH, and bottom panel: Umin).
10
-610
-410
-2S
ν/S
K log LIR 9.7-9.9 9.9-10.1 10.1-10.4 10.4-10.6 >10.6 <8.6 8.6-8.9 8.9-9.5 9.5-9.710
100
1000
λ (µm)
10
-610
-410
-2S
ν/S
K log Mdust 7.1-7.3 7.3-7.5 7.5-7.7 7.7-7.9 >7.9 <6.1 6.2-6.5 6.5-6.7 6.7-6.9 6.9-7.1Fig. 5. Best-fit SEDs normalized to the observed K-band flux densi-ties and color-coded according to the value of the resulting log LIR(top
panel), and log Mdust(lower panel).
due to the small range of qPAH values available. An increase in
γ translates to a bump in the 25−60 µm range, as shown in the bottom panel of Fig.4. The lack of observational data in this
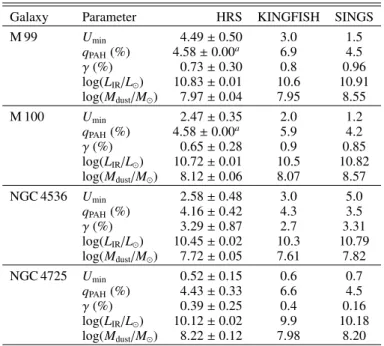
Table 6. Comparison of the outputs parameters from DL07 determined in this work, by Dale et al.(2012; KINGFISH) and byDraine et al.
(2007; SINGS) for four galaxies in common.
Galaxy Parameter HRS KINGFISH SINGS
M 99 Umin 4.49 ± 0.50 3.0 1.5 qPAH(%) 4.58 ± 0.00a 6.9 4.5 γ (%) 0.73 ± 0.30 0.8 0.96 log(LIR/L ) 10.83 ± 0.01 10.6 10.91 log(Mdust/M ) 7.97 ± 0.04 7.95 8.55 M 100 Umin 2.47 ± 0.35 2.0 1.2 qPAH(%) 4.58 ± 0.00a 5.9 4.2 γ (%) 0.65 ± 0.28 0.9 0.85 log(LIR/L ) 10.72 ± 0.01 10.5 10.82 log(Mdust/M ) 8.12 ± 0.06 8.07 8.57 NGC 4536 Umin 2.58 ± 0.48 3.0 5.0 qPAH(%) 4.16 ± 0.42 4.3 3.5 γ (%) 3.29 ± 0.87 2.7 3.31 log(LIR/L ) 10.45 ± 0.02 10.3 10.79 log(Mdust/M ) 7.72 ± 0.05 7.61 7.82 NGC 4725 Umin 0.52 ± 0.15 0.6 0.7 qPAH(%) 4.43 ± 0.33 6.6 4.5 γ (%) 0.39 ± 0.25 0.4 0.16 log(LIR/L ) 10.12 ± 0.02 9.9 10.18 log(Mdust/M ) 8.22 ± 0.12 7.98 8.20
Notes. (a) For M 99 and M 100, the PDF of q
PAH is very narrow and
yields to an error of 0.0. This emphasizes the need for higher fractions of PAH for these galaxies.
range can explain the difficulty in constraining γ, already out-lined in Sect.4.3.
The fitting procedure also provides us with the LIR and the
Mdust(Fig.5). A trend between the LIRand the shape of the SED
is visible. Late-type galaxies are more gas-rich, and thus have a higher dust content, therefore, they form more stars. The tight link between the SFR and the LIRyields to the trend observed in
the top panel of Fig.5. No particular relation is found between Mdustand Sν/SK.
4.4.3. Comparison with the literature
This sample and the SINGS/KINGFISH (Kennicutt et al. 2003,
2011) sample have four galaxies in common: M 99, M 100, NGC 4536, and NGC 4725. We compare, in Table6, the results from the fits from our procedure with those found by Draine et al. (2007) and Dale et al. (2012) fitting DL07 models. For M 99, M 100, and NGC 4725,Draine et al.(2007) did not have any submm constraint on the SED, except for NGC 4536 for which they had a SCUBA 850 µm flux density.Dale et al.(2012) benefited from a larger set of models yielding to a larger param-eter space to be explored with 0.01 < Umin < 30, 3 < log Umax<
8 and 0% < qPAH< 12%. Despite the differences with the
pho-tometric coverage for SINGS and with the parameter ranges for KINGFISH, we find results in agreement.
5. Comparison with physical parameters
We study here the relations between the output parameters of the models and various physical variables available for our sample. In a phenomenological model independent approach, the rela-tions between these physical properties and the FIR colors of the gas-rich late-type galaxies have been analyzed inBoselli et al.
(2012) where a complete description of these variables can be
Table 7. Completeness of the integrated properties for the final sample of 146 galaxies.
Properties Number of galaxies
M∗ 146 SFR 141 b 141 Σ(Hα) 129 µe(H) 146 12+ log(O/H) 124 A(FUV) 117 LIR 146 Mdust 146
found. Here we provide a very brief description. The number of galaxies of our sample for which ancillary data are available are given in Table7.
Stellar masses (M∗) are estimated from H-band data, and
from mass–luminosity relations, as determined by the chemo-spectrophotometric galaxy evolution models of Boissier & Prantzos(2000), using the relation given inBoselli et al.(2009). The effective surface brightness in H-band, µe(H), provides a
measurement of the intensity of the ISRF produced by the old stellar population. The Hα surface brightness is a tracer of the intensity of the ionizing UV emission and provides us with in-formation on the present star in-formation activity (Boselli et al. 2009). The SFRs are calculated using the standard calibration of
Kennicutt(1998) to convert Hα and FUV luminosities corrected from dust attenuation using the Balmer decrement (Boselli et al. 2009) and the corrections ofCortese et al.(2008), respectively. The final SFR corresponds to the mean value of the SFR deter-mined from the Hα data and the FUV data (Boselli et al. 2009). The birthrate parameter b (Scalo 1986;Kennicutt 1998), de-fined as the ratio between the present star formation activity and the star formation activity averaged on the galaxy entire life, is defined byBoselli et al.(2001):
b= S FR hS FRi =
S FRt0(1 − R)
M∗
, (4)
with t0the age of the galaxy, M∗its stellar mass, and R (assumed
to be 0.3) the fraction of re-injected gas into the ISM due to stellar winds. The SFR being linked to the UV or Hα fluxes and M∗to the NIR fluxes, b is thus tightly linked to the hardness of
the UV radiation field. Moreover, the specific star formation rate (sSFR,Brinchmann et al. 2004) is widely used and can be linked to the birthrate parameter as:
sS FR=S FR M∗
= b
t0(1 − R)
· (5)
Hughes et al.(2013) measured the metallicity of the galaxies in our sample with integrated spectroscopy, where different cal-ibrations are used to derive 12+ log(O/H), depending on the availability of the main emission lines. A(FUV), in magnitude, is the attenuation of the nonionizing UV radiation, defined as the ratio between the FIR and the FUV (at 1539 Å) flux densities, following the recommendations ofCortese et al.(2008).
The outputs of DL07 models are compared to these inte-grated properties. We decompose our sample in three groups according to the morphological types of the galaxies: Sa, Sab and Sb, Sbc Sc and Scd, and Sd, Im and BCD6. Galaxies
6 We follow the groups and symbols used inBoselli et al.(2012) to
8.2 8.4 8.6 8.8 12+log(O/H) 0 1 2 3 4 5 qPAH ρ= 0.73 With WISE22 With MIPS24 8.0 8.5 9.0 9.5 10.0 10.5 11.0 11.5 M* Sd,Im,BCD Sbc,Sc,Scd Sa,Sab,Sb ρ= 0.56
Fig. 6. Relation between the fraction of PAH and the metallicity (left panel) and between the fraction of PAH and the stellar mass (right panel). Galaxies are color-coded according to their morphological type. Red: Sa-Sb; green: Sbc-Scd; and blue: Sd-BCD. Filled symbols are for galaxies with a MIPS 24 µm observations and thus a good constraint on γ. Empty symbols are for galaxies with a WISE 22 µm observations. The Spearman correlation coefficients, ρ, are provided. The cross gives the typical error bar on the data.
with a MIPS24 measurement are represented by filled symbols whereas galaxies with WISE22 are represented by empty sym-bols. All the relations are presented in Fig.D.1, and discussed in Appendix D. For the total sample, we give the Spearman correlation coefficient of the relations. With a number of ob-jects larger than 100, a correlation is expected to be real with a Spearman correlation coefficient larger than 0.40. We outline here the most interesting correlations between the properties and the DL07 output parameters.
One of the strongest trends is found between the metal-licity and qPAH (ρ = 0.73, Fig. 6), Metal-rich galaxies, with
12+ log(O/H) have a high fraction of PAH. The PAH are de-stroyed in low-metallicity environment by the UV radiation field, which propagates more easily due to the lower dust con-tent. This was demonstrated in Galliano et al. (2003),Boselli et al.(2004),Madden et al.(2006),Engelbracht et al.(2008), and
Gordon et al. (2008) for galaxies with lower metallicities. We should note that, in this work, we observe this relation for metal-rich galaxies with 8.3 < 12+ log(O/H) < 8.85. We also con-firm, on a larger sample, the results ofEngelbracht et al.(2005) who found a weakening of the PAH features at low metallicity from 8 to 24 µm flux density ratios, andSmith et al.(2007) who found that the strength of the PAH bands is directly linked to the metallicity from the Spitzer/IRS spectrum of 59 nearby galaxies. However, Galliano et al.(2008) suggested that the absence of PAH could be due to a delayed injection of carbon dust by AGB stars, and Sandstrom et al.(2012) proposed that the PAH were formed in molecular clouds, which have a lower filling factor in low-metallicity environments. A good relation is found between the stellar mass and qPAH (ρ= 0.56). Indeed, massive galaxies
are also more metal-rich (Tremonti et al. 2004).
A good correlation is found between the Umin parameter,
which is the intensity of the diffuse ISRF (Draine et al. 2007;
Aniano et al. 2012), and the Hα surface brightness (ρ = 0.70), and a moderate anticorrelation between Umin and the H-band
surface brightness in AB mag arcsec−2(ρ= −0.49), as shown in Fig.7.
A similar behavior was outlined by Boselli et al. (2012) where they found relations between FIR colors sensitive to the IR emission peak (S60/S250, S60/S100and S100/S500) andΣHα
and µe(H). This is consistent with what we observe in this work,
as the Umin parameter regulates the position of the IR
emis-sion peak (see Fig.4). The stars of the diffuse component emit the bulk of their radiation in NIR, which can be probed by the H-band surface brightness. It is thus expected to find a rela-tion between Umin and µe(H). This means that the diffuse dust
is heated by the old stellar component. Furthermore, a good re-lation is also found with ΣHα, which is the ionizing surface brightness due to the young stars. The diffuse dust component seems to be also heated by the young stars component in star forming regions. With a Spearman coefficient of −0.44, there is not a strong correlation between µe(H) andΣHα that could have
originated the relations with Umin. This result from integrated
galaxies seems incompatible with works based on the analysis of resolved galaxies (Bendo et al. 2010,2012a; Boquien et al. 2011). These studies showed that at wavelengths shorter than 160 µm, most of the dust is heated by massive stars whereas at wavelengths longer than 250 µm, the dust is primarily heated by evolved stellar populations. This discrepancy can be explained by the fact that the brightest regions of the galaxies dominate the emission measured with integrated flux densities. For late-type galaxies, in IR, the brightest regions are heated by star formation and thus are linked to the Hα emission, explaining the correla-tion that we observe. Therefore, enhanced star formacorrela-tion might increase Umin, in which case the interpretation of Umin may be
that it no longer traces only the diffuse ISRF from evolved stars but just the lowest energy radiation field within the galaxies for integrated studies.
6. Infrared templates
Thanks to the wealth of photometric data and physical proper-ties available for the HRS galaxies, the gas-rich galaxy sample studied in this work is ideal for building new, well-constrained, IR templates. The majority of star-forming galaxies are known to follow an SFR–M∗correlation, called the main sequence (MS),
and galaxies that lie above this sequence are experiencing a star-burst event (Elbaz et al. 2011). Several studies have put con-straints on the MS at different redshifts (e.g.,Peng et al. 2010;
37 37.5 38 38.5 39 39.5 ΣHα (erg s-1 kpc-2) 0 2 4 6 8 Umin ρ= 0.70 With MIPS24 With WISE22 22 21 20 19 18 17 16 µe(H) (AB mag arcsec-2)
ρ=-0.49 Sa,Sab,Sb Sbc,Sc,Scd Sd,Im,BCD
Fig. 7. Relation between Umin, tracer of the minimum intensity of the ISRF, the Hα and H-band surface brightness (left panel and right panel,
respectively). Galaxies are color-coded according their morphological type. Red: Sa-Sb; green: Sbc-Scd; and blue: Sd-BCD. Filled symbols are for galaxies with a MIPS 24 µm observations and thus a good constraint on γ. Empty symbols are for galaxies with a WISE 22 µm observations. The Spearman correlation coefficient, ρ, is provided. The cross gives the typical error bar on the data.
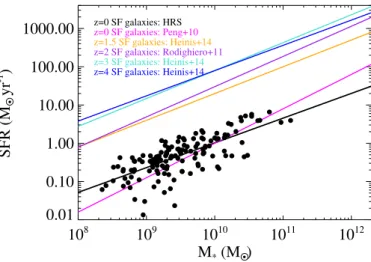
108 109 1010 1011 1012 M* (MO •) 0.01 0.10 1.00 10.00 100.00 1000.00 SFR (M O • yr -1 ) z=0 SF galaxies: HRS z=0 SF galaxies: Peng+10 z=1.5 SF galaxies: Heinis+14 z=2 SF galaxies: Rodighiero+11 z=3 SF galaxies: Heinis+14 z=4 SF galaxies: Heinis+14
Fig. 8. HRS galaxies placed on the SFR–M∗plot (black dots). The best
linear fit is shown as a solid black line. For comparison, other MS fits estimated at different redshifts are shown. The HRS galaxies are consis-tent with the relation ofPeng et al.(2010), however, it seems that HRS low-mass systems have higher SFRs.
volume-limit, and completeness in the K-band, the HRS is well suited for providing constraints on the local MS as the results are relatively free of distance-related biases that could appear in a flux-limited sample of galaxies. Figure 8 places the late-type star-forming galaxies of our sample in an SFR–M∗ plot,
along with several MS estimations. The SFRs are calculated assuming a Salpeter initial mass function (IMF) and the stel-lar masses are calculated assuming an IMF of Kroupa, we thus corrected the SFRs by a factor of −0.17 dex, following the re-sults ofBrinchmann et al.(2004) andBuat et al.(2014). A di-rect comparison can be done only with the sample ofPeng et al.
(2010) since it is the only one based on local galaxies. The MS local estimation ofPeng et al.(2010) was built from a subsam-ple of SDSS galaxies with 0.02 < z < 0.085. Their selection is only complete at z = 0.085 above a stellar mass of ≈1010.4M
.
There is relatively good agreement with the MS local estimation ofPeng et al.(2010). The observed difference in the slope may come from the different ranges of stellar masses that our sample
107 108 109 1010 1011 ν L ν (L O • ) log M* = 9.47 log LIR = 9.47 log Mdust = 7.02 SFR = 0.7 MO •.year-1 b = 2.02 log sSFR = -9.80 12+log(O/H) = 8.57 10 100 1000 λ (µm) 0 1 2 Sν /Smean
Fig. 9. Top panel: mean SED of z = 0 normal star forming galaxies. The mean values of the physical parameters associated with the sample are indicated. Bottom panel: dispersion of the models used to compute the mean SED in all of the bands of our photometric coverage.
and the sample ofPeng et al.(2010) cover. The best linear fit determined from our galaxies is:
log SFR= 0.65 × log M∗− 6.46. (6)
6.1. Construction of the templates
We computed the mean SED of the whole sample of late-type nondeficient galaxies from this work to provide the typical z= 0 SED of nearby normal galaxies (Fig.9). To do so, we averaged all the best-fit SEDs of the gas-rich subsample studied in the pre-vious sections. We provide the mean values of all of the physical properties that are associated with the sample from which this mean SED originates (Fig.9).
We then binned the best-fit models of the sample by birthrate parameter, SFR, dust mass, metallicity, stellar mass, H-band ef-fective surface brightness, Hα surface brightness, and morpho-logical type (Fig.10). The bins (indicated on Fig.10) have been chosen in order to have a consistent number of objects in each
108 109 1010 1011 ν Lν (L O • ) log M* < 9 9 < log M* < 9.5 9.5 < log M* < 10 10 < log M* < 10.5 10.5 < log M* M* 0.1 1.0 10.0 SX /SmeanSED 108 109 1010 ν Lν (L O • ) SFR < 0.3 0.3 < SFR < 3. 3. < SFR SFR 0.1 1.0 10.0 SX /SmeanSED 108 109 1010 ν Lν (L O • ) log b < 0 0 < log b < 0.5 0.5 < log b log sSFR < -10.1 -10.1 < log sSFR < -9.6 -9.6 < log sSFR b / sSFR 0.1 1.0 10.0 SX /SmeanSED 108 109 1010 ν Lν (L O • ) ΣHα < 38 38 < ΣHα < 38.5 38.5 < ΣHα < 39 39 < ΣHα ΣHα 10 100 1000 λ (µm) 0.1 1.0 10.0 SX /SmeanSED µe(H) < 18 18 < µe(H) < 19 19 < µe(H) < 20 20 < µe(H) µe(H) 12+log(O/H) < 8.4 8.4 < 12+log(O/H) < 8.6 8.6 < 12+log(O/H) 12+log(O/H) log Mdust < 6.5 6.5 < log Mdust < 7 7 < log Mdust < 7.5 7.5 < log Mdust log Mdust Sa-Sab-Sb Sbc-Sc-Scd Sd-Im-BCD Morph. Type 10 100 1000 λ (µm)
Fig. 10. Library of templates derived from the fits. SEDs are binned by (from top to bottom and left to right): stellar mass, SFR, birthrate parameter (sSFR), Hα surface brightness, H-band effective surface brightness, metallicity, dust mass, and morphological types. For each class of templates, the lower panels show the ratio between the different binned templates and the mean HRS SED of Fig.9.