HAL Id: hal-02816306
https://hal.inrae.fr/hal-02816306
Centrally administered economic instruments for water
management
Jean-Philippe Terreaux, Thomas Guille, Laura Nocentini, . Centre National
Du Machinisme Agricole, Du Génie Rural, Des Eaux Et Des Forêts
To cite this version:
Jean-Philippe Terreaux, Thomas Guille, Laura Nocentini, . Centre National Du Machinisme Agricole, Du Génie Rural, Des Eaux Et Des Forêts. Centrally administered economic instruments for water management. 2006. �hal-02816306�
A
QUASTRESS
W
ORKPACKAGE
3.6
Q
UESTION
4
C
ENTRALLY ADMINISTERED ECONOMIC
INSTRUMENTS FOR WATER MANAGEMENT
Thomas Guille, Laura Nocentini
et Jean-Philippe Terreaux
Cemagref – Montpellier – France
January 2006
Reference:
Guille T., L. Nocentini, J.P. Terreaux, 2006, Centrally administered economic instruments for water management, Aquastress, Cemagref - Montpellier, Document de travail 2006-03, 41 p.
Table of contents
1. Introduction ... 3
2. The case studies... 5
2.1. Tadla, Morocco ... 5
2.2. Flumendosa, Italy ... 9
2.3. Vecht / Zwarte Water basin, The Netherlands ... 15
2.4. Przemsza, Poland ... 18 2.5. Guadiana, Portugal ... 23 2.6. Iskar, Bulgaria ... 26 2.7. Cyprus ... 30 2.8. Merguellil, Tunisia ... 35 References ... 38
1. Introduction
The centrally administered economic instruments include here water pricing, quotas and even, on a theoretical point of view, water markets. We note that the term ‘centrally administered’ is rather arbitrary. For example, a water pricing scheme may be considered as centrally administered by a given farmer, especially if he has no choice other than accepting or refusing to buy water at the given tariff. But the pricing scheme may have been defined as a result of a whole decentralized and democratic process, for example by the Water User Associations (WUA) or by elected water management boards. The water tariff may even be defined directly by the government (at a regional level, at the state level…), and in this case the decentralisation may be considered as induced by the democracy which may be at the root of all collective decisions (through elective processes, as in the European Union), or not. Moreover a water market or a water-rights market may itself be considered as decentralized, if people are allowed to resell one another water, but the way prices are fixed may be centrally defined.
Let us take the example of another instrument that can be administered by a central decision maker or through a decentralized process: the quotas, potentially associated with the possibility to resale water. When the central administration (at a national level or very often within a WUA) decides of the distribution of water rights through quotas, based on criteria chosen by itself, quotas are a command control type instrument, clearly regulated in a centralized manner. When those quotas may be exchanged in a market, then they are managed in a rather decentralized manner. Imagine now that the way quotas were initially distributed between farmers in a WUA is submitted to the vote of all stakeholders. Is it centralized or decentralized since everyone participates in the decision? Notice too that the choice of a voting procedure may come from a central regulator.
The relative interest of decentralized and centralized administered economies is well documented for a long time (for example Eucken, 1948a and b or Marschak, 1969). The interest of centralized or decentralized instruments on a general economic point of view is also studied in the literature (see for example Buccola, 1985, for the study of pricing efficiency in centralized and non-centralized markets). It would be very interesting to study more specifically the consequences of the choice of an instrument on diverse results interesting water management, as the profitability of farming, the WUA budgetary equilibrium, the efficiency of water using, the environment preservation and so on.
This is not the subject of this paper which is limited to the examination of the centrally administered instruments for the Aquastress eight case studies, which will not let us study the comparative interests of different mechanisms for resource allocation (a well document field in economics, but for which a lot remains to be done concerning the water resource management). Notice that the fact that local community participation improve the different aspects of water management is neither generally supported by the economic literature (see for example Vyrastekova and van Soest, 2003) nor documented when analysing the field experiences.
When comparing the three instruments, water markets seem to be among the most accurate methods of providing information about the full costs of water. Meanwhile pricing schemes can be used to achieve various policy objectives such as water conservation. Other economic instruments can also be used to control water pollution, for examples, subsidies for water quality improvements or pollution charges (Anderson and Farooqi, 2003).
Water pricing is well documented in Aquastress deliverable D 3.5-1 (Groom et al., 2006). As described by Johansson et al. (2001), we know that it is efficient, on many purposes, to base prices on the marginal cost of acquiring more water plus its scarcity value. However, prices based on marginal costs are often too high for low farm incomes. This is especially true when the scarcity value is such that marginal cost pricing would drive smaller, less productive farms out of production. Quota allotments often are used in these situations to mitigate equity issues, at the price of a lessening of the economic efficiency. By allowing quota allotments to be traded, the water authority can address equity concerns while promoting more efficient allocations.
The conditions in which a water market is the preferable management tool are rather restrictive (Dinar A. et al. 1997): From a strict economic point of view, the operation of a competitive and efficient market has several conditions. In the case one or several conditions are not met, an efficient market is indeed quite possible, but with special rules or constraints. First, the market should have many sellers and buyers, each with complete information on the market rules (institutions), and each facing comparable transaction costs. Second, decisions made by each seller or buyer are preferentially independent of decisions made by other sellers and buyers. Third, decisions made by one individual should not affect the outcome of another individual in order to avoid externality issues. Usually, commodities or resources will move from uses at low value to highest value uses. The preceding conditions represents usually the requirements for the creation of a market, generally speaking, and in the case of water, there are at least two additional stipulations: a definition of the initial allocation of water rights and the existence of an institutional and legal frameworks for trade. This may require the intervention of a central organization. Transferable water rights may have the same property as water markets.
Notice that in this case the value of prevailing transferable or not transferable water rights is generally capitalized into the value of irrigated land. Any change of these rights may imply a change of land values which may lead to strong opposition by land owners or by land users.
2. The case studies
2.1. Tadla, Morocco
The Tadla irrigated perimeter is located on the left and right banks of the Oum Er Rbia River, some 200 km northeast of Marrakech and 170 km southeast of Casablanca (Figure 1). It is a part of Oum Er Bia catchment.
Source : Aquastress (2005)
Figure 1: Tadla irrigated (in green) perimeter location in Morocco
The Perimeter irrigates about 100,000 hectares. The climate is arid to semi-arid. The Tadla irrigated perimeter stretched on 35 000 km2. The inhabitants on the perimeter are about
643,000, of whom 51 % are rural and 49 % are urban (Aquastress (2005a)).
The main activity in the Tadla plain is agriculture which creates some manufacture activities (olive oil related works, sugar refineries, flour-mill…). There are approximately 28,000 farmers within the 100,000 ha. Principal crops grown are sugar beets, wheat, alfalfa, olives, citrus, various vegetables and some spices. A majority of the crops produced are for internal consumption within Morocco, in part for subsistence of the farm families and in part to satisfy national demand. The Tadla irrigated perimeter is one of the most important in Morocco regarding to its contribution to the Growth National Product (Aquastress (2005a)).
The Oum Er Bia watershed basin is the second important watershed of Morocco. The surface water is used for many purposes: irrigation, drinking, industrial use and hydropower generation. Agriculture uses more than 90% of the water resources at the Oum Er Rbia catchment scale (Aquastress (2005a)).
In the Tadla perimeter, supplied by a dam reservoir, water is managed by the ORMVAT (Regional Office of Agriculture Valorisation for the Tadla) created in 1966. "As an "Office", ORMVAT has a unique legal identity and does not fall under the budgetary control of central government. The organization has been financially self-sufficient since 1986, and receives no government subsidy. The sale of water covers the ongoing operating costs of the organization. In the area, the ORMVAT is responsible for surface water distribution sold to farmers." (Easterling, 1994).
In the 1995 water law, objectives of sustainable management were clearly put forward, as well as resource preservation. The law recognizes the economical value of water and encourages the application of the polluter-payer principle.
"Up to the early 1980's, water allocation was based on farmers' requests, within the confines of the canal capacity. However the occurrence of drought through much of that decade" (Draper, 1993) combined with the increase in water demand for domestic and industrial uses (Petitguyot and al., 2004) and the resulting shortage of water resulted in the need to modify the system (Draper, 1993).
Since the 90's, and specifically after the liberalization of crop patterns in 1996 (which leads as a consequence to an increase in water demand), water availability has been inferior to demand. Water allocation's rules changed from a controlled crop pattern with attached water rights to a centrally prescribed system based on a complex quota allocation procedure with a volumetric pricing of consumed water tied to a minimum billed volume.
The quota allocation takes place at the beginning of each year at the ORMVAT. The decision depends on the total available water volume in each perimeter, on priorities set for each crop, on crop water needs, and on the network carrying capacity (volume and flow) (Thomas, 2001). The water is allocated among farmers in proportion of their surfaces and depending on chosen crops. The allocation is a quota available at each water turn. "Water scheduling follows a relatively rigid rotation system with a fixed flow rate and a more or less fixed irrigation frequency or interval" (Draper, 1996). Service invoice is proportionate to delivered volume calculated thanks to the duration of the water turn. Usually farmers use integrally their water quota since they are neither transferable, nor movable in time.
In recent years, water stress has been such that the ORMVAT had to diminish delivered water quantities. This reduction occurred through diminishing the number of turns, delivering half-dose, and saving water for specific crop which were considered as prioritary: cereals, sugar beet, alfalfa, etc. A percentage of the total surfaces opening water rights have
This tariff covers the total cost of water services (amortizations of the investment and infrastructure renewal). A minimum invoicing of 3000 m3/ha is applied to all irrigated surfaces, due even the volume that is demanded is lower. This minimum is exceptionally abolished when the office is unable to deliver the water.
(a) Source: Petitguyot (2005)
Period (dd-mm-yr) Price in DH/m3
01-10-69 to 30-06-80 0.024 01-07-80 to 30-06-81 0.034 01-07-81 to 30-06-82 0.044 01-07-82 to 30-04-84 0.048 01-05-84 to 30-09-85 0.079 01-10-85 to 17-03-87 0.090 18-03-87 to 02-01-90 0.100 03-01-90 to 14-07-92 0.120 15-07-92 to 04-04-95 0.150 05-04-95 to 05-12-95 0.160 06-12-95 to 1996 0.170 (b) Source: Freitas (1996)
Table 1: Two historical water prices series in the Tadla perimeter
Note that Dollars ($) have been used in the table (a) and Dirham (DH), in the table (b). As there is no energy expenses, water distribution costs in the Tadla perimeter are the cheapest of Morocco. We can consider that the actual tariff covers almost entirely the water service costs (maintenance and operation costs, not including capital depreciation and opportunity cost of the invested capital). The objective of the different tariff increases was always to recover service costs (and has to be correlated with the strong inflation) and not to encourage users to lessen their water consumption.
This irrigated perimeter is characterized by the fact that the open surface water covers only a little part of the crop water needs. Consequently users turn to the groundwater for their irrigation (Petitguyot and al., 2004).
In the past, the State had encouraged individual withdrawals from groundwater as an efficient solution to mitigate the local water deficit. Consequently, uncontrolled individual withdrawals from groundwater multiplied. This has indeed allowed the maintain or an increase of the agricultural production level. But today Tadla faces salinity problems and a diminution of the level of ground water.
Year Price (in $/m3)
1980 0.005 1987/88 0.01
1992 0.015 2002 0.02
Tadla (Morocco) test site in brief
In the agricultural sector, the tariff structure in Tadla is a volumetric tariff with a minimum billed volume. Due to scarcity issues, the amount of water is limited through a quota allocation procedure. Farmers use integrally their water quota since they are neither transferable, nor movable in time and because of the low cost of water. Cost recovery is an important objective. The important tariff increase since the perimeter formation always aimed at this objective.
The choice of a centrally economic instrument (quota) is due to different natural, economic and political considerations. A particularity of this test site is the high rate of individual withdrawals from groundwater. This has allowed a maintain or an increase of the agricultural production level and is linked to financing by emigrated people. But today Tadla faces salinity problems and a diminution of the level of ground water (difficulty to manage the resource).
2.2. Flumendosa, Italy
2.2.1. The Sardinia and Flumendosa context
Sardinia, as many European islands, has a rather scarce water resource. Moreover the climatic changes of the last years, characterized by recurrent droughts, combined with the structural infrastructure insufficiency to fulfil the need increase for human, agricultural and industrial consumption, have caused a drastic deficit between water demand and its availability.
Flumendosa river basin (1824 km²) is located in the central-eastern part of Sardinia. It includes three interconnected reservoirs (Flumineddu, Flumendosa and Mulargia). The three reservoirs constitute with other interconnected reservoirs, located outside the basin, the Flumendosa-Campidano hydraulic system (Figure 2).
Source : Aquastress (2005)
Figure 2: Flumendosa river basin and Flumendosa-Campidano hydraulic system The Flumendosa basin is too affected by water scarcity and quality problems due to drought. The climate is characterized by long dry periods followed by high intensity rainfalls. In this context, pollutions lead often to a reduction of usable water resources. Flood episodes can also provoke transport of nutrients that accumulate in the basin and may cause eutrophication processes. Coastal aquifers are affected both by saline water intrusion and insufficient recharge.
Table 2 presents the water needs and resources in Sardinia. The figures come from calculations of the independent Flumendosa Water Board. The island’s current water needs is about 1,162 million m3/year and the water resources currently available for consumption is about 621 million m3/year. The water needs are broken down into: 294 million m3 for the households (25.3%), 61 million m3 for industries (5.3%) and 807 million m3 for agriculture (69.4%) (Eurisles (2000)). The Table 2 details the situation in the different regions of Sardinia. The Flumendosa basin is located in the southern part of Sardinia.
The current situation - in Million m³ / year
Water area Needs Resources Shortfall (-) Share of shortfall % Northern Sardinia 300 176 -124 -41,30% Eastern Sardinia 101 76 -25 -24,70% Central Sardinia 249 137 -112 -45,00% Southern Sardinia 512 232 -280 -54,70% TOTAL 1162 621 -541 -46,60% Source: Eurisles (2000), Water, an urgent priority for Sardinia: the problem and the programmes
Table 2: Water needs and resources in Sardinia.
Figure 3 compares the average water requirements and delivered water of the Flumendosa hydraulic system registered in the surveyed six years (1997-2002). The Flumendosa river basin is a part of the Flumendosa hydraulic system. During this period, the average distributed volume was almost 50% less than the volume required (430 Mm³ (total water demand) to be compared to 210 Mm³ (total available water)) and in particular deficits of 27.3% for potable use, 62.3% for agriculture and 14.2% for industries were registered, with agriculture strongly affected in favour of other uses.
Source : Aquastress (2005)
Figure 3: Flumendosa hydraulic system water demand (average 1997-2002)
Aquastress (2005) presents also some supplementary data concerning the demographic and socio-economic characteristics of the Flumendosa basin: The total population is about of 22.000 inhabitants, a total which increases during summer season by about 3.000 people. The Municipalities of the basin located near the coastal area are not supplied by reservoir surface water but by groundwater of alluvial aquifers which are exploited for all economic and domestic sectors. These aquifers are now overexploited and are not sufficient to meet the water demand.
The land is used for breeding, with no irrigation practices, in the upper part of the Flumendosa basin. Notice that the original vegetation has been notably altered to convert areas to pasture. The most intense agricultural activities are concentrated in the south-eastern parts of the basin, with cultivation of grains and vines but above all with citrus orchards which are the most common agricultural land uses of this area. Farmers use private wells for irrigating these cultures. Water pollution is mainly due to the eutrophication induced by wild breeding and by the industry activities.
The scarcity issues cause several conflicts in water distribution among the different uses and in particular between agriculture and the other sectors. These conflicts are difficult to be solved with simple management rules because of the many uncertainties linked to the supply and demand side of the equation, and especially to the climatic conditions.
In the complex system of the south of Sardinia, where the Flumendosa basin is located, the water demand level is the island highest. In spite of draconian cutbacks (of 20-25%) in the amounts of water allocated for human consumption and for industrial uses, ordered by the Commissioner for the water emergency, the volume remaining for agriculture was at some time only just enough to cover livestock needs and to ensure the survival of fruit crops (Eurisles (2000)).
A plan has been carried out since 2000 in order to resolve this increasingly serious problem within the next ten years. Mitigation options had been already applied in the Flumendosa basin to limit the water deficit (Aquastress (2005a)), and among them:
- The repairing of the old pipelines for limiting the water losses, that are quite important,
- The realisation of new pipelines and dams,
- The connection between the Flumendosa dam and the Tirso dam. This allows transferring water resources to Southern Sardinia from a central basin (Tirso catchment) where the water balance between water availability and demand is positive,
- The adaptation of demand regulation …
This plan is supposed to allow to reach a satisfactory level of economic development, and to maintain the quality of the islanders’ life in terms of water requirements. The persistence of water shortage would signify that the essential needs of the population could not be met, and economic development, food production and protection of the natural environment would be hindered (Eurisles (2000)).
2.2.2. Description of the Flumendosa water pricing structure
The information on the Flumendosa pricing practices, provided in this section, comes from personal communications with Ludovica Diliberto, regional partner of Flumendosa Aquastress test site, and from a document on the economic aspects by Lojelo (2004), based on the water plan of Sardinia and presenting synthetically many aspects of water management in Sardinia.
The Flumendosa present-day pricing structure Domestic sector
The price setting is a binomial structure with a minimum annual volume. The volumetric part is an increasing block tariff (IBT). The details of the tariff on July 1st 2002 were:
- A fixed part of 10.33 €/year, - A minimum volume of 54 m3/year,
- A four block structure (see Figure 4), the threshold volumes being: 84, 124, and 164 m3/year.
Source: Bollettino ufficiale della R.A.S. parte terza n. 21, 2003
Figure 4: Volumetric part of domestic water tariff in Flumendosa, valid July 1st 2002. Agricultural sector
The farmers in Flumedosa Campidano area are members of the Consortium for irrigation of Southern Sardinia. They can be divided into two categories: farmers whose lands are equipped with irrigation infrastructures, and farmers who don't have irrigation infrastructures, but are members of the Consortium.
For irrigation purposes, water is paid to the Consortium according to the number of hectares of land. It’s a flat rate indexed on the number of hectares.
According to the available information, farmers pay a fixed tariff per hectare that split up into three parts:
- 48 €/ha for the membership of the Consortium, - 217 €/ha for the water,
- 72 €/ha for different services as transport, maintenance of irrigation structures in the irrigated area, Consortium services, extraction cost, environmental and capital cost... It means that farmers who have irrigated areas pay (217 + 72 + 48) €/ha, the others 48 €/ha.
“The fixed payment doesn't give to the farmers the right to a certain water flow. Farmers must pay the fixed price (217 €/ha) even if they do not receive water according to the requirements, during water scarcity period for example. It’s an issue of this tariff structure and a huge source of complaint from the farmers”.
For the moment, plots are not equipped with flow meters. So it is not possible to monitor the amount of water consumed by each farmer. The average consumption of water has been
evaluated at about 6000 m3 per hectare per year. Water is shared according to fixed water turns.
The Flumendosa new pricing structure
The upcoming new pricing structure should be a volumetric system centred on cost recovery issues. The tariff structure should be the same for the domestic and the agricultural sector. A consequence of this reform is, for the agricultural sector, that lands are being equipped with flow meters in order to allow the payment according to the consumed water.
The tariff should be calculated for the first year of implementation the following way: Tt = ((C+A+R)/ VE)t-1 * (1+H+K)t
Where: - C, A and R are operational cost, provision cost and capital cost, - VE is the volume which is distributed during the year,
- H is the expected inflation rate,
- K the price increase rate limitation chosen by the regulatory body depending on is productivity improvement objectives.
For the following years, the price will change according to the anticipated inflation rate and the price limitation controlled by the regulator through the K ratio. It’s a "price cap" type system.
The objective of this price setting is clearly the operational and financial cost recovery. We do not have information on the effects of the application of this general formula to each sector. There are neither equity considerations nor environmental costs considered in this tariff.
Flumendosa (Italia) test site in brief
In the domestic sector, the actual water tariff is a two part tariff with (Increasing Block Tariffs) IBT and a minimum volume of consumption. This water tariff is centred on cost recovery (through the minimum volume of consumption) and consumption limitation (through the IBT structure).
In the agricultural sector, the water tariff is a flat rate. It is not linked to the consumption and is problematical in case of water scarcity (inflexibility and complaints from
2.3. Vecht / Zwarte Water basin, The Netherlands
This section arises from the document “Data water service Vecht”, supplied by Henk Wolters, Aquastress Link Person for the Vecht test site.
General
Water services in the Netherlands are priced in various ways. For many water services the total amount of levies is in the order of 90 to 100 % of the induced costs. This includes:
- Production and transport of water, usually drinking water, in some cases for irrigation and industrial use;
- Collection and transport of surplus rainfall and waste water; - Wastewater purification
- Ground water management
- Regional surface water management
The total amount of money involved in these services is about 4 billion euros nation-wide. Next to the above, there are large national services such as dike construction along the coast and the rivers, and large physical infrastructure. These are paid from the general means (taxes); yearly amount is of about 1.5 billion euros nationwide.
Water production and transportation
This is mainly the occupation of drinking water companies. They charge their customers with a fixed yearly sum, plus a charge per m3. For this purpose, water meters are installed for each customer.
A little more than 50 % of these services are used by households, and more than 40 % by industry; the rest, a limited amount, is used by agriculture. Agriculture does use a lot of water that is extracted from open water bodies, and pays for that through the taxes to the water board (see below).
Collection and transportation of rain water and waste water
This process runs through the sewerage system. In a limited number of cases the system for rain water discharge is separated from that of waste water discharge. A levy is charged for each connection. In sum 2/3 of the transportation costs are paid by households, 1/3 by enterprises. This service is provided by the local authorities, i.e. municipalities.
In some cases, companies or farmers collect and store rain water themselves, and use this for their production.
Wastewater purification
This service is provided by the water boards. Pollution is categorised in 'pollution units', and the taxes are calculated according to the number of pollution units that each household or enterprise produces. Households are subdivided into two categories (one
pollution unit, corresponding to one person, or three pollution units, corresponding to more than one person). Enterprises are charged according to their actual waste water production, which is monitored in load and discharge. Small enterprises are typically taxed for three pollution units.
In the Water Board ‘Velt en Vecht’ in the Vecht site, the taxation per pollution unit in 2005 is 63,96 €. To reduce their levies, larger industries may decide to build their own treatment plants, which then are financed through the prices of their outputs. In total households pay about 2/3 and enterprises about 1/3 of the total costs, just as in the collection and transport of wastewater.
Ground water management
The provinces are responsible for groundwater management. Extractions of less than 10 m3/hour are free of charge in most parts in the Netherlands; the only obligation is that their existence must be registered by the Province. This general rule is well accepted since it appears to be well founded: the administrative costs of measuring all small extractions would be large, while the influence of these small extractions is limited. Some large extractions are used at factories. For these extractions a levy is paid to the province.
Regional water management
The Water Boards are responsible for the regional water management. They perform all activities required in this fields, including water quality, as well as shipping management, secondary and tertiary canals and ditches, riparian zones and dike construction and maintenance (at the exception of the primary dikes along the coast).
The costs of these services are paid by the users. These are subdivided in three sets: inhabitants, house/building owners and land owners. The charge per category depends on the size of the property and the value of the property (built-up areas are taken into account as registered in the municipal cadastre; unbuilt areas dependent on land use).
For 2005 the rates of Water Board Velt and Vecht (in the Vecht area) are:
- 34,32 € for each household, owner or renter, irrespective of the number of members;
- 0,47 € for each 2.268 € value of the property for house owners (note that the average value of houses in the Netherlands is about 210.000 €).
- For land owners, the charge corresponds to the size of their property in ha, subdivided in three categories. The rate is 33,02 € per ha for category A, 77,20 € per ha for
Other instruments
New options are presently being considered, when looking at the large tasks ahead in the field of water quality and quantity. There are plans for the implementation of one over-all water tariff, replacing all the taxes and levies mentioned above. Also the implementation of tradable water rights (e.g. for extraction of surface water for irrigation) is considered. At this moment there is not (yet) sufficient support for such measures, mostly stemming from the conviction that water should be 'free of charge'. Also institutional interests play a role.
Elasticity
Elasticity is very low. There is no alternative for water. Also the costs of water in production are so low that a change in water consumption has little influence on the prices of the output.
Vecht (The Netherlands) test site in brief
In Vecht, the different water services are split up into five categories: production and transport of water; collection and transport of surplus rainfall and waste water; wastewater purification; ground water management; and regional surface water management.
Pricing is the only economic instrument employed. In the production part, the tariff structure is a two part tariff with a single volumetric part. It is incentive to water savings. In all the others categories, the tariff is centred on cost recovery with a flat rate, excepted in the industrial sector where an IBT is applied for wastewater. In all categories, the household sector always covers the majority of the costs (generally, 2/3 is paid by households, 1/3 by enterprises).
Agriculture uses a lot of the water that is extracted from open water bodies, and pays for that through the taxes to the Water Board which bears the regional responsibility for water management.
2.4. Przemsza, Poland
The information of this section has been transmitted mainly by Elzbieta Druzynska, regional partner of the Przemsza test site.
The Przemsza river catchment (red patch on the map presented in Fig. 5) is situated in an ecoregion of “central plains”. The catchment belongs to the upper Vistula river catchment.
Hydrogeological conditions of the discussed catchment have been significantly disturbed. The first cause was draining activity of coal mining and zinc and lead ore mining. The second factors changing water regime was the intensive utilization of underground waters of the Triassic layer for municipal and economic purposes.
Source : Aquastress (2005)
industrial sewage, and agricultural pollution. The quality of groundwater is good. In sum, the problem is more the water quality, than the resource quantity, which moreover is improved by storage reservoirs.
Poland is administratively divided as follow: Country
Voivodships – 16 (The Przemsza test site is located mainly in Silesia Voivodship) Poviats - 379
Gminas – 2478
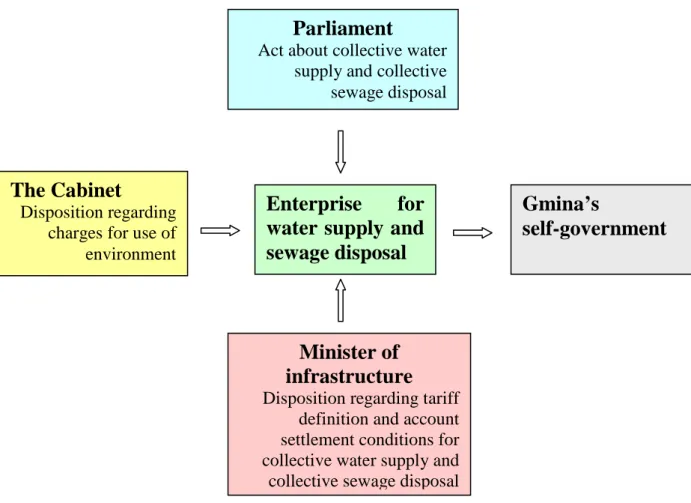
The Gmina is the smallest administrative unit in Poland. According to the law, Gminas are responsible for water supply to municipal users as well as for wastewater disposal. The different Gminas can get their water from own underground intake or from an enterprise. In the case of water supplied by an enterprise, the Figure 6 presents how the water price is set.
Figure 6: Scheme of setting the water price for water users
The situation of 9 Gminas located in the Przemsza test site is the following: Six of them are situated on the Czarna Przemsza river; the 3 others are on the Byrnica river. In these different Gminas, water is supplied either from an enterprise (the Upper-Silesian Water Supply Enterprise from Katowice) or from an own underground intake or from an underground intake of another Gminas.
The pricing structures are in all cases a two part tariff. The fixed part is or is not indexed on the water pipe diameter. The volumetric part is divided in a price for the supplied water and a price for the sewage disposal. It’s a single volumetric part. The pricing system
Parliament
Act about collective water supply and collective sewage disposal
Enterprise
for
water supply and
sewage disposal
Gmina’s
self-government
The Cabinet
Disposition regarding charges for use of environment
Minister of
infrastructure
Disposition regarding tariff definition and account settlement conditions for collective water supply and
can be differentiated between the users (principally domestic sector and industrial sector) or not.
We detail now the tariff structure of two Gminas. Their situations are representative of the different situations of the Przemsza test site.
Sosnowiec
Sosnowiec Gmina hasn’t got its own underground intake. Water is supplied from Upper-Silesian Water Supply Enterprise from Katowice (the regional capital). The tariff for collective water supply and collective sewage disposal, presented here, stands from 1.01.2005 to 31.12.2005.
Group of recipients Specification Net price Unit of measure
Households, industrial and others recipients of services
1 price for supplied
(delivered) water 3,50 zl/m
3
Households, industrial and others recipients
of services 1 rate of charge 4,05 zl/month Households, industry and others recipients
of services
1 price for sewage
disposal 3,94 zl/m
3
Table 3: Water tariff in the Sosnowiec Gmina 1 euro = 3,84 zl (14-12-2005)
According to Table 3, in this Gmina, the different users are not differentiated. The tariff is composed of a two part tariff: a price in zl for m3 supplied (delivered) water, a rate of subscription fee (zl/month) independent on amount supplied water, paid independently of water withdrawal.
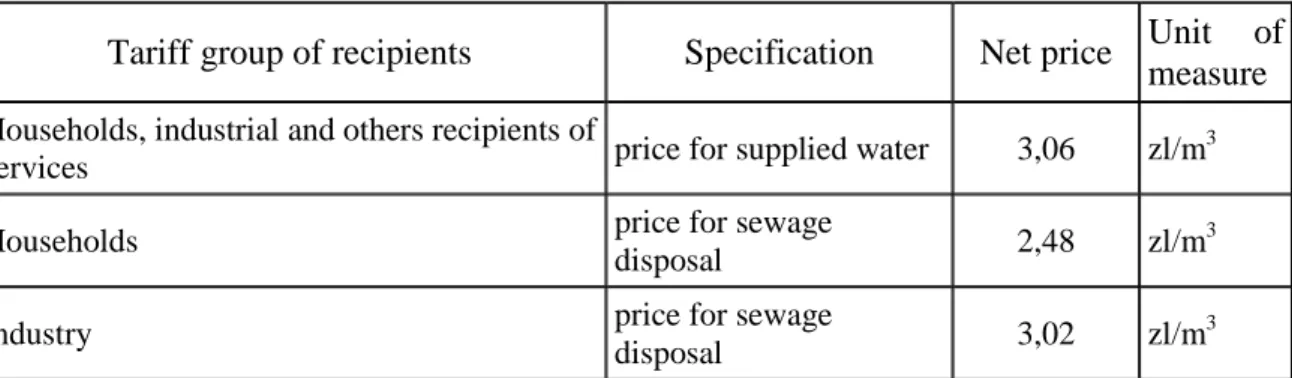
Poreba
Poreba Gmina has got two own underground intakes (near 80% of the production) and buys water from Siewierz and Zawiercie (own intakes). The tariff for collective water supply and collective sewage disposal, presented here, stands too from 1.01.2005 to 31.12.2005.
Tariff group of recipients Specification Net price Unit of measure
Households, industrial and others recipients of
services price for supplied water 3,06 zl/m
3
Households price for sewage
disposal 2,48 zl/m
3
Industry price for sewage
disposal 3,02 zl/m
3
Table 4: Water tariff for the Poreba Gmina
No Pipe type Rate of month net charge
1. ø 15 mm ÷ 25 mm 2,52 zl 2. ø 32 mm ÷ 50 mm 14,57 zl 3. ø 80 mm ÷ 150 mm 53,72 zl 4. compound 50mm – 100 mm 102,78 zl
Table 5: Fixed part according to the pipe type
This Gmina is an example where the different user sectors are differentiated: household and industry are differentiated for the sewage disposal. The fix part of the tariff is indexed on the diameter of the pipe.
Payments and penalties for the use of environment
A system of payments and penalties exists for the use of environment. In the water sector, the use of environment concerns water abstraction and wastewater disposal. For these two activities, legal water permits, that define quantities and conditions of water abstraction and quantity and quality of disposed wastewater, are necessary. The payments are for the amounts actually “taken from” or “given to” the environment. These amounts are limited by a boundary value given in legal water permits.
When a user illegally exceeds the amounts given in his legal water permit, he has to pay a penalty. The payments and/or penalties a user pays are collected in the Funds for Environmental Protection and Water Management. Every institution/user may claim to the Fund for Environmental Protection and Water Management for financial support for the investments he plans. In general these financial resources are used to funding the environmental protection and water management that are in accordance with a “sustainable development principle”.
Przemsza (Poland) test site in brief
The Przemsza test site region is characterized by an important industrial and town development. Water is highly polluted.
For domestic and industrial uses, the economic instrument employed is the pricing. The pricing structures are two part tariffs. A first part can be fixed or indexed on the water pipe diameter. The volumetric part is divided in a tariff for the supplied water and a tariff for the sewage disposal. It’s a single volumetric part. The tariff can be differentiated between the users or not.
Environmental considerations, central for this polluted area, are highlighted through a system of payments and penalties for the use of environment. A buyable water permit defines quantities and conditions of water abstraction as well as quantities and quality of wastewater. Penalties exist for illegal users. The money collected goes to a Fund for Environmental Protection and Water Management.
2.5. Guadiana, Portugal
Portugal and Spain share the Iberian Peninsula, in which mainland Portugal occupies 15%. Five river international basins are shared by these two countries: Minho, Lima, Douro, Tejo and Guadiana, with two thirds of their borders established by those rivers or tributaries. In general, the Spanish watershed territory is upstream, with the exception of Guadiana River whose lower stretch and estuary border the two countries.
Source : Aquastress (2005)
Figure 7: Guadiana’s River Basin location (in green) and Portugal’s five river international basins shared with Spain
Currently, 60% of the available groundwater resources are being exploited in Guadiana River Basin, against 10% of the available superficial water resources. This preferential exploitation of groundwater resources is due to the low population density and the existence of a large number of small scale water supply systems. Water quality problems are usually associated to these systems, where control and monitoring activities are poor. There is a slight water deficit, aggravated in extremely dry years.
The principal water stress issues are:
- for the water quantity: the transboundary water management of Guadiana river, the recurrent drought during summer months, the small storage capacity in the Guadiana river basin and the conflicts over water use between domestic use and agriculture,
- for the water quality: the diffuse pollution from agriculture, high concentration of nutrients, the point sources pollution from industrial units, mining, sewage treatment plants, and illegal landfills and the upstream pollution.
The main water consumer in this test site is the agricultural sector. It represents 95,47 % of the water consumption, the domestic sector represents 3.35 %, the tourism 0.39 % and the industrial and production energy sector 0.79%. The water demand is globally increasing (Aquastress (2005b)).
The main economic instrument for water management used in this test site is water pricing with a price which does not reflect the economic cost of water. Water price is relatively low (it is a “political” price, not a real price) and there are little incentives to water savings (WWF (2003)). Moreover farmers don’t usually pay for the water they consume. Only farmers served by collective irrigation schemes (which totals about 10% of the total irrigated land) pay for the abstracted water.
The budget for domestic water represents 0.89% of the average household budget, the average household income being 13562 €/year. The average household budget for agricultural water is 0,06 €/m3. The cost recovery are very low (23%) and the price elasticity is also low.
According to a recent study by Ribeiro and Maia (1996a), and to Maia (2001), the drinking water price for Portugal (0,747 $US/m3) was in 1995 about 10% lower than the averaged price of the EU members (0,812 $US/m3) but more than 30% higher than in Spain (0,549 $US/m3) – and about 100% if purchasing power correction was made. In fact, the huge infrastructure water investment makes Spain the EU country with the most expensive water cost at source, but paradoxically with one of the lowest water prices. The current development of water markets, in both countries, will surely and quickly correct this distortion. In what concerns agriculture, the study enhanced the policy of both countries, with prices unchanged for decades (Portugal: 0,016 $US/m3, double that of Spain: 0.008 $US/m3). It should be stressed that both countries have mostly used (non-recoverable) public investment on agricultural storage capacity, especially in the southern basins. In the future, due to private sector water investment and to the EU water policy, the price of water should reflect its ‘real’ price. Appropriate strategies need to be focused on restraining growth in per capita consumption, namely in agriculture, improving basin water resources management and controlling demand through tariff setting based on economical and social reasons.
The Portuguese Water Law combines public and private ownership of water resources (OECD, 1999). Considering the country’s small population and the extensive amount of land which is currently irrigated, Portugal is relatively well-endowed with water resources. Nevertheless, wide differences exist between the North and the South. Traditionally, water abstractions have been allowed free of charge, provided that users do not
Agricultural water prices are levied by water user associations (WUAs), but in accordance with very complex mechanisms and formulae. The complexity arises because WUAs sometimes supply municipal water as well; because property sizes affect the water charges; and because charges are combined with drainage fees in projects that require drainage. Between the passage of Decree 269/82 (in 1982) and new legislation in 1995, farmers were charged a two part levy. The first was meant to recover the operation and maintenance costs of irrigation schemes and was based on individual farm acreages. The second component was meant to reimburse the State over a fifty year period for the capital costs invested in projects. Project beneficiaries were required to pay a yearly set charge called TEC (“Taxa de Exploração e Conservação”), which includes a selection of no more than three of the following components: (i) fixed charge per reclaimed or ameliorated hectare (ranging from US$ 18 to 270 ); (ii) fixed charge per irrigated hectare (ranging from 31 to 146 US$); (iii) volumetric charge per cubic meter, if metering is possible (ranging from US$ 0.01 to 0.028 per cm); (iv) a drainage fee, when drainage of excessive water is required (ranging from US$ 19 to 67); and (v) a crop-based fee applicable for specific crops and projects (ranging from US$ 16.9 to 87.3) (Bragança, 1998).
Although the capital cost charge element has never achieved its intended objective of full cost recovery (as in many other countries), the Portuguese system has the peculiarity that it computes fees payable using different rates, with the rates varying according to each area’s soil quality and the crops grown. For instance, Brangança (1998) reports significant water price differences paid by farmers in Sorraia: US cents 1/m3 for rice (involving 17 200 m3/hectare) and US cents 1.5/m3 for corn (involving 7 200 m3/ha); and US cents 2.5/m3 for tomatoes (involving 5 400 m3/hectare). It is clear that the “ability-to-pay” principle, combined with other agricultural policy objectives, underlies these price differentials. Nonetheless, charges in Sorraia were gradually raised over the period 1991-97, such that they are now set at levels that exceed total operation and maintenance costs (with the extra revenues being used to cover fixed management costs in dry years). Notice that this project in Sorraia does not typify the majority of Portuguese irrigation projects.
As of 1995, all licensed use of water has been subject to a water levy, whose amount depends in principle on: (i) the amount of water used; (ii) the net returns generated by each type of user; and (iii) each region’s relative scarcity of water (OECD, 1997).
The Alqueva project in the Guadiana Basin — currently under construction, and to be completed in 2024 — is expected to expand Portugal’s total irrigation area, by 110 000 - 200 000 hectares (the final increase will depend on final design features). A large part of the US$ 2.35 billion costs of the project will be financed by European Union Structural Funds. Currently, there is an intense debate within Portugal about how operation, maintenance and capital costs should be distributed among the various user sectors (not only in agriculture) which will benefit from the project. New legislation will be needed to establish how, and to what extent, these costs will be finally shared among these water users.
2.6. Iskar, Bulgaria
The Iskar River is the longest one inside the territory of Bulgaria (368 km), situated in the west part of the country. It has the third biggest catchment area (8.650 km). The selected subcatchment begins at the river spring and ends at Sofia, the capital of Bulgaria.
Source : Aquastress (2005)
Figure 8: The selected subcatchment (left circle),
the Iskar reservoir (right) and the monitoring station (right circle)
The main factors affecting the vulnerability of water issues in the region are: • The irregular surface water run off distribution within the year;
• Non-rational use of the regulated water volume of Iskar reservoir; • The trend to drought;
• High percentage of drinking water losses in water supply network (about 50%); • The usage of potable water for industrial and agricultural needs;
• The river pollution due to non controlled dispose of domestic and industrial wastewaters and wastes;
• The pricing strategy
The tariff structure is a single volumetric structure. The water price is calculated after a “very complicated and comprehensive formula. It includes many factors, but mostly the market pre-conditions that influence directly the price formation, like inflation for example. All tariff amendments are voted by the Municipal council of the city. They could be annual or interim tariff adjustments”.
• Possible options for tariff adjustments
“Unforeseen "pass-through" expenses are those that occur as a result of a relative event such as a change in legislation or due to any other reasons which are beyond the control of the Concessionaire and which were not foreseen and respectively not included in the respective base tariffs.
If those expenses occur soon after the effect of the annual adjustment, or if the microeconomic conditions became significantly worse soon after the effect of the annual adjustment, and the Concessionaire can prove to the Grantor that the aggregate increase of his capital and operation costs, caused by such event, either alone or when added to the increase of the capital and operation costs, which the Concessionaire may assess as being caused by such event or other events and that will lead to the reaching or exceeding of the Limit for Interim Adjustment of the Tariffs, the Concessionaire is entitled to an Interim Tariff Adjustment in accordance with the Tariff Adjustment Procedure”.
• An example of the water tariff for different users
The Table 6, that is no longer valid, will give an idea of the tariff structure. The charges are only volumetric.
Tariff [BGN/м3] without VAT Tariff [BGN/м3] without VAT Service CY 4 3 CY 4 CY 3’ CY 4’ Potable water Domestic 0,266 0,266 0,418 0,457 Budget 1 0,300 0,300 0,458 0,498 Others 2 0,310 0,310 0,470 0,511 Sewerage Domestic 0,086 0,086 0,106 0,113 Budget 0,097 0,097 0,119 0,127 Others 0,099 0,099 0,122 0,130 Wastewater treatment Domestic 0,085 0,085 0,115 0,128 Budget 0,095 0,095 0,128 0,141 0,136 0,136 0,177 0,193 0,180 0,180 0,228 0,248 0,211 0,211 0,265 0,288 Others (BOD5 3 ) - Up to 200 mg/l - 100 to 600 mg/l - above 600 mg/l - Industrial water 0,257 0,257 0,331 0,353
Table 6: Tariff structure in Sofia
1
The “budget” category includes every state and municipal institutions and bodies like ministries, municipal buildings, agencies, court houses etc.
2
The “others” category applies mainly to industrial customers and owners of wastewater collection trucks.
3
BOD5: Biochemical Oxygen Demand. 4
CY means “Concession Year”.
The two left columns (CY3 and CY4) show what the tariff should have been according to one of the Annexes of the water company Concession Agreement during the year 3 and 4. It’s basically the so called base tariff at the beginning of the concession.
In the right columns (CY3’ and CY4’) the tariffs are a bit higher because the “pass-through” mechanism was applied after a Grantor’s request (representing the Municipality of Sofia). The Grantor wanted the water company to implement several investment projects,
Recently, a new situation appeared due to the implementation of a new water regulator in Bulgaria. All water companies have to submit a three years business plan with detailed breakdown of all capital and operational expenditures and a tariff proposal. The water regulator is now the only one to approve the water tariffs. As the regulator is still in process of setting the secondary legislation base, this is not yet implemented. It is expected to become effective at the beginning of the next year (2006). Until then, the current price mechanism is the one in place (above described).
• Other instruments
Based on the water volumes abstracted, the water company pays on an annual basis a water tax to the Environment and Water Ministry which issues a “water usage permit” for the large water users. This permit defines water abstraction limits (how much water that can be taken from the reservoirs). In case of a river catchment, it defines as well a maximum intake flow. The water permit can be revised every five years, depending on changes in circumstances, which should be proved accordingly.
Iskar (Bulgaria) test site in brief
The principal economic instrument is the pricing; water usage permits also exists in a particular case.
The tariff structure is a single volumetric structure differentiated according to the users: domestic, industrial and public institutions. The tariff is adapted to the evolution of the economical situation (the market pre-conditions that influence directly the price formation, like inflation, are included in the tariff calculation). It is annually revisable, which allows cost recovery. Pollution is taken into account in the industrial sector through a tariff for wastewater treatment indexed on pollution concentration (BOD5) in discharged water. Water
2.7. Cyprus
Cyprus is an arid to semi arid island state situated in the north-eastern Mediterranean (Figure 9). The renewable freshwater resources are highly constrained. These are characterized by a strong spatial and temporal scarcity caused by the seasonal distribution of precipitation, and the topography. The selected region is presented in the Figure 10.
Source : Aquastress (2005)
Figure 9: Cyprus in the Mediterranean
Source : Aquastress (2005)
Figure 10: The selected Limassol region
This section is taken from a draft supplied by Ioannis Glekas (2005), Aquastress regional partner of the Cyprus test site, and from Socratous (2000, 2005).
In Cyprus, both the methodology and the actual pricing of water differ for the various main water use sectors. The main water use sectors are those of agriculture and domestic use. The tourist and industrial uses are included in the domestic sector since these, in most cases, are geographically interconnected and share the same distribution system. In a normal year, 70% of the water is used in irrigated agriculture and 25% in the domestic sector and the remaining 5% for environmental purposes.
Due to the specific geographic and climatic circumstances, Cyprus has a strongly regulated water market. The Water Development Department (WDD) is a natural monopoly for domestic water and for a part of the irrigation water (because about half of the supply of irrigation water comes from government waterworks (GWW)). Since its independence, in
the four Districts. Water is also supplied to the Turkish occupied part of Nicosia and Famagusta, although the latter refuse to pay any water dues.
The Municipal Water Boards and Village Commissions distribute water to the domestic and industrial consumers within a town. These are set up under the Water Supply (Municipal and Other Areas) Law, Cap 350, 1951. These derive their supplies partly from underground resources and partly from bulk supplies of treated water delivered to storage reservoirs by the Water Development Department’s trunk main system.
On the other hand, the WDD provides water for irrigation to the Irrigation Divisions, Irrigation Associations, and Waterworks Committees in the four Districts of the country. Cyprus applies a quota system for the allocation of government irrigation water on an annual basis and on the basis of the current groundwater conditions and the content in the surface reservoirs, in combination with penalty charges for over withdrawals. These market based structures contribute to the efficient use of water. Under conditions of water scarcity, especially during droughts, priority and preference are given to covering a higher proportion of the domestic supply followed by greenhouse agriculture and permanent crops. Seasonal crops under these conditions are reduced dramatically. As a recent example, in the period of 1997 to 2000 there were severe reductions to the water supply: reductions from the government schemes for domestic supply amounted to 20 to 30%. Reductions to the irrigation supply ranged from 20 – 80 %. The reduction to industry and animal breeding was similar to the domestic supply and averaged 28%.
Moreover, special permits are issued on an annual basis governing the quantity of the water to be pumped from the aquifers. Preference is given to areas with problems of getting water from existing irrigation schemes.
Water pricing practices
Contrary to the costs of domestic water that is fully charged to customers, the price of irrigation water does not cover full financial, let alone economic, costs in Cyprus. This so-called under-pricing has various effects on the society, a number of which are of economic nature while others are social and environmental effects (Driehuis, 2001).
Domestic water tariffs
For calculating the domestic use water tariffs the “Balanced Budget” (Socratous, 2000) method is used. This method provides for the cover of the full operating and maintenance costs, including contingencies for working capital requirements, and debt service requirements or depreciation, whichever is higher and takes into account any shortfall or surplus in the required revenues in the previous year.
In view of the WFD (Water Framework Directive) Implementation Procedures, a pricing reform was undertaken by the Government, regarding domestic and irrigation supply from the Government Water Works. Accordingly, from 01/01/2004 the bulk domestic water tariff was adjusted to 0.45 CY £/m3 (about € 0.77) for water supply in the areas of Larnaca, Famagusta, Nicosia and Limassol, and to 0.33 CY£/m3 (about € 0.57) for the district of Pafos. Setting progressive block tariffs, seasonal prices and over-consumption penalties for the
purpose of promoting efficiency and conservation objectives in water use, lies within the jurisdiction of the local authorities and the Water Boards, that are responsible for the distribution of the water within the various urban and rural centres.
On the other hand the water tariff structure imposed by the Water Boards is made of two parts: a fixed charge and a volumetric charge. Tariff rates are progressive; for example, the volumetric charge increases as consumption increases. This progressively promotes water conservation. Household water use metering is universal in Cyprus.
Problems of equity and friction are created by the fact that water tariffs between the Water Boards are different. Charges to water tariffs, especially uniform domestic water tariffs, are difficult since the Water Boards, Municipalities and Village communities cannot readily implement them. The difficulty arises because production and purchase of water differ according to the source, whether it is groundwater or surface government schemes. Furthermore, the administration, distribution, network maintenance and improvement costs vary from one organisation to the other due to size, organisational structure and personnel. In Limassol, domestic water is sold at a price appreciably lower than in Nicosia or Larnaka.
The water tariff structure imposed by the Water Boards of Limassol, Nicosia and Larnaca is given in the following Tables for the domestic and commercial/industrial sectors (Charalambous, 2005).
Water Tariff ( metering on a monthly basis) £/ m3 Consumption m3 Limassol Water Board Nicosia Water Board Larnaca Water Board Fixed charge
( over a 4 month period)
6,00 5,00 6,20 1 – 20 0,10 0,35 0,19 21 – 40 0,10 0,40 0,19 41 – 60 0,18 0,50 0,43 61 – 80 0,18 0,55 0,43 81 – 100 0,35 0,85 0,68 101 – 120 0,35 1,10 0,93 121 – 160 2,00 1,40 1,12 161 + 2,00 1,40 1,12
Water Tariff ( metering on a monthly basis) £/ m3 Consumption m3 Limassol Water Board Nicosia Water Board Larnaca Water Board Fixed charge
(over a 4 month period)
42,00 50,00 32,00 1 – 200 0,19 0,55 0,43 201 – 400 0,19 0,55 0,43 401 – 600 0,29 0,80 0,50 601 – 800 0,29 0,80 0,50 801 – 1000 0,29 0,95 0,74 1001 – 1200 0,29 0,95 0,74 1201 + 0,29 0,95 0,74
Table 8: Water tariff in the industrial / commercial sector
The cost recovery of financial costs has been improved considerably after the tariff increase made the 01/01/2004, and it is expected that it will reach approximately 75% by the end of 2005. Environmental costs have minor contribution in the total cost. Finally, resource costs show a continuous decline, due to the increasing water availability conditions, which minimises benefits from agricultural water use.
Irrigation water tariffs
The water tariff for agriculture is calculated using the “Present Worth Value” method (Socratous, 2000) in which the “unit cost” means full operation and maintenance costs together with capital costs calculated at an interest rate of 9% per annum over a period of 40 years, after a grace period of five years. The weighted average unit cost is calculated by multiplying the unit cost for each water scheme by the corresponding projected volume of water sold, totalling the results and dividing such total by the volume of the water available. Loan Agreements with the BIRD specify that charges for irrigation water should be established so that they should be sufficient to cover 38% of the weighted average unit cost of such water. The Government Waterworks Law stipulates that the rates for the irrigation water shall not be more than 40% of the weighted average unit cost of the water, cost i.e., CY£ 0.1164 per m3 (€ 0.20). At the present time, actual average irrigation water tariff is CY£ 0.0631 per m3 (about € 0.11), which is equivalent to 22,3% of the weighted average unit cost of the water (presently farmers for government irrigation water pay CY£ 0.055 to 0.07 per m3) depending on the irrigation project they are in, while the price for domestic water is CY£ 0.45 per m3 (about € 0.77).
Currently, tariffs for irrigation freshwater are differentiated on a local basis. From 2004, a gradual increase of tariffs is being implemented, at the end of which, in 2007 tariffs will have reached the uniform charge of CY£ 0.11 per m3 (€ 0.20) for all Government Water Works.
Fig. 11: Observed and expected price evolution in Cyprus.
Good management practices dictate that the price of the water should reflect its full cost. Based on this principle, it is argued that the new price representing only 38% of the weighted average unit cost is not high enough. On the other hand and although current tariffs may encourage cultivation of high water consuming crops, increasing the tariffs would make many of these crops unprofitable. Some crops, however, such as most of vegetables, deciduous fruits and nuts would remain profitable. Discouraging some part of the irrigated agriculture might lead to further urbanisation with all its associated social problems. An additional consideration is that as surface water becomes more expensive, it could lead to excessive use of local groundwater. This might result in saline intrusion and further degradation of the aquifer reserve leading to greater inequities between the farmers depending on government schemes and those depending on non-government schemes (Socratous, 2005).
The first effect of the tariff reform are evident, since recovery of financial costs has much improved to 67 % and is expected to reach 77 % by 2005 (Water Development Department, 2005).
Other water tariffs
The water tariff levels for other uses follow a middle course in between the existing irrigation and domestic tariff levels. For example, the present water tariffs for industrial use and animal husbandry are CY£ 0.20 and CY£ 0.13 per m3 respectively. As mentioned above, all tariffs need the approval of the Council of Ministers and then of the House of Representatives. 0.11 0.14 0.155 0.17 0.20 0.1 0.12 0.14 0.16 0.18 0.2 2003 2004 2005 2006 2007 €
2.8. Merguellil, Tunisia
The Merguellil River is one of the 3 largest temporary rivers of the central semi-arid Tunisia. The upstream part of its catchment is relatively mountainous, at the limited scale of the Tunisian topography and the downstream part is large alluvial plain.
The upper catchment is made of older geological formations, with very limited alluvium in the most important valleys. Small aquifers exist. In the upstream part, surface and groundwater or only surface water (in the extreme north-west of the catchment) are available. Because of the semiarid climate, surface water is not easy to use in time and space.
Source : Aquastress (2005)
Figure 12: Location of the test site
The Merguellil catchment is representative of the problems met in Mediterranean regions. It is formed by two entities, each one having its own differentiated characteristics. These two units are linked by the water flow: every modification of the water budget upstream will have an impact on the plain water availability but there is no retroactive effect of the downstream on upstream. The upper part is a region of production and consumption of water when the lower part is only a region of consumption (Aquastress (2005a)).
Central Tunisia, where is located the Merguellil catchment, is subject to a very great climatic variability. The total amount of rainfall for a year and its distribution over the year is very variable. The only way to fight the drought years is the storage of water in aquifers or in surface reservoirs. But the majority of the surface reservoirs are small. They do not allow any real interannual storage (Aquastress (2005a)). The decrease in surface runoff because of conservation works upstream cause another stress.