HAL Id: hal-00301718
https://hal.archives-ouvertes.fr/hal-00301718
Submitted on 1 Jan 1994
HAL is a multi-disciplinary open access
archive for the deposit and dissemination of
sci-entific research documents, whether they are
pub-lished or not. The documents may come from
teaching and research institutions in France or
abroad, or from public or private research centers.
L’archive ouverte pluridisciplinaire HAL, est
destinée au dépôt et à la diffusion de documents
scientifiques de niveau recherche, publiés ou non,
émanant des établissements d’enseignement et de
recherche français ou étrangers, des laboratoires
publics ou privés.
Empirically derived climate predictability over the
extratropical northern hemisphere
J. B. Elsner, A. A. Tsonis
To cite this version:
J. B. Elsner, A. A. Tsonis. Empirically derived climate predictability over the extratropical northern
hemisphere. Nonlinear Processes in Geophysics, European Geosciences Union (EGU), 1994, 1 (1),
pp.41-44. �hal-00301718�
Empirically derived climate predictability over
the extratropical northern hemisphere
J.B. Elsner’ and ALA. Tsonis’
’ Dept. of Meteorology, Florida State University, Tallahassee, FL 32306, USA
* Dept. of Geosciences, University of Wisconsin-Milwaukee, Milwaukee, WI 53201, USA Received 1 December 1993 - Accepted 16 February 1994 - Communicated by A.D. Kirwan
Abstract. A novel application of a technique
devel-oped from chaos theory is used in describing seasonal to interannual climate predictability over the Northern Hemisphere (NH). The technique is based on an empir-ical forecast scheme-local approximation in a recon-structed phase space-for time-series data. Data are monthly 500 hPa heights on a latitude-longitude grid covering the NH from 20°N to the equator. Predictabil-ity is estimated based on the linear correlation between actual and predicted heights averaged over a forecast range of one- to twelve-month lead. The method is ca-pable of extracting the major climate signals on this time scale including ENS0 and the North Atlantic Os-cillation.
1 Introduction
The Earth’s global atmosphere displays a tremendous amount of variability on many space and time scales. As a result of sensitive dependence on initial conditions, all forecasts of this atmospheric variability are accompa-nied by error growth which leads to limits on accurate predictions. The question of just how predictable the weather and climate are can be addressed using observa-tions or numerical model simulaobserva-tions. The present study examines the problem of seasonal to interannual climate predictability using a nonlinear time-series model on ob-served data. The approach centers on building a model from earlier data and comparing model predictions with data later in the record. Predictability is assessed by deterioration of forecast skill as predictions are made further into the known future. The appealing aspect
of this approach is that it is independent of forecasting method, at least in theory.
2 Data and Methodology
Consider 522 consecutive maps of monthly-averaged 500 hPa geopotential heights over the extratropical North-ern Hemisphere, where each map consists of a latitude-longitude grid (18 latitude points between 20°N and the pole by 60 longitude points around each latitude circle). Geopotential heights at a given pressure level indicate the density in the underlying atmosphere and horizon-tal gradients of the height field approximate the hori-zontal momentum field. Data are from the US National Meteorological Center’s (NMC’s) initial analyses for the period January 1946 through June 1989. Thus, at each latitude-longitude grid point there exists a univariate time series of geopotential heights for 522 consecutive months. A nonlinear forecast model is trained on the first 480 months (40 years; the training set) of each time series separately and a relative measure of predictability is assessed by examining linear correlations between ac-tual and predicted values over the remaining 42 months (3.5 years; the target set).
The univariate nonlinear prediction model is a version of the Farmer and Sidorowich (1987) and Sugihara and May (1990) interpolative algorithm used in Wales (1991) and is based on the simplex method in phase space. An embedding dimension (E) is chosen and the phase space constructed using the method of time delays. Based on the decay of the autocorrelation function a time delay of two months is used, however, results are not sensitive to the exact choice of a time delay in the range of one
42
0.5 t
Embedding Dimension (E) Lead Time (months)
‘d 0.8 2 2 E 0.7 u 0.4 0.3
Figure 1. Prediction error versus embedding dimension. The prediction model is a local-linear approximation method in phase space. Prediction error is estimated by the linear correlation be-tween actual and predicted values for a one-month forecast of 500 hPa geopotential heights. Shown are prediction errors for three representive grid points over the Northern Hemisphere (grid point (1,lS) with circles, grid point (45,l) with squares, and grid point (31,12) with diamonds).
to twelve months. For each point in phase space, nearby points are located and a minimal neighborhood is de-fined such that the sequence containing the target point is located within the simplex with a minimum diameter formed from the E+l closest neighbors. A one-month prediction is made by keeping track of where the points in the simplex end up after one month into the known fu-ture. The Pearson’s product-moment linear correlation coefficient is computed over all target points to quantify predictability. The predictability field is then contoured on a map of the extratropical Northern Hemisphere.
The nonlinear prediction model requires the specifi-cation of an optimum embedding dimension. To do this Sugihara and May (1990) suggest plotting the one-step (one month) prediction error as a function of embed-ding dimension. The results of such a procedure for three representative grid points over the NH (the 1, 1 grid point is located at 20’N and O”E with indices in-creasing to the north and east) is shown in Figure 1. For all grid points linear correlation between actual and predicted values increase from low embeddings and sat-urate above embedding dimension four. Therefore, an embedding dimension of five is used for all grid points.
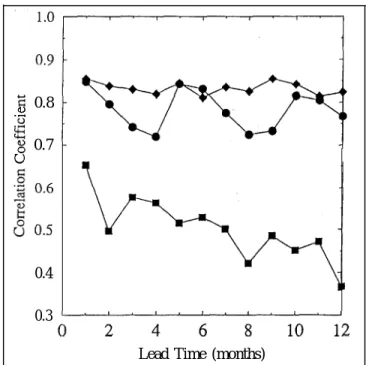
Figure 2. Prediction error versus lead time for the same three grid points used in Figure 1. The prediction model is a local-linear approximation method in phase space with an embedding dimen-sion of five months. Prediction error is estimated by the linear correlation between actual and predicted values for predictions made from one- to twelve-month lead.
Results are not sensitive to embedding dimensions in the range from two to eight.
Predictions over the target set are made at each grid point for lead times from one to twelve months. Exam-ples of forecast skill over this period are shown in Figure 2 for the same points used in Figure 1. Note that a two-month forecast is made by considering the one-two-month prediction value rather than the known value for that month; and the same procedure is followed for all fore-casts out to twelve months. These twelve forecast errors (one error for each month) are averaged to obtain a sin-gle prediction error representing how well the time series at each point can be predicted on average over an entire year.
3 Results and Discussion
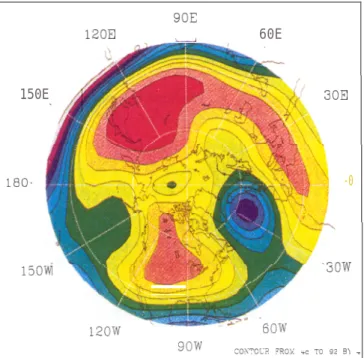
Linear correlations (X 100) between actual and pre-dicted 500 hPa geopotential heights averaged over the 42-month (January 1986 - June 1989) target set and av-eraged over lead times of one through twelve months for each grid point are color contoured in Figure 3. Corre-lations range from 0.5 (violet) to 0.9 (red). Results have been smoothed using a nine-point uniform filter.
150E -A 180. SOE -0 15ow 3ow 12ow GOW
9ow co\*c'ri 'WY 'C -0 92 91 _
Figure 3. Linear correlations (X 100) between actual and pre-dicted 500 hPa geopotential heights averaged over the 42 month (January 1986 - June 1989) target set and averaged over one-to twelve-month forecasts for each latitude-longitude grid point. Correlations range from 0.5 (violet) to 0.9 (red). Results have been smoothed using a nine-point uniform filter. Spatial heteorogene-ity of seasonal to interannual predictabilheteorogene-ity over the extratropical Northern Hemisphere is clearly evident.
Spatial heteorogeneity of seasonal to interannual pre-dictability over the extratropical NH is clearly evident. In general best predictions are found over midlatitude continental regions with poorer predictions over oceanic regions and at lower latitudes.
The explanation for the spatial variability of predicta-bility can be related, at least in part, to the strength of the seasonal cycle. The seasonal cycle, which is pre-dictable, is most pronounced over midlatitude continen-tal regions and less so over the oceans and at lower lati-tudes. Predictability of the seasonal cycle over continen-tal regions can be explained by the strong dependence of lower tropospheric temperatures (and thus density) to changes in solar insolation. This dependence is much weaker over large ocean regions where sensible heat from the waters can significantly modulate temperatures in the lower troposphere. Of special interest is the very poor predictive skill over portions of the North Atlantic Ocean and over the subtropical western Pacific Ocean.
The lack of prediction skill over the North Atlantic Ocean may be related to blocking episodes commonly found in this region (Rex, 1950; Blackman, 1976; Dole,
mal west to east flow of weather systems thus produc-ing large-scale temperature anomalies. Explanation for initiation and maintenance of blocking episodes is still largely speculative but may center on the slowly vary-ing atmospheric boundary conditions of the underlyvary-ing oceans. Strong aperiodically occurring blocking episodes can significantly alt’er the normal progression of seasons and thus effect the ability to forecast seasonal to inter-annual climate changes.
Over the western Pacific Ocean in the subtropics, poor forecast skill is attributable to the seasonal to interan-nual “footprint” of the chaotic El-Nifio - Southern Os-cillation (ENSO) signal (Vallis, 1986; Tsonis and El-sner, 1992; Elsner and Tsonis, 1993). ENS0 represents a coupling between the tropical atmosphere and ocean over the Pacific Basin. Extended periods of anomalously warm sea-surface temperatures occurring off the coast of South America (El-Nino) are linked to the zonal circu-lation of atmospheric mass (Southern Oscilcircu-lation). The variability of this coupling between sea surface temper-atures and lower tropospheric pressures in the tropical Pacific makes accurate prediction on the seasonal time scale difficult. This region of low predictability has spa-tial coherence extending into the extratropical Northern Hemisphere.
4 Conclusions
This short report describes a novel application of a tech-nique from nonlinear dynamical systems which is used in describing short-term climate predictability. The tech-nique centers around the use of a nonlinear forecasting scheme (local approximation in phase space) for time-series data. Data are taken from NMCs initial analyses. Predictability is measured as the linear correlation be-tween actual and predicted 500 hPa geopotential heights over a 42-month target set of the time record and over forecasts ranging from one- to twelve-month lead. Model training is performed on an earlier 40-year sample. The predictability field is contoured on a map of the extrat-ropical Northern Hemisphere.
From the results it is concluded that predictability on the seasonal t,o interannual time scale is closely tied to the seasonal cycle. Predictability is enha,nced over conti-nental regions of the middle latitudes where the seasonal cycle is most pronounced as a result of the dependence of lower tropospheric heating on the amount of solar insolation. Forecast skill is considera,bly less over the oceans and at lower latitudes where sensible heat in the
44
former and less variation in insolation in the latter are important in modulating the progression of seasons. The well-documented blocking episodes over the North At-lantic Ocean and the ENS0 over the Pacific are con-spicuous in producing regions of poor short-term climate predictability over portions of the Northern Hemisphere. Reasons are attributed to the sensitive nature of the cou-pling between the underlying oceans and the atmosphere as well as to the modulation of the seasonal cycle. Based on the fact that the present results match very well with previous regional studies of climate predictability it is concluded that this type of empirical analysis can prove very useful for studying global weather and climate pre-dictability.
Acknowledgements. Thanks are extended to Jason C. Hess for his help with the color graphics and manuscript preparation.
References
Barnston, A. G., and Livezey, R. E., Classification, sea-sonality, and persistence of low-frequency atmos-pheric circulation patterns, Mon. Wea. Rev., 115, 1083-1126, 1987.
Blackman, M. L., A climatological spectral study of the 500 mb geopotential height of the northern hemi-sphere, J. Atmos. Sci., 33, 1607-1623, 1976. Dole, R. M., Persistent anomalies of the extratropical
northern hemisphere wintertime circulation: Struc-ture, Mon. Wea. Rev.,
li4,
178-207, 1986.Elsner, J. B., A description of low-frequency atmos-pheric oscillations over the extratropical northern hemisphere using singular spectrum analysis, Geo-phys. Res. Lett., 19, 1775-1778, 1992.
-, and Tsonis, A. A., Nonlinear dynamics established in the ENSO, Geophys. Res. Lett., 20, 213-216, 1993.
Farmer, J. D., and Sidorowich, J. J., Predicting chaotic time series, Phys. Rev. Lett., 59,, 845-848, 1987. Rex, D. F., Blocking action in the middle troposphere
and it effect on regional climate. Part II: The clima-tology of blocking action, Tellus, 2, 275-301, 1950. Sugihara, G., and May, R. M., Nonlinear forecasting as a way of distinguishing chaos from measurement error in time series, Nature,
344,
734-741, 1990. Tsonis, A. A., and Elsner, J. B., Nonlinear prediction asa way of distinguishing chaos from random fractal sequences, Nature, 358, 217-220, 1992.
Vallis, G. K., El-Nifio: A chaotic dynamical system? Science, 232, 243-245, 1986.
Wales, D. J., Calculating the rate of loss of information from chaotic time series by forecasting, Nature, 350, 485-488, 1991.