HAL Id: inserm-02457571
https://www.hal.inserm.fr/inserm-02457571
Submitted on 28 Jan 2020
HAL is a multi-disciplinary open access archive for the deposit and dissemination of sci-entific research documents, whether they are pub-lished or not. The documents may come from teaching and research institutions in France or abroad, or from public or private research centers.
L’archive ouverte pluridisciplinaire HAL, est destinée au dépôt et à la diffusion de documents scientifiques de niveau recherche, publiés ou non, émanant des établissements d’enseignement et de recherche français ou étrangers, des laboratoires publics ou privés.
Genetic and lifestyle risk factors for MRI-defined brain
infarcts in a population-based setting
Ganesh Chauhan, Hieab Adams, Claudia Satizabal, Joshua Bis, Alexander
Teumer, Muralidharan Sargurupremraj, Edith Hofer, Stella Trompet, Saima
Hilal, Albert Smith, et al.
To cite this version:
Ganesh Chauhan, Hieab Adams, Claudia Satizabal, Joshua Bis, Alexander Teumer, et al.. Genetic and lifestyle risk factors for MRI-defined brain infarcts in a population-based setting. Neurology, American Academy of Neurology, 2019, 92 (5), pp.e486-e503. �10.1212/WNL.0000000000006851�. �inserm-02457571�
ARTICLE OPEN ACCESS
Genetic and lifestyle risk factors for MRI-de
fined
brain infarcts in a population-based setting
Ganesh Chauhan, PhD,* Hieab H.H. Adams, PhD,* Claudia L. Satizabal, PhD,* Joshua C. Bis, PhD,*Alexander Teumer, PhD,* Muralidharan Sargurupremraj, PhD,* Edith Hofer, PhD, Stella Trompet, PhD, Saima Hilal, PhD, Albert Vernon Smith, PhD, Xueqiu Jian, PhD, Rainer Malik, PhD, Matthew Traylor, PhD, Sara L. Pulit, PhD, Philippe Amouyel, MD, Bernard Mazoyer, MD, PhD, Yi-Cheng Zhu, MD, Sara Kaffashian, PhD, Sabrina Schilling, PhD, Gary W. Beecham, PhD, Thomas J. Montine, MD, Gerard D. Schellenberg, PhD, Olafur Kjartansson, MD, Vilmundur Guðnason, MD, PhD, David S. Knopman, MD, Michael E. Griswold, PhD, B. Gwen Windham, MD, Rebecca F. Gottesman, MD, Thomas H. Mosley, PhD, Reinhold Schmidt, MD, Yasaman Saba, MSc, Helena Schmidt, MD, Fumihiko Takeuchi, PhD, Shuhei Yamaguchi, MD, Toru Nabika, MD, Norihiro Kato, MD, Kumar B. Rajan, PhD, Neelum T. Aggarwal, MD, Philip L. De Jager, MD, Denis A. Evans, MD, Bruce M. Psaty, MD, Jerome I. Rotter, MD, Kenneth Rice, PhD, Oscar L. Lopez, MD, Jiemin Liao, MA, Christopher Chen, FRCP, Ching-Yu Cheng, MD, Tien Y. Wong, MD, Mohammad K. Ikram, MD,
Sven J. van der Lee, MD, Najaf Amin, PhD, Vincent Chouraki, MD, Anita L. DeStefano, PhD, Hugo J. Aparicio, MD, Jose R. Romero, MD, Pauline Maillard, PhD, Charles DeCarli, MD, Joanna M. Wardlaw, MD,
Maria del C. Vald´es Hern´andez, PhD, Michelle Luciano, PhD, David Liewald, BSc, Ian J. Deary, PhD, John M. Starr, PhD, Mark E. Bastin, PhD, Susana Muñoz Maniega, PhD, P. Eline Slagboom, PhD, Marian Beekman, PhD, Joris Deelen, PhD, Hae-Won Uh, PhD, Robin Lemmens, MD, Henry Brodaty, MD, Margaret J. Wright, PhD, David Ames, MD, Giorgio B. Boncoraglio, MD, Jemma C. Hopewell, PhD,
Ashley H. Beecham, MS, Susan H. Blanton, PhD, Clinton B. Wright, MD, Ralph L. Sacco, MD, Wei Wen, PhD, Anbupalam Thalamuthu, PhD, Nicola J. Armstrong, PhD, Elizabeth Chong, PhD, Peter R. Schofield, PhD, John B. Kwok, PhD, Jeroen van der Grond, PhD, David J. Stott, MBChB, MD, Ian Ford, PhD,
J. Wouter Jukema, MD, Meike W. Vernooij, MD, Albert Hofman, MD, Andr´e G. Uitterlinden, PhD, Aad van der Lugt, MD, Katharina Wittfeld, PhD, Hans J. Grabe, MD, Norbert Hosten, MD,
Bettina von Sarnowski, MD, Uwe V¨olker, PhD, Christopher Levi, BMedSci, FRACP, Jordi Jimenez-Conde, MD, Pankaj Sharma, MD, PhD, Cathie L.M. Sudlow, FRCP(Ed), Jonathan Rosand, MD, Daniel Woo, MD,
John W. Cole, MD, James F. Meschia, MD, Agnieszka Slowik, MD, Vincent Thijs, MD, Arne Lindgren, MD, Olle Melander, MD, Raji P. Grewal, MD, Tatjana Rundek, MD, Kathy Rexrode, MD, Peter M. Rothwell, MD, Donna K. Arnett, PhD, Christina Jern, MD, Julie A. Johnson, PharmD, Oscar R. Benavente, MD,
Sylvia Wasssertheil-Smoller, PhD, Jin-Moo Lee, MD, PhD, Quenna Wong, MS, Braxton D. Mitchell, PhD, Stephen S. Rich, PhD, Patrick F. McArdle, PhD, Mirjam I. Geerlings, PhD, Yolanda van der Graaf, MD, PhD, Paul I.W. de Bakker, PhD, Folkert W. Asselbergs, MD, Velandai Srikanth, FRACP, Russell Thomson, PhD, Rebekah McWhirter, PhD, Chris Moran, FRACP, Michele Callisaya, PhD, Thanh Phan, FRACP,
Loes C.A. Rutten-Jacobs, PhD, Steve Bevan, PhD, Christophe Tzourio, MD, PhD, Karen A. Mather, PhD, Perminder S. Sachdev, MD, Cornelia M. van Duijn, PhD, Bradford B. Worrall, MD, Martin Dichgans, MD, Steven J. Kittner, MD, Hugh S. Markus, FMedSci, Mohammad A. Ikram, MD,‡ Myriam Fornage, PhD,‡ Lenore J. Launer, PhD,‡ Sudha Seshadri, MD,‡ W.T. Longstreth, Jr., MD,‡ and St´ephanie Debette, MD‡, on behalf of the Stroke Genetics Network (SiGN), the International Stroke Genetics Consortium (ISGC), METASTROKE, Alzheimer’s Disease Genetics Consortium (ADGC), and the Neurology Working Group of the Cohorts for Heart and Aging Research in Genomic Epidemiology (CHARGE) Consortium
Neurology
®
2019;92:e486-e503. doi:10.1212/WNL.0000000000006851Correspondence Dr. Debette stephanie.debette@ u-bordeaux.fr or Dr. Longstreth [email protected]
*These authors contributed equally to this work. ‡These authors jointly supervised this work. Author affiliations appear on pages e496–e498. Coinvestigators are listed at links.lww.com/WNL/A800.
Go to Neurology.org/N for full disclosures. Funding information and disclosures deemed relevant by the authors, if any, are provided at the end of the article. The Article Processing Charge was funded by The University of Edinburgh.
This is an open access article distributed under the terms of the Creative Commons Attribution License 4.0 (CC BY), which permits unrestricted use, distribution, and reproduction in any medium, provided the original work is properly cited.
Abstract
Objective
To explore genetic and lifestyle risk factors of MRI-defined brain infarcts (BI) in large population-based cohorts.
Methods
We performed meta-analyses of genome-wide association studies (GWAS) and examined associations of vascular risk factors and their genetic risk scores (GRS) with MRI-defined BI and a subset of BI, namely, small subcortical BI (SSBI), in 18 population-based cohorts (n = 20,949) from 5 ethnicities (3,726 with BI, 2,021 with SSBI). Top loci were followed up in 7 population-based cohorts (n = 6,862; 1,483 with BI, 630 with SBBI), and we tested associations with related phenotypes including ischemic stroke and pathologically defined BI.
Results
The mean prevalence was 17.7% for BI and 10.5% for SSBI, steeply rising after age 65. Two loci showed genome-wide significant association with BI: FBN2, p = 1.77 × 10⁻⁸; and LINC00539/
ZDHHC20, p = 5.82 × 10⁻⁹. Both have been associated with blood pressure (BP)–related phenotypes, but did not replicate in the smaller follow-up sample or show associations with related phenotypes. Age- and sex-adjusted associations with BI and SSBI were observed for BP traits (p value for BI, p[BI]= 9.38 × 10⁻²⁵; p[SSBI]= 5.23 × 10⁻¹⁴for hypertension), smoking (p[BI]= 4.4 ×
10−10; p[SSBI]= 1.2 × 10⁻⁴), diabetes (p[BI]= 1.7 × 10⁻⁸; p[SSBI]= 2.8 × 10⁻³), previous
cardio-vascular disease (p[BI]= 1.0 × 10⁻¹⁸; p[SSBI]= 2.3 × 10⁻⁷), stroke (p[BI]= 3.9 × 10−69; p[SSBI]= 3.2 ×
10−24), and MRI-defined white matter hyperintensity burden (p[BI]= 1.43 × 10−157; p[SSBI] =
3.16 × 10−106), but not with body mass index or cholesterol. GRS of BP traits were associated with BI and SSBI (p≤ 0.0022), without indication of directional pleiotropy.
Conclusion
In this multiethnic GWAS meta-analysis, including over 20,000 population-based participants, we identified genetic risk loci for BI requiring validation once additional large datasets become available. High BP, including genetically determined, was the most significant modifiable, causal risk factor for BI.
Introduction
Brain infarcts (BI) detected on MRI are commonly seen in older persons, being described in 8%–28% of participants in population-based cohort studies.1Most MRI-defined BI are covert, not being associated with overt, clinical stroke symptoms.2,3Nonetheless, they cannot be considered silent or benign, as they are often associated with subtle neurologic symptoms and with increased risk of future stroke, cognitive decline, and in some studies dementia.4,5Most MRI-defined BI are small subcortical BI (SSBI), believed to be primarily caused by small vessel disease (SVD).6
Mechanisms and predictors of BI and SSBI remain incompletely understood. No genetic risk variants for BI and SSBI have been consistently identified to date,7–16and findings with vascular
risk factors have been inconsistent.1Partly reflecting this un-certainty, recommendations to direct clinicians on how to best manage covert MRI-defined BI are lacking.
To enhance understanding of risk factors for BI and SSBI, we first conducted a large meta-analysis of genome-wide
association studies (GWAS) from 18 population-based studies, comprising 20,949 participants from 5 ethnic groups, using the 1000 Genomes reference panel (1000G), more than doubling the size of a prior GWAS.16Second, we examined the association of vascular risk factors with BI and SSBI in this large sample, using both vascular risk factor measurements and their genetic risk scores (GRS).
Methods
Study design and samples
The meta-analyses included 18 prospective population-based cohorts participating in the Cohorts for Heart and Aging Research in Genomic Epidemiology (CHARGE) consortium (table e-1 and additional Methods e-1, doi.org/10.5061/ dryad.hk07677). Although the cohorts contributing partic-ipants are longitudinal, this study is cross-sectional, based on the analysis of BI and SSBI at one timepoint in the subset of cohort participants with brain MRI. These cohorts comprised 5 ethnic groups and ancestries: European (n = 17,956), Af-rican (n = 1,834), Hispanic (n = 737), Malay (n = 215), and
Chinese (n = 207). Some cohorts contributed to data for more than one ethnic group, resulting in a total of 23 datasets (tables e-1 to e-3, doi.org/10.5061/dryad.hk07677). Out of a total of 20,949 participants, 3,726 had MRI-defined BI. We did not exclude participants with a history of overt, clinically defined stroke prior to the MRI, except in 4 cohorts where patients with history of stroke were excluded by design. Three datasets did not contribute to the SSBI analysis either due to small numbers or absence of BI subtyping. Out of a total of 19,073 participants in the remaining 20 datasets, 3,533 had BI, of whom 2,021 (57.2%) had SSBI.
Variable definitions
Detailed MRI scanning protocols, as well as BI and SSBI definitions, for each study are described in table e-4 (doi.org/ 10.5061/dryad.hk07677). All protocols comprised at least T1, T2, and proton density orfluid-attenuated inversion recovery (FLAIR) sequences. On MRI, BI were defined as an area of abnormal signal intensity lacking mass effect with a size ≥3–4 mm; in the white matter, they were required to be hypointense on T1-weighted images, approaching the hypo-intensity of CSF, to distinguish them from diffuse white matter lesions; and they were distinguished from dilated perivascular spaces based on their irregular shape, presence of a hyperintense rim in FLAIR, and absence of a typical vascular shape following the orientation of perforating vessels.17SSBI corresponded to BI with a size <15–20 mm, located in the basal ganglia, the white matter, or the brainstem. Participants with large BI or BI located in the cerebral cortex or cerebellum were excluded from analyses of SSBI. We also measured burden of white matter hyperintensities (WMH), a quantita-tive MRI marker of SVD, corresponding to signal abnormal-ities of variable size in the white matter, appearing as hyperintensity on T2-weighted or FLAIR images, but without cavitation. Details of WMH measurements have been de-scribed previously.18
Vascular risk factors
Vascular risk factor levels measured closest to brain MRI ac-quisition were used. Hypertension was defined as systolic blood pressure (SBP)≥140 mm Hg or diastolic blood pres-sure (DBP)≥90 mm Hg or use of one or more blood pressure (BP)–lowering medications. We defined pulse pressure (PP) as the difference between SBP and DBP and mean arterial pressure (MAP) as DBP + 1/3 × PP. Diabetes was defined as a previous diagnosis of diabetes, a fasting plasma glucose >7.0 mmol/L, or antidiabetic drug use. Fasting serum total
cholesterol, high-density lipoprotein (HDL) cholesterol, and triglycerides were measured using enzymatic methods. Low-density lipoprotein (LDL) cholesterol was calculated using the Friedewald formula. Body mass index (BMI) was defined as the ratio of weight (kg) to the square of height (m). Active smoking was defined according to study-specific criteria. History of overt, clinically defined stroke and other cardio-vascular events was based on ongoing surveillance prior to brain MRI acquisition in most studies since participant re-cruitment had started prior to the initial brain MRI. In studies that had brain MRI scanning at the initial visit, the history and examination at this visit were used to identify prior overt, clinically defined stroke. History of cardiovascular events in-cluded history of angina, myocardial infarction, cardiac bypass surgery, angioplasty, or peripheral vascular disease.
Genotypes
All participating discovery cohorts had genome-wide geno-types imputed on the 1000G (phase 1, version 3).19 Genome-wide genotyping platforms, quality control measures, and imputation parameters used in each study are presented in tables e-5–e-7 (doi.org/10.5061/dryad.hk07677).
Genome-wide association analyses with BI and small subcortical BI
For genome-wide association analyses with BI and SSBI, each study performed logistic regression under an additive genetic model after adjusting for age, sex, principal components of population stratification, and additional study-specific cova-riates, such as study site or family structure, as needed (ad-ditional Methods e-2, doi.org/10.5061/dryad.hk07677, for centralized quality control description). Our primary multi-ethnic GWAS meta-analysis was performed using MANTRA, based on a Bayesian framework.20In secondary analyses, we also ran the multiethnic GWAS meta-analysis with 2 alter-native methods (additional Methods e-2, doi.org/10.5061/ dryad.hk07677): (1) using fixed effects inverse variance weighting with METAL21,22and (2) using the random effects meta-analysis model implemented in METASOFT.23During meta-analysis, genomic control correction was applied to the individual studies and ethnic-specific results to remove any residual inflation of association statistics. We did not observe any systematic inflation of association statistics (figure e-1, doi.org/10.5061/dryad.hk07677). Statistical measures from MANTRA, the primary meta-analysis method, were used to define genome-wide significance (Log10 of Bayesian factor
[L10BF] > 6)24 and to choose single nucleotide
Glossary
1000G= 1000 Genomes reference panel; BI = brain infarcts; BMI = body mass index; BP = blood pressure; DBP = diastolic blood pressure; FLAIR =fluid-attenuated inversion recovery; GRS = genetic risk scores; GWAS = genome-wide association studies; HDL = high-density lipoprotein; IS = ischemic stroke; IS-SVD = small vessel disease subtype of ischemic stroke; IVW = inverse-variance weighting; L10BF= Log10of Bayesian factor; LD = linkage disequilibrium; LDL = low-density lipoprotein;
MAP= mean arterial pressure; PP = pulse pressure; SNP = single nucleotide polymorphism; SBP = systolic blood pressure; SSBI= small subcortical brain infarcts; SVD = small vessel disease; WMH = white matter hyperintensities.
polymorphisms (SNPs) for follow-up (L10BF > 4.5) in either
the BI or SSBI meta-analysis. Details of functional annotation of top loci are provided in additional Methods e-3 (doi.org/ 10.5061/dryad.hk07677).
Follow-up and extension
For follow-up and extension studies, genotypes imputed to the 1000G reference panel were available in most instances for in silico look-up of the selected risk variants. Three follow-up studies performed de novo genotyping of the top 6 loci (additional Methods e-1, doi.org/10.5061/dryad. hk07677). The lead variant (with lowest p value) was gen-otyped at each suggestive or genome-wide significant locus, and if not feasible, another variant in strong linkage dis-equilibrium (LD, r2 > 0.8) was genotyped. A p value <0.0083, correcting for 6 loci, was considered significant evidence for replication.
The follow-up sample, in which we sought to confirm asso-ciations observed in the discovery analysis, included 6,862 participants, of whom 1,483 had BI and 630 had SSBI, from 6 community-based studies of European origin and one of Japanese origin (table e-1, doi.org/10.5061/dryad.hk07677). As an extension, to test whether genetic variants associated with MRI-defined BI or SSBI in the discovery analysis are also associated with correlated phenotypes, wefirst explored their association with ischemic stroke (IS) overall and the small vessel disease subtype (IS-SVD) when available in 4 collab-orative studies (table e-1, doi.org/10.5061/dryad.hk07677). Second, we explored whether genetic variants associated with MRI-defined BI and SSBI were associated with neuro-pathologically defined BI based on 2,940 brain autopsies in participants without dementia from the Alzheimer’s Disease Genetics Consortium (ADGC). Participants with large infarcts or lacunes (n = 857, 29%) were compared to partic-ipants without any infarcts or having only microscopic infarcts (n = 2,083).25
We calculated power of the follow-up and extension studies using Quanto V1.2.3 (biostats.usc.edu/software; table e-8 and figure e-2, doi.org/10.5061/dryad.hk07677).
Association of vascular risk factors with BI and SSBI
Individual studies performed logistic regression to test for association of vascular risk factor measurements with pres-ence or abspres-ence of at least one BI or SSBI. Analyses were performed with and without adjustments for age and sex. Analyses with BP or lipid traits as the main independent variable were additionally adjusted for treatment with disease-specific medications, and association analyses with fasting plasma glucose were limited to participants without type 2 diabetes. Except for WMH burden, the regression coef-ficients and standard errors for risk factors in the individual studies belonging to one ethnic group were combined us-ing fixed-effects inverse variance-weighted meta-analysis
and subsequently the betas and standard errors obtained in each ethnic group were combined using fixed-effects in-verse variance-weighted meta-analysis, in the absence of heterogeneity (p < 1 × 10⁻⁶), to derive the multiethnic meta-analysis estimates. For WMH burden, the statistics were combined using the Z score–based sample size weighted meta-analysis as WMH burden was measured on different scales in participating studies.18
We then explored whether genetic variants previously shown in published GWAS to be associated with specific vascular risk factors were, in aggregate, also associated with BI and SSBI. This approach was selected to assess to what extent genetically determined vascular risk factor levels are associated with BI and SSBI and to provide evidence for a causal relation between a given vascular risk factor and risk of BI or SSBI, provided that Mendelian randomization assumptions are fulfilled.26 We combined known genetic
risk variants for each individual vascular risk factor into a weighted GRS, using effect estimates from the largest published GWAS of that risk factor as weights. We then tested for association of these GRS with BI and SSBI using the inverse-variance weighting (IVW) method. Construc-tion of the GRS, selecConstruc-tion of variants for the GRS analysis, as well as effect estimates used as weights are detailed in ad-ditional Methods e-4 and tables e-9–e-12 (doi.org/10. 5061/dryad.hk07677). For significant GRS associations with BI or SSBI, we further conducted sensitivity analyses using the MR-Egger method implemented as an R package (TwoSampleMR),27 which unlike the IVW method esti-mates the intercept term as part of the analysis. An intercept term significantly differing from zero suggests the presence of directional (unbalanced) pleiotropy, meaning that the pleiotropic effects of genetic variants are not balanced about the null.27We used a conservative significance threshold of p < 0.05 for the intercept.
After Bonferroni correction for 12 independent vascular phenotypes tested for association with BI and SSBI, p < 0.0042 was considered significant for associations with vas-cular risk factor measurements or GRS. The number of in-dependent vascular phenotypes, taking into account correlation between the phenotypes considered, was esti-mated based on individual level data from the 3C-Dijon study using the online tool matSpDlite (neurogenetics.qimr-berghofer.edu.au/matSpDlite/).
Standard protocol approvals, registrations, and patient consents
Institutional review boards approved all of these studies, and all participants provided informed consent.
Data availability
Summary statistics of the top SNPs are available from Dryad for both BI and SSBI. Other data that support thefindings of this study are available from the corresponding authors upon reasonable request.
Results
In this large population-based dataset comprising 18 cohort studies, the frequency of MRI-defined BI ranged from 4% to 38% in participating cohorts (table e-1, doi.org/10.5061/ dryad.hk07677). A description of demographic characteristics in all participants with BI (n = 3,726), with SSBI (n = 2,021), and without BI (n = 17,223) is provided in tables e-2 and e-3 (doi.org/10.5061/dryad.hk07677) for individual studies. Participants with BI and SSBI were on average 6 years older and more often men compared to those without BI. In age-stratified analyses, the prevalence of BI and SSBI increased with age, most prominently beyond age 65, after which a 25.8% (range 13.9%–37.0%) increment in BI prevalence was observed compared to participants younger than 65 years (figure 1). Overall, the prevalence of BI ranged from less than 5% before age 50 to over 30% beyond age 80, with similar findings when we analyzed men and women separately (fig-ures e-3 and e-4, doi.org/10.5061/dryad.hk07677). Only 11% of those with BI and 9% of those with SSBI had a history of stroke (12.5% and 9.8% when removing cohorts that excluded participants with history of stroke by design); hence, the vast majority of MRI-defined BI were covert.
Genome-wide association plots for GWAS of BI and SSBI are displayed in figures e-5 and e-6 (doi.org/10.5061/dryad. hk07677). Two loci were associated with risk of BI at genome-wide significant level (L10BF > 6): rs39938 in FBN2 (chr5q23)
and rs12583648 in LINC00539 and near ZDHHC20 (chr13q12). In addition, 2 SNPs were associated with BI at
a suggestive level of significance (L10BF > 4.5): rs12373108 near
CALB2/ZNF23 (chr16q22) and rs74587705 in SV2B (chr15q26) (table 1). No genome-wide significant association was observed for SSBI, but 2 loci reached the threshold for suggestive association (L10BF > 4.5): rs9371194 in PLEKHG1
(chr6q25) and rs75889566 in FRMD1 (chr6q27, table 1). These 6 loci were taken forward for the follow-up stage (table 2). For all SNPs reaching Log10BF > 4.5 in the discovery
stage, association statistics are shown in table e-13 andfigure e-7 (doi.org/10.5061/dryad.hk07677).
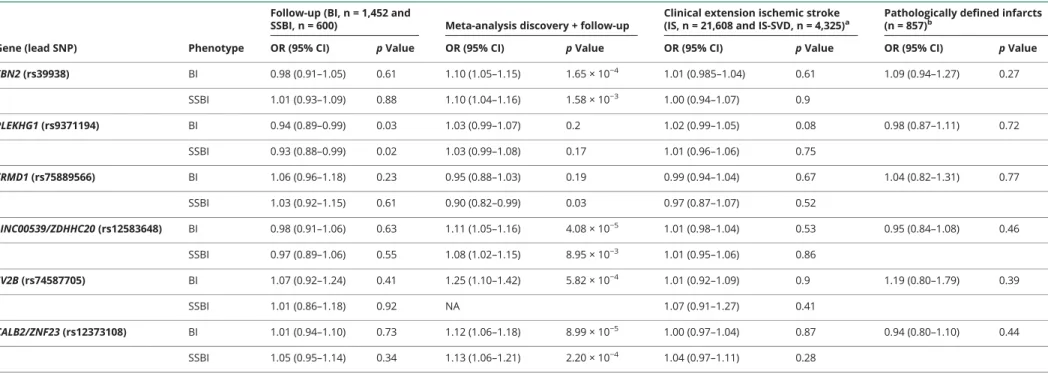
In the substantially smaller population-based follow-up studies, we could not replicate the 2 genome-wide signifi-cant or the 4 suggestive loci associated with BI or SSBI (table 2). Of the 6 loci that we followed up, we had limited power for 2 of the loci for BI (52%) and 4 of the loci for SSBI (50%–58%) (table e-8, doi.org/10.5061/dryad.hk07677). Power estimates in the follow-up study are even lower when accounting for the winner’s curse phenomenon, which leads to inflated effect estimates in the discovery cohort.28 One
suggestive locus for SSBI (PLEKHG1) showed nominal as-sociation with BI and SSBI in the follow-up studies (pBI= 0.03
and pSSBI= 0.02), but in the opposite direction (table 2).
Likewise, none of the genome-wide significant or suggestive loci for BI and SSBI showed association with IS (overall or IS-SVD) or pathologically defined BI in the extension studies after correcting for multiple testing (table 2 and table e-14, doi.org/10.5061/dryad.hk07677). Whereas the sample size
Figure 1Prevalence of MRI-defined brain infarcts (BI) and small subcortical brain infarcts (SSBI) by different age groups
CI = confidence interval.
Table 1Loci reaching Log10of Bayesian factor (L10BF) >4.5 in the discovery stage of the genome-wide association studies with brain infarcts (BI) or small subcortical brain infarcts (SSBI) Genes Lead SNP (chr:position) Chr region Function (distance from gene) Minor allele frequency Phenotype Multiethnic fixed-effects meta-analysis Multiethnic random-effects meta-analysis Bayesian-based approach of MANTRA Cases/ controls, n OR (95% CI) pFE p-het pRE L10BF p-het
FBN2 rs39938 (5:127663579) 5q23 Intronic T (0.21) BI 1.21 (1.13–1.30) 1.77 × 10⁻⁸a 0.42 4.83 × 10⁻⁸ 6.52a 0.31 3,603/16,464 SSBI 1.23 (1.13–1.34) 3.93 × 10⁻⁶ 0.58 1.43 × 10⁻⁵ 4.28 0.25 1975/13,260 PLEKHG1 rs9371194 (6:151034730) 6q25 Intronic T (0.46) BI 1.12 (1.06–1.18) 5.94 × 10⁻⁵ 0.47 4.28 × 10⁻⁴ 3.10 0.16 3,726/17,223 SSBI 1.19 (1.11–1.28) 1.90 × 10⁻⁶ 0.50 3.63 × 10⁻⁵ 4.54 0.18 2,112/15,432 FRMD1 rs75889566 (6:168476856) 6q27 Intronic T (0.08) BI 0.82 (0.73–0.92) 7.71 × 10⁻⁴ 0.47 2.03 × 10⁻³ 1.99 0.27 3,181/12,731 SSBI 0.65 (0.55–0.78) 1.82 × 10⁻⁶ 1.00 4.40 × 10⁻⁵ 4.63 0.17 1,584/8,538 LINC00539/ZDHHC20 rs12583648 (13:21900055) 13q12 Intronic C (0.33) BI 1.21 (1.13–1.29) 5.82 × 10⁻⁹a 0.29 2.33 × 10⁻⁷ 7.00a 0.22 3,685/17,085
SSBI 1.20 (1.10–1.30) 2.95 × 10⁻⁵ 0.26 7.66 × 10⁻⁵ 3.07 0.30 1985/14,705 SV2B rs74587705 (15:91764992) 15q26 Intronic T (0.03) BI 1.85 (1.46–2.34) 3.36 × 10⁻⁷ 0.62 5.69 × 10⁻⁶ 5.25 0.29 2,291/6,072 SSBIb — — — — — — — CALB2/ZNF23 rs12373108 (16:71432507) 16q22 Intergenic (8.1 kb) T (0.17) BI 1.21 (1.12–1.31) 5.02 × 10⁻⁷ 0.66 1.53 × 10⁻⁵ 4.90 0.21 3,418/15,607 SSBI 1.23 (1.12–1.36) 1.40 × 10⁻⁵ 0.47 1.37 × 10⁻⁴ 3.61 0.18 1,851/12,794 Abbreviations: chr = chromosome (chromosomal positions are based on GRCh37); CI = confidence interval; FE = fixed effect; OR = odds ratio;p-het = p for heterogeneity; RE = random effect; SNP = single nucleotide polymorphism.
aLoci reaching genome-wide significance, L 10BF >6.
bDue to the low minor allele frequency of this variant and the small number of cases with SSBI, this variant was excluded for association analyses with SSBI after applying the filter on“2 × minor allele frequency × imputation
quality × number of cases≤10.”
Neurology. org/N Neurology | Volume 92, Number 5 | January 29, 2019 e491
Table 2 Follow-up and clinical extension of loci reaching Log10of Bayesian factor (L10BF) >4.5 in the discovery stage of the genome-wide association studies
Gene (lead SNP) Phenotype
Follow-up (BI, n = 1,452 and
SSBI, n = 600) Meta-analysis discovery + follow-up
Clinical extension ischemic stroke (IS, n = 21,608 and IS-SVD, n = 4,325)a
Pathologically defined infarcts (n = 857)b
OR (95% CI) p Value OR (95% CI) p Value OR (95% CI) p Value OR (95% CI) p Value FBN2 (rs39938) BI 0.98 (0.91–1.05) 0.61 1.10 (1.05–1.15) 1.65 × 10⁻⁴ 1.01 (0.985–1.04) 0.61 1.09 (0.94–1.27) 0.27 SSBI 1.01 (0.93–1.09) 0.88 1.10 (1.04–1.16) 1.58 × 10⁻³ 1.00 (0.94–1.07) 0.9 PLEKHG1 (rs9371194) BI 0.94 (0.89–0.99) 0.03 1.03 (0.99–1.07) 0.2 1.02 (0.99–1.05) 0.08 0.98 (0.87–1.11) 0.72 SSBI 0.93 (0.88–0.99) 0.02 1.03 (0.99–1.08) 0.17 1.01 (0.96–1.06) 0.75 FRMD1 (rs75889566) BI 1.06 (0.96–1.18) 0.23 0.95 (0.88–1.03) 0.19 0.99 (0.94–1.04) 0.67 1.04 (0.82–1.31) 0.77 SSBI 1.03 (0.92–1.15) 0.61 0.90 (0.82–0.99) 0.03 0.97 (0.87–1.07) 0.52 LINC00539/ZDHHC20 (rs12583648) BI 0.98 (0.91–1.06) 0.63 1.11 (1.05–1.16) 4.08 × 10⁻⁵ 1.01 (0.98–1.04) 0.53 0.95 (0.84–1.08) 0.46 SSBI 0.97 (0.89–1.06) 0.55 1.08 (1.02–1.15) 8.95 × 10⁻³ 1.01 (0.95–1.06) 0.86 SV2B (rs74587705) BI 1.07 (0.92–1.24) 0.41 1.25 (1.10–1.42) 5.82 × 10⁻⁴ 1.01 (0.92–1.09) 0.9 1.19 (0.80–1.79) 0.39 SSBI 1.01 (0.86–1.18) 0.92 NA 1.07 (0.91–1.27) 0.41 CALB2/ZNF23 (rs12373108) BI 1.01 (0.94–1.10) 0.73 1.12 (1.06–1.18) 8.99 × 10⁻⁵ 1.00 (0.97–1.04) 0.87 0.94 (0.80–1.10) 0.44 SSBI 1.05 (0.95–1.14) 0.34 1.13 (1.06–1.21) 2.20 × 10⁻⁴ 1.04 (0.97–1.11) 0.28
Abbreviations: BI = brain infarcts; CI = confidence interval; OR = odds ratio; SNP = single nucleotide polymorphism; SSBI = small subcortical brain infarcts. Values are OR (95% CI) with respect to the minor allele followed byp value of association.
aFor ischemic stroke, meta-analysis results of METASTROKE-IS, CHARGE-IS, and SiGN-IS are presented. For ischemic stroke due to small vessel disease, meta-analysis results of METASTROKE-IS-SVD, Young Lacunar Stroke DNA
Resource-SVD, and SiGN-IS-SVD are presented.
bData presented for the following SNPs are for their proxies: rs75889566 = rs902393 (r2= 0.96), rs12583648 = rs12584792 (r2= 0.96), rs74587705 = rs7170681 (r2= 0.67).
e492 Neurology | Volume 92, Number 5 | January 29, 2019 Neurolo gy.org/N
for overall IS and IS-SVD was relatively large, it was limited for pathologically defined BI, and power was insufficient for 4 of the loci (25%–70%) (table e-8, doi.org/10.5061/dryad. hk07677).
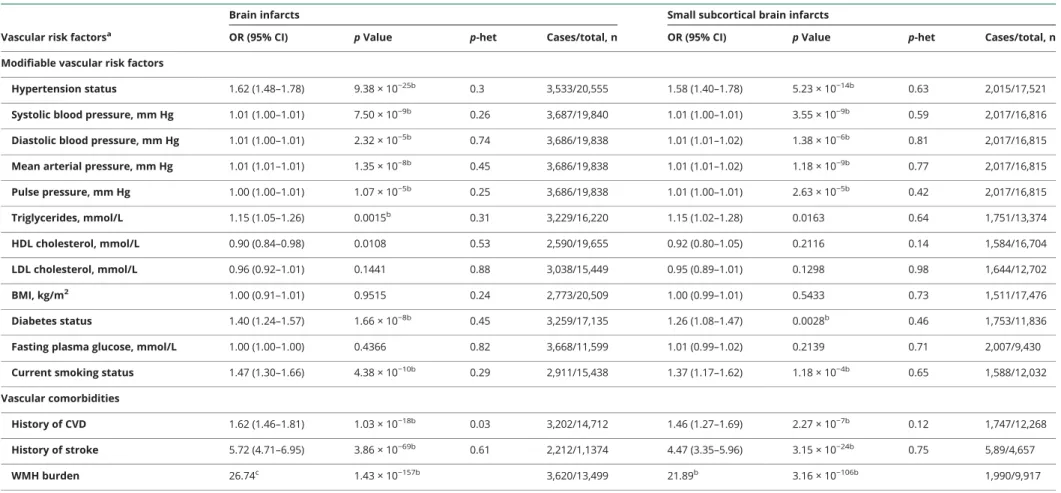
Associations of vascular risk factors with risk of BI or SSBI adjusted for age and sex are presented in table 3 (for un-adjusted results, see table e-15, doi.org/10.5061/dryad. hk07677). Both BI and SSBI were significantly associated with all BP indices, the lowest p value being observed for SBP and MAP. Smoking and diabetes were also associated with both BI and SSBI. Triglycerides were significantly associated with BI only. We did not observe significant associations with levels of HDL cholesterol, LDL cholesterol, BMI, or fasting plasma glucose in nondiabetic participants. Both BI and SSBI were associated with history of cardiovascular disease and history of stroke. The most significant association by far was observed with WMH burden on brain MRI, both for BI and SSBI. As hypertension is an important risk factor for WMH as well, we additionally adjusted the regression model for hy-pertension to rule out a confounding effect by this variable; however, the association became even more significant (p = 5.71 × 10−172for BI and p = 4.47 × 10−114for SSBI) (table e-16, doi.org/10.5061/dryad.hk07677). No significant het-erogeneity was seen for these associations across participating studies.
When exploring the relation of weighted genetic risk scores for vascular risk factors with BI and SSBI, we found that GRS for SBP and MAP were significantly associated with increased risk of BI and SSBI after correction for multiple testing (table 4). In sensitivity analyses using MR-Egger regression, evidence for directional pleiotropy was lacking for these associations between SBP or MAP GRS and BI or SSBI (p intercept >0.36). GRS for DBP, BMI, coronary artery disease, WMH burden, and IS were nominally associated with BI (p < 0.05, table 4), but these associations did not survive correction for multiple testing.
Discussion
This multiethnic meta-analysis comprising over 20,000 community participants provides noteworthy insight into risk factors for MRI-defined brain infarcts. The described BI dis-tributions across different age groups and by sex may also serve as a reference for comparison with BI and SSBI fre-quency in other settings. Of note, about 90% of BI were covert, not being associated with a history of stroke. In this multiethnic GWAS of BI and SSBI, we identified 2 genome-wide significant risk loci for BI, FBN2 on chr5q23 and LINC00539/ZDHHC20 on chr13q12, although these could not be replicated in a smaller follow-up sample. We further describe the association of MRI-defined BI with vascular risk factors, combining the vast majority of population-based co-hort studies with BI and SSBI measurements available. We find high BP, both phenotypically expressed high BP and
genetically determined risk for high BP, to be the most sig-nificant modifiable risk factor for BI. No association with cholesterol levels or BMI was found.
To identify novel genetic risk loci for MRI-defined BI and SSBI, we have more than doubled the sample size compared to the previously published GWAS of MRI-defined BI,16 used
im-puted genotypes based on the 1000G reference panel to in-crease the marker coverage, and included samples from 5 ethnicities for a broader representation of individuals from different origins. Moreover, we studied both BI and SSBI, while only BI were analyzed in the previously published GWAS meta-analysis.16Our inability to replicate the genome-wide signifi-cant and suggestivefindings could reflect false-positive results but may also be explained by insufficient power in the follow-up stage (table e-8, doi.org/10.5061/dryad.hk07677). Further studies on larger samples with MRI-defined BI are required to confirm or refute these findings. Moreover, while we could not provide evidence for an association of genome-wide significant and suggestive risk loci for BI and SSBI with IS, IS-SVD, or pathologically defined BI, this inability could reflect differences in the biology underlying these phenotypes, as well as limited power in the extension studies.
The 2 loci that crossed the genome-wide significance threshold, while requiring confirmation in larger independent samples, do harbor plausible biological candidates. Fibrillin2 (FBN2) encodes a protein that is part of the connective tissue microfibrils and elastic fiber assembly of the cell.29Rare and
common variants in FBN2 have been associated with age-related macular degeneration.30 Recent studies have also implicated common variants in FBN2 to be associated with SBP,31 although the variants differ (rs6595838-SBP and rs39938-BI, r2= 0.017). The LINC00539/ZDHHC20 locus was a suggestive hit in a GWAS of adverse metabolic response to hydrochlorothiazide, a drug commonly used to treat hy-pertension.32The lead SNP in the region could also influence the expression of the long noncoding RNA LINC00539 (table e-17, doi.org/10.5061/dryad.hk07677).
Ourfindings provide definitive evidence for a major and pre-dominant association of increasing BP levels with increased risk of BI and SSBI.1,33Beside significant associations with hyper-tension, a continuous association was observed for increasing levels of all BP measurements (SBP, DBP, PP, MAP), consis-tent with elevated BP being the major modifiable risk factor for BI, as is the case for overt, clinically defined IS.34–36The
im-portance and causal nature of the relation between high BP and risk of BI and SSBI is further supported by the significant association of BP genetic risk scores, for SBP and MAP, with increased risk of BI, especially SSBI, with no indication of directional pleiotropy using the MR-Egger approach.27 Previous publications on the association of BI and SSBI with vascular risk factors other than elevated BP were inconsistent.1,33,37Our study provides evidence for a signifi-cant association of current smoking and diabetes with risk of
Table 3 Association of vascular risk factors with MRI-defined brain infarcts and small subcortical brain infarcts
Vascular risk factorsa
Brain infarcts Small subcortical brain infarcts
OR (95% CI) p Value p-het Cases/total, n OR (95% CI) p Value p-het Cases/total, n Modifiable vascular risk factors
Hypertension status 1.62 (1.48–1.78) 9.38 × 10⁻²⁵b 0.3 3,533/20,555 1.58 (1.40–1.78) 5.23 × 10⁻¹⁴b 0.63 2,015/17,521 Systolic blood pressure, mm Hg 1.01 (1.00–1.01) 7.50 × 10⁻⁹b 0.26 3,687/19,840 1.01 (1.00–1.01) 3.55 × 10⁻⁹b 0.59 2,017/16,816 Diastolic blood pressure, mm Hg 1.01 (1.00–1.01) 2.32 × 10⁻⁵b 0.74 3,686/19,838 1.01 (1.01–1.02) 1.38 × 10⁻⁶b 0.81 2,017/16,815 Mean arterial pressure, mm Hg 1.01 (1.01–1.01) 1.35 × 10⁻⁸b 0.45 3,686/19,838 1.01 (1.01–1.02) 1.18 × 10⁻⁹b 0.77 2,017/16,815 Pulse pressure, mm Hg 1.00 (1.00–1.01) 1.07 × 10⁻⁵b 0.25 3,686/19,838 1.01 (1.00–1.01) 2.63 × 10⁻⁵b 0.42 2,017/16,815 Triglycerides, mmol/L 1.15 (1.05–1.26) 0.0015b 0.31 3,229/16,220 1.15 (1.02–1.28) 0.0163 0.64 1,751/13,374 HDL cholesterol, mmol/L 0.90 (0.84–0.98) 0.0108 0.53 2,590/19,655 0.92 (0.80–1.05) 0.2116 0.14 1,584/16,704 LDL cholesterol, mmol/L 0.96 (0.92–1.01) 0.1441 0.88 3,038/15,449 0.95 (0.89–1.01) 0.1298 0.98 1,644/12,702 BMI, kg/m2 1.00 (0.91–1.01) 0.9515 0.24 2,773/20,509 1.00 (0.99–1.01) 0.5433 0.73 1,511/17,476 Diabetes status 1.40 (1.24–1.57) 1.66 × 10⁻⁸b 0.45 3,259/17,135 1.26 (1.08–1.47) 0.0028b 0.46 1,753/11,836
Fasting plasma glucose, mmol/L 1.00 (1.00–1.00) 0.4366 0.82 3,668/11,599 1.01 (0.99–1.02) 0.2139 0.71 2,007/9,430 Current smoking status 1.47 (1.30–1.66) 4.38 × 10⁻¹⁰b 0.29 2,911/15,438 1.37 (1.17–1.62) 1.18 × 10⁻⁴b 0.65 1,588/12,032 Vascular comorbidities
History of CVD 1.62 (1.46–1.81) 1.03 × 10⁻¹⁸b 0.03 3,202/14,712 1.46 (1.27–1.69) 2.27 × 10⁻⁷b 0.12 1,747/12,268 History of stroke 5.72 (4.71–6.95) 3.86 × 10−69b 0.61 2,212/1,1374 4.47 (3.35–5.96) 3.15 × 10⁻²⁴b 0.75 5,89/4,657 WMH burden 26.74c 1.43 × 10−157b 3,620/13,499 21.89b 3.16 × 10−106b 1,990/9,917
Abbreviations: BMI = body mass index; CI = confidence interval; CVD = cardiovascular disease; HDL = high-density lipid; LDL = low-density lipid; OR = odds ratio;p-het = p for heterogeneity; WMH = white matter hyperintensity.
aAll association analyses presented were adjusted for sex and age and meta-analyses estimates presented are from fixed effects inverse variance weighted meta-analyses, except for WMH burden. Association analyses for
blood pressure factors were additionally adjusted for usage of blood pressure–lowering drugs. Association analyses for lipid factors were additionally adjusted for usage of lipid-lowering drugs. Association analysis for glucose was performed only on participants without type 2 diabetes.
bAssociations significant after correcting for the number of independent phenotypes (n = 12,p < 0.0042).
cMeta-analyses for WMH burden were performed using sample size weighted meta-analysis, which yieldedZ scores as effect estimates and not ORs with CIs; this is because WMH burden was measured on different scales in
participating studies (quantitative measures in mL in all but 2 studies and semiquantitative measures on a 10-grade scale in the Atherosclerosis Risk in Communities study and the Cardiovascular Health Study [Additional Methods 1, doi.org/10.5061/dryad.hk07677]). e494 Neurology | Volume 92, Number 5 | January 29, 2019 Neurolo gy.org/N
BI and SSBI, while no association with BMI and cholesterol could be demonstrated, despite the very large sample size. Thesefindings are consistent with epidemiologic data on IS.35 Interestingly, in contrast with cholesterol levels, a significant association of increasing triglyceride levels with BI risk was observed, although for SSBI the association did not withstand correction for multiple testing. Inconsistent results have been reported regarding association of triglycerides with overt, clinically defined IS,38,39but the present results are in line with
evidence of an association in older community-dwelling per-sons between high triglyceride levels and WMH burden, an-other MRI marker of SVD.40
As previously described, we show a significant association of WMH burden with BI and SSBI, reaching p < 10−100in this
study. Surprisingly, shared genetic variation among the top loci for WMH burden and BI was limited. While this observation could be due to lack of power, it could also suggest that WMH and BI share more environmental than genetic risk factors. A more comprehensive search for shared genetic variation be-tween WMH burden and BI or SSBI at the genome-wide level using the LD score regression method41 could not be per-formed in the present study due to low variance in the BI GWAS, also hampering the calculation of BI heritability using the same method. Of note, based on estimates from previously published family-based studies, heritability for SSBI was de-scribed to be low at 29%, in contrast with a moderate to high heritability for WMH burden at 49%–80%.42–44Hypertension
is a major risk factor for WMH as well, and a BP GRS was also significantly associated with WMH burden in a prior study.18
Table 4 Association of genetic risk scores (GRS) for vascular risk factors with brain infarcts and small subcortical brain infarcts
Phenotype
Brain infarcts Small subcortical brain infarcts
SNPs, na OR (95% CI) p Value SNPs, na OR (95% CI) p Value
Modifiable vascular risk factors
Systolic blood pressure,GRS-1b 94 1.03 (1.01–1.04) 0.00053c 93 1.03 (1.01–1.05) 0.0014c
Systolic blood pressure,GRS-2d 72 1.03 (1.01–1.05) 0.00036c 71 1.03 (1.01–1.06) 0.0014c
Diastolic blood pressure,GRS-1b 109 1.03 (1.01–1.06) 0.011 109 1.05 (1.01–1.08) 0.0070
Diastolic blood pressure,GRS-2d 71 1.04 (1.01–1.07 0.0142 70 1.05 (1.02–1.09) 0.0057
Pulse pressure,GRS-1b 56 1.02 (0.99–1.05) 0.1234 55 1.01 (0.98–1.05) 0.4724
Pulse pressure,GRS-2d 23 1.03 (1.00–1.06) 0.0695 23 1.02 (0.98–1.07) 0.2969
Mean arterial pressure 30 1.06 (1.02–1.09) 0.0022c 30 1.09 (1.04–1.14) 0.00032c
Triglycerides 38 1.07 (0.89–1.29) 0.4578 37 1.21 (0.95–1.54) 0.1252 HDL cholesterol 71 0.95 (0.82–1.10) 0.4761 71 0.86 (0.71–1.05) 0.1373 LDL cholesterol 52 1.11 (0.96–1.29) 0.1633 52 1.09 (0.90–1.33) 0.3598 Body mass index 76 0.76 (0.59–0.99) 0.0412 76 0.81 (0.58–1.14) 0.2354 Type 2 diabetes 51 1.06 (0.97–1.16) 0.1710 51 1.11 (0.99–1.25) 0.0653 Fasting plasma glucose 36 1.44 (0.96–2.15) 0.0777 36 1.41 (0.83–2.39) 0.2038 Smoking (cigarettes per day) 3 1.00 (0.95–1.05) 0.9921 3 1.07 (1.00–1.14) 0.0624 Smoking (ever vs never smokers) 1 0.96 (0.89–1.03) 0.2769 1 0.95 (0.86–1.05) 0.3007 Smoking (former vs current smokers) 1 1.01 (0.91–1.13) 0.8028 1 1.03 (0.89–1.19) 0.6767 Vascular comorbidities
Ischemic stroke 12 1.49 (1.12–1.97) 0.0057 12 1.36 (0.94–1.97) 0.1011 Coronary artery disease 57 1.12 (1.00–1.25) 0.0441 57 1.08 (0.93–1.24) 0.3169 WMH burden 8 1.41 (1.01–1.96) 0.0416 8 1.49 (0.97–2.30) 0.0702 Abbreviations: CI = confidence interval; HDL = high-density lipoprotein; LDL = low-density lipoprotein; OR = odds ratio; SNP = single nucleotide polymorphism; WMH = white matter hyperintensity.
aNumber of independent SNPs (r2< 0.01).
bComprises only risk variants for systolic blood pressure, diastolic blood pressure, and pulse pressure that were previously reported as genome-wide
significant and validated in the UK biobank according to prespecified criteria.
cAssociations significant after correcting for the number of independent phenotypes (n = 12,p < 0.0042).
dComprises, in addition to previously reported variants, all novel variants identified as genome-wide significant for the first time in the UK biobank (Additional
methods 4, doi.org/10.5061/dryad.hk07677).
However, the association of WMH burden with BI and SSBI was still significant after adjusting for hypertension status (table 3), or for SBP levels and BP-lowering treatment (table e-16, doi. org/10.5061/dryad.hk07677), suggesting that BP is not the only mediator of this association.
An important strength of the present study is that we have gathered nearly all large population-based studies with MRI-based identification of BI, genome-wide genotypes, and detailed vascular risk factor and comorbidity assessment, totaling over 20,000 participants covering 5 ethnic groups. Despite the unprecedented sample size, we were underpow-ered for the discovery of novel, robust genetic risk loci and even more so for the follow-up of genome-wide significant findings. Our ability to discover robust genetic risk variants may also have been hampered by the heterogeneity in BI and SSBI etiology, even though SVD is likely the predominant mechanism,45and by some heterogeneity in the way BI and SSBI have been measured in participating studies. Finally, although the majority of participants had covert BI, 10% had a history of overt, clinically defined stroke, but including both covert and overt BI also enables a better representation of the spectrum of participants with MRI-defined BI in the general population. Whereas history of stroke was more common in participants with BI than those without, we do not believe that this inclusion has driven the associations we observed, given both the small number of participants with a stroke history and the significance level of the observed associations. Moreover, in this population-based setting, determining whether an MRI-defined BI could be attributed to the history of clinically defined stroke was not always possible.
In clinical practice, MRI-defined BI are commonly seen on brain MRI scans performed for various reasons in older per-sons. They have been shown to be powerful predictors of in-cident stroke and inin-cident dementia.1,4,46Hence BI represent an important marker for detection of high-risk individuals and initiation of preventive interventions. However, no randomized trials and no recommendations are currently available for the management of covert MRI-defined BI. The observational ev-idence is overwhelming for a strong causal relation between high BP and risk of BI and SSBI. A randomized trial will be needed to decide if persons with MRI-defined BI will benefit from more intensive BP-lowering strategies than is recom-mended currently for primary prevention.
This multiethnic, population-based study on 20,949 partic-ipants sheds important new light on susceptibility factors of MRI-defined brain infarcts, a marker of covert vascular brain injury commonly observed in older persons.
Author a
ffiliations
From the Bordeaux Population Health Research Center (G.C., M.S., S.K., S. Schilling, C.T., S.D.), INSERM U1219, Groupe d'Imagerie Neurofonctionnelle CNRS/CEAU5293
(B.M.), and University of Bordeaux (G.C., C.T., M.S., S.K., S. Schilling, S.D., B.M.), Department of Neurology, Bordeaux University Hospital (S.D.), Bordeaux, France; Departments of Epidemiology (H.H.H.A., M.W.V., A.H., M.A.I.), Radiol-ogy & Nuclear Medicine (H.H.H.A., M.W.V., A.v.d.L., M.A.I.), Internal Medicine (A.G.U.), and Neurology (M.A.I.), Erasmus MC, Rotterdam, the Netherlands; Department of Neurology (C.L.S., V.C., H.J.A., J.R.R., P.M., S. Seshadri), Boston University School of Medicine; Department of Bio-statistics (A.L.D., S. Seshadri), Boston University School of Public Health; The National Heart, Lung, and Blood Insti-tute’s Framingham Heart Study (C.L.S., V.C., A.L.D., H.J.A., J.R.R., P.M., S. Seshadri), MA; Cardiovascular Health Re-search Unit, Department of Medicine (J.C.B., B.M.P.), and Departments of Epidemiology (B.M.P., W.T.L.), Health Services (B.M.P.), Biostatistics (K. Rice, Q.W.), Neurology (W.T.L.), and Pathology (T.J.M.), University of Washington, Seattle; Pathology (T.J.M.), Standford University, California; Institute for Community Medicine (A. Teumer), Department of Psychiatry and Psychotherapy (H.J.G.), Institute of Di-agnostic Radiology and Neuroradiology (N.H.), and De-partment of Neurology (B.v.S.), University Medicine Greifswald, Germany; Clinical Division of Neurogeriatrics, Department of Neurology (E.H., R.S.), Institute for Medical Informatics, Statistics and Documentation (E.H.), and Gott-fried Schatz Research Center (for Cell Signaling, Metabolism and Aging), Institute of Molecular Biology and Biochemistry (Y.S., H.S.), Medical University of Graz, Austria; Department of Cardiology (S.T., J.W.J.), Section of Gerontology and Geriatrics, Department of Internal Medicine (S.T.), Molec-ular Epidemiology (P.E.S., M.B., J.D.), Medical Statistics and Bioinformatics (H.-W.U.), and Department of Radiology (J.v.d.G.), Leiden University Medical Center, the Nether-lands; Department of Pharmacology (S.H., C.C., M.K.I.) and Department of Ophthalmology, Yong Loo Lin School of Medicine (C.-Y.C.), National University of Singapore; Ice-landic Heart Association (A.V.S., V.G.), K´opavogur, Iceland; Institute of Molecular Medicine (X.J., M.F.) and Human Genetics Center (M.F.), University of Texas Health Science Center at Houston; Institute for Stroke and Dementia Re-search (R.M., M.D.), Klinikum der Universit¨at M¨unchen, Ludwig-Maximilians-Universit¨at, Munich, Germany; Clinical Neurosciences (M.T., L.C.A.R.-J., H.S.M.), University of Cambridge, UK; School of Life Sciences (S.B.), University of Lincoln, United Kingdom; German Center for Neurodegen-erative Diseases (DZNE) (L.C.A.R.-J.), Population Health Sciences, Bonn, Germany; Department of Medical Genetics (S.L.P.), Department of Neurology, Brain Center Rudolf Magnus (M.K.I.), Department of Epidemiology, Julius Center for Health Sciences and Primary Care (M.I.G., Y.v.d.G.), Department of Genetics, Center for Molecular Medicine (P.I.W.d.B.), and Department of Cardiology, Division Heart & Lungs (F.W.A.), University Medical Center Utrecht, and Utrecht University, the Netherlands; Institut Pasteur de Lille (V.C., P.A.), Lille University, INSERM, Lille University Hospital, France; Department of Neurology (Y.-C.Z.), Peking Union Medical College Hospital, Beijing, China; John P.
Hussman Institute for Human Genomics (G.W.B., A.H.B., S.H.B.), Department of Neurology (R.L.S., T.R.), Evelyn F. McKnight Brain Institute (R.L.S., T.R.), Department of Epi-demiology and Public Health Sciences (R.L.S., T.R.), and Dr. John T. Macdonald Foundation Department of Human Genetics (R.L.S., S.H.B., A.H.B.), Miller School of Medicine, University of Miami, FL; Department of Pathology and Laboratory Medicine (G.D.S.), University of Pennsylvania School of Medicine, Philadelphia; Departments of Neurology & Radiology (O.K.), Landspitali National University Hospi-tal; Faculty of Medicine (V.G.), University of Iceland, Rey-kjavik; Department of Neurology (D.S.K.), Mayo Clinic, Rochester, MN; Departments of Data Science (M.E.G.) and Medicine (B.G.W., T.H.M.), University of Mississippi Med-ical Center, Jackson; Department of Neurology (R.F.G.), Johns Hopkins University School of Medicine, Baltimore, MD; Department of Gene Diagnostics and Therapeutics (F.T., N.K.), Research Institute, National Center for Global Health and Medicine, Tokyo; The Third Department of In-ternal Medicine (S.Y.) and Department of Functional Pa-thology (T.N.), Shimane University School of Medicine, Japan; Rush University Medical Center (K.B.R., N.T.A., D.A.E.), Chicago, IL; Brigham and Women’s Hospital (K. Rexrode); Center for Translational & Computational Neu-roimmunology, Department of Neurology (P.L.D.J.), Co-lumbia University Medical Center, New York, NY; Kaiser Permanente Washington Health Research Institute (B.M.P.), Seattle, WA; Institute for Translational Genomics and Pop-ulation Sciences, Los Angeles Biomedical Research Institute, and Division of Genomic Outcomes, Department of Pediat-rics (J.I.R.), Harbor-UCLA Medical Center, Torrance; Departments of Pediatrics, Medicine, and Human Genetics (J.I.R.), UCLA, Los Angeles, CA; Department of Neurology (O.L.L.), University of Pittsburgh, PA; Singapore Eye Re-search Institute (J.L.); Duke-NUS Graduate Medical School (C.-.YC., T.Y.W., M.K.I.), Singapore; Singapore Eye Research Institute (C.-.YC., T.Y.W., M.K.I.), Singapore National Eye Centre; Memory Aging & Cognition Centre (MACC), Na-tional University Health System (M.K.I.), Singapore; Genetic Epidemiology Unit, Department of Epidemiology and Bio-statistics (S.J.v.d.L., N.A., C.M.v.D.), Erasmus MC University Medical Center, Rotterdam, the Netherlands; Department of Neurology (C.D.), University of California at Davis; Brain Research Imaging Centre (J.M.W., M.d.C.V.H., M.E.B., S.M.M.), Centre for Clinical Brain Sciences (J.M.W., M.d.C.V.H., M.E.B., C.L.M.S.), Edinburgh Dementia Re-search Centre (J.M.W., M.d.C.V.H.), Centre for Cognitive Ageing and Cognitive Epidemiology (J.M.W., M.d.C.V.H., M.L., D.L., I.J.D., M.E.B., J.M.S., S.M.M.), Alzheimer Scotland Dementia Research Centre (J.M.S.), and Institute of Genetics and Molecular Medicine (C.L.M.S.), University of Edinburgh, UK; Department of Neurosciences, Experimental Neurology and Leuven Research Institute for Neuroscience and Disease (LIND) (R.L.), KU Leuven–University of Leuven; Center for Brain & Disease Research (R.L.), VIB, Laboratory of Neu-robiology; Department of Neurology (R.L.), University Hospitals Leuven, Belgium; Florey Institute of Neuroscience
and Mental Health (V.T.), University of Melbourne, Aus-tralia; Centre for Healthy Brain Ageing, Psychiatry (H.B., W.W., A. Thalamuthu, N.J.A., E.C., K.A.M., P.S.S.), Dementia Centre for Research Collaboration (H.B.), and School of Medical Sciences (P.R.S., J.B.K.), University of New South Wales, Sydney; Mathematics & Statistics (N.J.A.), Murdoch University, Perth; Neuroscience Research Australia (K.A.M., P.R.S., A.Thalamuthu), Randwick; Brain and Mind Centre (J.B.K.), The University of Sydney, Camperdown; Queens-land Brain Institute (M.J.W.), University of QueensQueens-land, Brisbane; National Ageing Research Institute (D.A.), Mel-bourne; Academic Unit for Psychiatry of Old Age (D.A.), University of Melbourne, Australia; Department of Cere-brovascular Diseases (G.B.B.), Fondazione IRCCS Istituto Neurologico “Carlo Besta,” Milan, Italy; CTSU, Nuffield Department of Population Health (J.C.H., C.M.v.D.), and Nuffield Department of Clinical Neurosciences (P.M.R.), University of Oxford, UK; National Institute of Neurological Disorders and Stroke (C.B.W.), NIH, Bethesda, MD; In-stitute of Cardiovascular and Medical Sciences, Faculty of Medicine (D.J.S.), and Robertson Centre for Biostatistics (I.F.), University of Glasgow, UK; German Center for Neu-rodegenerative Diseases (DZNE) (K.W., H.J.G.), Site Rostock, Greifswald, Germany; Interfaculty Institute for Ge-netics and Functional Genomics (U.V.), University of Greifswald, Germany; John Hunter Hospital (C.L.), Hunter Medical Research Institute and University of Newcastle, Callaghan, Australia; Neurovascular Research Group (NEU-VAS) (J.J.-C.), Neurology Department, IMIM–Hospital del Mar, Barcelona, Spain; Institute of Cardiovascular Research (P.S.), Royal Holloway University of London & St Peters and Ashford Hospital, UK; Center for Human Genetic Research and Department of Neurology (J.R.), Program in Medical and Population Genetics, Broad Institute, Massachusetts General Hospital, Harvard Medical School, Boston; University of Cincinnati College of Medicine (D.W.), OH; Department of Neurology (J.W.C., S.J.K.), University of Maryland School of Medicine and Baltimore VAMC; Department of Neurology (J.F.M.), Mayo Clinic Jacksonville, FL; Department of Neu-rology (A.S.), Jagiellonian University, Krakow, Poland; De-partment of Clinical Sciences Lund, Neurology (A.L.), Lund University; Department of Neurology and Rehabilitation Medicine (A.L.), Skåne University Hospital; Department of Clinical Sciences Malm¨o (O.M.), Lund University, Sweden; Neuroscience Institute (R.P.G.), Saint Francis Medical Cen-ter, School of Health and Medical Sciences, Seton Hall Uni-versity, South Orange, NJ; College of Public Health (D.K.A.), University of Kentucky, Lexington; Institute of Biomedicine (C.J.), the Sahlgrenska Academy at University of Gothenburg, Sweden; Department of Pharmacotherapy and Translational Research and Center for Pharmacogenomics, College of Pharmacy (J.A.J.), and Division of Cardiovascular Medicine, College of Medicine (J.A.J.), University of Florida, Gaines-ville; Department of Neurology (O.R.B.), University of Brit-ish Columbia, Vancouver, Canada; Department of Epidemiology and Population Health (S.W.-S.), Albert Ein-stein College of Medicine, Bronx, NY; Stroke Center,
Department of Neurology (J.-M.L.), Washington University School of Medicine, St. Louis, MO; Department of Medicine (B.D.M., P.F.M.), University of Maryland School of Medicine, Baltimore; Center for Public Health Genomics (S.S.R.), University of Virginia School of Medicine, Charlottesville; Durrer Center for Cardiovascular Research (F.W.A.), Neth-erlands Heart Institute, Utrecht, the NethNeth-erlands; Institute of Cardiovascular Science, Faculty of Population Health Scien-ces (F.W.A.), and Farr Institute of Health Informatics Re-search and Institute of Health Informatics (F.W.A.), University College London, UK; Peninsula Clinical School (V.S., C.M., M.C.), Frankston Hospital, Central Clinical School, and School of Clinical Sciences (T.P.), Monash Health, Monash University, Melbourne; Menzies Institute for Medical Research (V.S., R.M., M.C.), University of Tasmania, Hobart; Western Sydney University (R.T.), New South Wales, Australia; Departments of Neurology and Public Health Sciences (B.B.W.), University of Virginia, Charlot-tesville; Neuropsychiatric Institute (P.S.S.), Prince of Wales Hospital, Randwick, Australia; Munich Cluster for Systems Neurology (SyNergy) (M.D.), Munich, Germany; Intramural Research Program (L.J.L.), National Institute on Aging, NIH, Bethesda, MD; and University of Texas Health Sciences Center and Glenn Biggs Institute for Alzheimer’s and Neu-rodegenerative Diseases (C.L.S., S. Seshadri), San Antonio.
Author contributions
Drs. Chauhan, Adams, Satizabal, Bis, Teumer, and Sargur-upremraj contributed equally to this work. Drs. Ikram, For-nage, Launer, Seshadri, Longstreth, and Debette jointly supervised this work. Study design/conception: Drs. Scho-field, Tzourio, Schellenberg, Kato, Psaty, Slagboom, Stott, Ford, Jukema, Fornage, Seshadri, Longstreth, and Debette. Statistical analysis: Drs. Schofield, Chauhan, Sargurupremraj, Satizabal, Teumer, Hofer, Trompet, Hilal, Smith, Malik, Saba, Takeuchi, Rice, van der Lee, Luciano, Deelen, Uh, Beecham, Thalamuthu, Armstrong, Grabe, and McWhirter. Sample/ phenotype contribution: Drs. Phan, Schofield, Kwok, Hilal, Malik, Traylor, Tzourio, Schellenberg, Knopman, Griswold, Windham, Mosley, Schmidt, Schmidt, Yamaguchi, Nabika, Psaty, Lopez, Chen, Cheng, Amin, Aparicio, DeCarli, del Carmen Vald´es Hern´andez, Deary, Starr, Bastin, Maniega, Beekman, Lemmens, Brodaty, Wright, Boncoraglio, Hopewell, Blanton, Wright, Sacco, Wen, Chong, van der Grond, Stott, Ford, Jukema, van der Lugt, Wittfeld, Grabe, Hosten, von Sarnowski, V¨olker, Jimenez-Conde, Sharma, Rosand, Cole, Thijs, Lindgren, Rundek, Rexrode, Arnett, Johnson, Bena-vente, Wasssertheil-Smoller, Lee, Mitchell, McArdle, Moran, Callisaya, Mather, Sachdev, van Duijn, Dichgans, Kittner, Markus, Launer, Longstreth, and Debette. Drafting the article: Drs. Chauhan, Seshadri, Longstreth, and Debette. Critical revision of the article: Drs. Chauhan, Satizabal, Teumer, Hofer, Trompet, Malik, Traylor, Tzourio, Windham, Mosley, Schmidt, Yamaguchi, Kato, Psaty, Rice, Lopez, Chen, Aparicio, DeCarli, del Carmen Vald´es Hern´andez, Luciano, Deary, Bastin, Maniega, Slagboom, Beekman, Deelen, Uh, Lemmens,
Wright, Boncoraglio, Wen, Thalamuthu, Armstrong, van der Grond, Stott, Ford, Jukema, van der Lugt, Wittfeld, Grabe, Hosten, von Sarnowski, Jimenez-Conde, Rosand, Thijs, Lindgren, Rundek, Lee, Mitchell, Rich, Geerlings, McWhirter, Callisaya, Mather, Sachdev, Dichgans, Kittner, Markus, Lau-ner, Seshadri, Longstreth, Debette, Adams, Bis, Jian, Pulit, Amouyel, Mazoyer, Zhu, Sargurupremraj, Kaffashian, Bee-cham, Montine, Kjartansson, Gudnason, Gottesman, Rajan, Aggarwal, De Jager, Evans, Rotter, Liao, Wong, Ikram, Chouraki, DeStefano, Romero, Maillard, Wardlaw, Ames, Vernooij, Hofman, Uitterlinden, Levi, Sudlow, Woo, Meschia, Slowik, Melander, Grewal, Rothwell, Jern, van der Graaf, de Bakker, Asselbergs, Thomson, Rutten-Jacobs, Bevan, Worrall, Ikram, Smith, and Schilling. Funding: Drs. Schofield, Trompet, Tzourio, Schellenberg, Mosley, Schmidt, Schmidt, Psaty, Cheng, Deary, Starr, Bastin, Slagboom, Wright, Wen, Stott, Ford, Jukema, V¨olker, Rosand, Lindgren, Johnson, Srikanth, Mather, Sachdev, Markus, Fornage, Seshadri, Longstreth, and Debette. Supervision: Drs. Kwok, Schellenberg, Psaty, Amin, Slagboom, Wen, Jukema, Grabe, Mather, Sachdev, van Duijn, Fornage, Seshadri, Longstreth, and Debette. Final approval of the version to be published: Drs. Satizabal, Teumer, Hofer, Trompet, Hilal, Malik, Traylor, Tzourio, Schellenberg, Gris-wold, Windham, Mosley, Schmidt, Schmidt, Takeuchi, Nabika, Kato, Psaty, Rice, Lopez, Chen, Cheng, van der Lee, Amin, Aparicio, DeCarli, del Carmen Vald´es Hern´andez, Luciano, Deary, Starr, Bastin, Maniega, Slagboom, Beekman, Deelen, Uh, Lemmens, Brodaty, Wright, Boncoraglio, Hope-well, Beecham, Wen, Thalamuthu, Armstrong, Chong, van der Grond, Stott, Ford, Jukema, van der Lugt, Wittfeld, Grabe, Hosten, von Sarnowski, V¨olker, Jimenez-Conde, Rosand, Cole, Thijs, Lindgren, Rundek, Rexrode, Johnson, Wasssertheil-Smoller, Wong, Mitchell, Rich, McArdle, Geerl-ings, McWhirter, Moran, Callisaya, Mather, Sachdev, van Duijn, Dichgans, Markus, Fornage, Launer, Seshadri, Long-streth, Debette, Kittner, Adams, Bis, Jian, Pulit, Amouyel, Mazoyer, Zhu, Sargurupremraj, Kaffashian, Beecham, Mon-tine, Kjartansson, Gudnason, Gottesman, Rajan, Aggarwal, De Jager, Evans, Rotter, Liao, Wong, Ikram, Chouraki, DeStefano, Romero, Maillard, Wardlaw, Ames, Vernooij, Hofman, Uit-terlinden, Levi, Sudlow, Woo, Meschia, Slowik, Melander, Grewal, Rothwell, Jern, der Graaf, de Bakker, Asselbergs, Thomson, Rutten-Jacobs, Bevan, Worrall, Ikram, and Smith.
Acknowledgment
The authors thank Dr. Anton J.M. de Craen (September 1966–January 2016) from the PROSPER and LLS study for his contribution to this work; the Older Australian Twins Study (OATS) participants, their supporters, and the OATS Research Team; all study participants and their relatives, general practitioners, and neurologists for their contributions; P. Veraart for help in genealogy; J. Vergeer for supervision of the laboratory work; P. Snijders for help in data collection; Dr. Anne Boland (CNG) for technical help in preparing the DNA samples for analyses; the University of Newcastle for funding; and the men and women of the Hunter region who participated in this study.
Study funding
CHAP: R01-AG-11101, R01-AG-030146, NIRP-14-302587. SMART: This study was supported by a grant from the Netherlands Organization for Scientific Research–Medical Sciences (project no. 904-65–095). LBC: The authors thank the LBC1936 participants and the members of the LBC1936 research team who collected and collated the phenotypic and genotypic data. The LBC1936 is supported by Age UK (Disconnected Mind Programme grant). The work was undertaken by The University of Edinburgh Centre for Cognitive Ageing and Cognitive Epidemiology, part of the cross-council Lifelong Health and Wellbeing Initiative (MR/ K026992/1). The brain imaging was performed in the Brain Research Imaging Centre (https://www.ed.ac.uk/clinical-sciences/edinburgh-imaging), a center in the SINAPSE Col-laboration (sinapse.ac.uk) supported by the Scottish Funding Council and Chief Scientist Office. Funding from the UK Biotechnology and Biological Sciences Research Council (BBSRC) and the UK Medical Research Council is ac-knowledged. Genotyping was supported by a grant from the BBSRC (ref. BB/F019394/1). PROSPER: The PROSPER study was supported by an investigator-initiated grant obtained from Bristol-Myers Squibb. Prof. Dr. J.W. Jukema is an Established Clinical Investigator of the Netherlands Heart Foundation (grant 2001 D 032). Support for genotyping was provided by the seventh framework program of the European commission (grant 223004) and by the Netherlands Genomics Initiative (Netherlands Consortium for Healthy Aging grant 050-060-810). SCES and SiMES: National Medical Research Council Singapore Centre Grant NMRC/ CG/013/2013. C.-Y.C. is supported by the National Medical Research Council, Singapore (CSA/033/2012), Singapore Translational Research Award (STaR) 2013. Dr. Kamran Ikram received additional funding from the Singapore Min-istry of Health’s National Medical Research Council (NMRC/CSA/038/2013). SHIP: SHIP is part of the Com-munity Medicine Research net of the University of Greifs-wald, Germany, which is funded by the Federal Ministry of Education and Research (grants no. 01ZZ9603, 01ZZ0103, and 01ZZ0403), the Ministry of Cultural Affairs, as well as the Social Ministry of the Federal State of Mecklenburg–West Pomerania, and the network “Greifswald Approach to In-dividualized Medicine (GANI_MED)” funded by the Federal Ministry of Education and Research (grant 03IS2061A). Genome-wide data have been supported by the Federal Ministry of Education and Research (grant no. 03ZIK012) and a joint grant from Siemens Healthineers, Erlangen, Ger-many, and the Federal State of Mecklenburg–West Pomer-ania. Whole-body MRI was supported by a joint grant from Siemens Healthineers, Erlangen, Germany, and the Federal State of Mecklenburg–West Pomerania. The University of Greifswald is a member of the Cach´e Campus program of the InterSystems GmbH. OATS (Older Australian Twins Study): OATS was supported by an Australian National Health and Medical Research Council (NHRMC)/Australian Research Council (ARC) Strategic Award (ID401162) and by
a NHMRC grant (ID1045325). OATS was facilitated via access to the Australian Twin Registry, which is supported by the NHMRC Enabling Grant 310667. The OATS genotyping was partly supported by a Commonwealth Scientific and In-dustrial Research Organisation Flagship Collaboration Fund Grant. NOMAS: The Northern Manhattan Study is funded by the NIH grant“Stroke Incidence and Risk Factors in a Tri-Ethnic Region” (NINDS R01NS 29993). TASCOG: NHMRC and Heart Foundation. AGES: The study was funded by the National Institute on Aging (NIA) (N01-AG-12100), Hjartavernd (the Icelandic Heart Association), and the Althingi (the Icelandic Parliament), with contributions from the Intramural Research Programs at the NIA, the Na-tional Heart, Lung, and Blood Institute (NHLBI), and the National Institute of Neurological Disorders and Stroke (NINDS) (Z01 HL004607-08 CE). ERF: The ERF study as a part of European Special Populations Research Network (EUROSPAN) was supported by European Commission FP6 STRP grant no. 018947 (LSHG-CT-2006-01947) and also received funding from the European Community’s Seventh Framework Programme (FP7/2007–2013)/grant agreement HEALTH-F4-2007-201413 by the European Commission under the programme“Quality of Life and Management of the Living Resources” of 5th Framework Programme (no. QLG2-CT-2002-01254). High-throughput analysis of the ERF data was supported by a joint grant from Netherlands Organization for Scientific Research and the Russian Foun-dation for Basic Research (NWO-RFBR 047.017.043). Exome sequencing analysis in ERF was supported by the ZonMw grant (project 91111025). Najaf Amin is supported by the Netherlands Brain Foundation (project no. F2013[1]-28). ARIC: The Atherosclerosis Risk in Communities study was performed as a collaborative study supported by NHLBI contracts (HHSN268201100005C, HSN268201100006C, HSN268201100007C, HHSN268201100008C, HHSN268-201100009C, HHSN268201100010C, HHSN268201100011C, and HHSN268201100012C), R01HL70825, R01HL087641, R01HL59367, and R01HL086694; National Human Genome Research Institute contract U01HG004402; and NIH contract HHSN268200625226C. Infrastructure was partly supported by grant no. UL1RR025005, a component of the NIH and NIH Roadmap for Medical Research. This project was also supported by NIH R01 grant NS087541 to M.F. FHS: This work was supported by the National Heart, Lung and Blood Institute’s Framingham Heart Study (contracts no. N01-HC-25195 and no. HHSN268201500001I), and its contract with Affymetrix, Inc. for genotyping services (contract no. N02-HL-6-4278). A portion of this research utilized the Linux Cluster for Genetic Analysis (LinGA-II) funded by the Robert Dawson Evans Endowment of the Department of Medicine at Boston University School of Medicine and Boston Medical Center. This study was also sup-ported by grants from the NIA (R01s AG033040, AG033193, AG054076, AG049607, AG008122, and U01-AG049505) and the NINDS (R01-NS017950, UH2 NS100605). Dr. DeCarli is supported by the Alzheimer’s Disease Center (P30 AG 010129). ASPS: The research reported in this article was funded by the Austrian Science Fund (FWF) grant nos. P20545-P05, P13180,