the feedback loops of major depressive disorder
The MIT Faculty has made this article openly available. Please share how this access benefits you. Your story matters.Citation Wittenborn, A. K. et al. “Depression as a Systemic Syndrome:
Mapping the Feedback Loops of Major Depressive Disorder.” Psychological Medicine 46, 3 (December 2015): 551–562. © 2015 Cambridge University Press
As Published http://dx.doi.org/10.1017/s0033291715002044
Publisher Cambridge University Press
Version Author's final manuscript
Citable link http://hdl.handle.net/1721.1/111133
Terms of Use Creative Commons Attribution-Noncommercial-Share Alike
Running head: DEPRESSION AS A SYSTEMIC SYNDROME
Depression as a systemic syndrome:
Mapping the feedback loops of major depressive disorder
Andrea K. Wittenborn 1, Hazhir Rahmandad 2, Jennifer Rick 1, and Niyousha Hosseinichimeh 1
1 Department of Human Development and Family Studies, Michigan State University, East Lansing, MI
2 Sloan School of Management, Massachusetts Institute of Technology, Cambridge, MA
Address for correspondence: A.K. Wittenborn, Ph.D., Department of Human Development and Family Studies, Michigan State University, 552 W. Circle Dr., East Lansing, MI 48824, USA. (Email: andreaw@msu.edu)
Abstract Background
Depression is a complex public health problem with considerable variation in treatment response. The systemic complexity of depression, or the feedback processes among diverse drivers of the disorder, likely contribute to the persistence of depression. This paper extends prior attempts to understand the complex causal feedback mechanisms that underlie depression by presenting the first broad boundary causal loop diagram of depression dynamics.
Methods
We applied qualitative system dynamics methods to map the broad feedback mechanisms of depression. We used a structured approach to identify candidate causal mechanisms of
depression in the literature. We assessed the strength of empirical support for each mechanism and prioritized those with support from validation studies. Through an iterative process, we synthesized the empirical literature and created a conceptual model of major depressive disorder. Results
The literature review and synthesis resulted in the development of the first causal loop diagram of reinforcing feedback processes of depression. It proposes candidate drivers of illness, or inertial factors, and their temporal functioning, as well as the interactions among drivers of depression. The final causal loop diagram defines 13 key reinforcing feedback loops that involve 9 candidate drivers of depression.
Conclusions
Future research is needed to expand upon this initial model of depression dynamics. Quantitative extensions may result in a better understanding of the systemic syndrome of depression and contribute to personalized methods of evaluation, prevention, and intervention.
Keywords: Major depressive disorder; system dynamics; personalized medicine; feedback loops; feedback mechanisms
Depression as a systemic syndrome:
Mapping the feedback loops of major depressive disorder
Depression is a remarkably destructive problem. Major Depressive Disorder (MDD) is a leading cause of medical disability worldwide (World Health Organization, 2014) and costs the U.S. over $210 billion each year (Greenberg et al., 2015). An indicator of its complexity,
depression is also resistant to change. Despite decades of widespread intervention, research, and public awareness efforts, prevalence rates of MDD remain stable (Ferrari et al., 2013).
Antidepressant medications, while being used at an all-time high (National Center for Health Statistics, 2014), have not demonstrated a consistent advantage over placebo pills (Kirsch et al., 2008), and only half of psychotherapy patients recover after their first course of treatment (e.g., Barber et al., 2012; Carter et al., 2013).
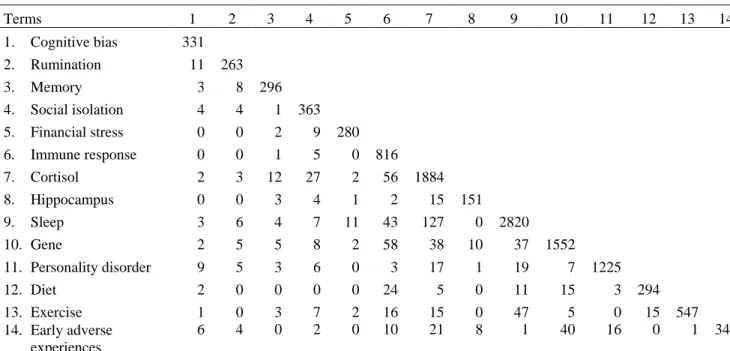
Major public health problems often persist, despite best efforts to intervene, when they are more complex than the narrow frameworks used to understand them (Sterman, 2006). As physicist David Bohm (1980) warned, “…the notion that the fragments are really separate is, in essence, what has led to the growing series of extremely urgent crises that is confronting us today” (p. 2). Narrow perspectives of depression are common and are reflected in the theories of pathogenesis that range from cognitive theory (Beck, 2008) to the hypothalamic-pituitary-adrenal (HPA) axis dysfunction theory (Pariante & Lightman, 2008), inflammation theory (Miller et al., 2009), neurodegenerative theory (Wainwright & Galea, 2013), and stress generation theory (Hammen, 2006) among others. To understand how frequently research is guided by the common-cause view of depression, we calculated roughly the number of published studies that examined MDD and a single variable or multiple variables related to depressive pathogenesis. We searched PubMed for articles published between 1980 and 2014 that included
the term “major depressive disorder” and key variable terms designed to optimize the relevancy of results returned (See the supplementary materials for details). The number of published MDD studies that addressed one variable are represented on the diagonal in Table 1 and the remaining figures reflect studies on more than one key MDD variable. The search identified 12,060 articles; about 93% (n = 11,169) studied one key variable and only 7% (n = 891) studied two or more. The lack of published works on the intersecting agents that drive depression is striking.
New frameworks have been suggested in place of the common-cause approach (e.g., Kendler et al., 2011; Insel, 2014). Kendler and colleagues (2011) recommended a shift from seeking an “essence” that is directly responsible for a mental disorder to delineating the complex causal mechanisms that underlie psychiatric syndromes. Network and dynamic methods have been recommended for such investigations (e.g., Borsboom & Cramer, 2013; van de Leemput et
al., 2014) since traditional psychometric approaches often assume a linear and latent variable
model and can’t estimate intra-individual effects. System dynamic modeling is a useful tool for understanding how diverse causal feedback mechanisms create a systemic syndrome with heterogeneous patient trajectories (Sterman, 2000). It uses an iterative process of gathering diverse data, diagraming causal mechanisms from a whole-system perspective, and, quantifying and validating a simulation model (Forrester, 1994).
In this paper, we present the first causal loop diagram of adult depression dynamics. The model builds upon prior efforts to map mechanisms of depression (Kendler et al., 2002; Kendler
et al., 2006; Stapelberg et al., 2011; Borsboom & Cramer, 2013; van de Leemput et al., 2014;
Wichers, 2014), and was developed through a structured review of the literature in which key cognitive, social, environmental, and biological drivers of MDD and the interactions among them were identified. Results from the literature review were synthesized and used to model
unipolar depression assuming a continuous definition (e.g., Aggen et al., 2005; Hankin et al., 2005). In the next section, we will introduce important methodological concepts such as
feedback loops and stock variables and will use a simple system dynamics model of MDD as an illustration of the approach. We will then explain the procedures used in this study, describe the final model, and highlight preliminary insights and opportunities that extensions of the model might provide.
Methods: Understanding Systems’ Dynamics Using Feedback Loops and Stock Variables As with most systemic conditions, feedback loops are likely to play a key role in explaining the observed patterns of unipolar depression. Feedback processes regulate dynamic phenomena, from biological and natural systems to ones that are engineered (Richardson, 1999). In the context of depression, they include not only the homeostatic (balancing) processes that keep various neurotransmitters, hormones, and other biological mechanisms in approximate balance, but also feedback loops that cut across different domains and may be of a reinforcing1 nature. For example, economic hardship is a stressor that can increase depressive symptoms. On the other hand, one consequence of increased depressive symptoms is loss of motivation and an increased chance of hurting one’s economic wellbeing, e.g. due to job loss. Together, the two causal links create a reinforcing loop, which may trap an individual in increasing financial hardship and depression.
Identifying reinforcing feedback loops is essential in understanding heterogeneous health outcomes across different individuals (Sterman, 2000). A nuanced expression of feedback loops can send people toward unique trajectories, i.e. different health outcomes. Let us consider a
1 We use the term “reinforcing” in describing feedback loops where the impact of a small increase in one variable, once traced along the whole loop, leads to further increase in the initial variable. “Positive” feedback (in
simple simulation model designed to illustrate the role of feedback loops (See Figure 1). In this example, the gap between the environmental stressors an individual is exposed to and his/her regulatory resources for handling those stressors is used as a proxy that informs MDD levels. These regulatory resources may span various cognitive (e.g., positive schemas), social (e.g., close family ties), and material (e.g., food, shelter, economic safety) dimensions. When stressors significantly exceed what an individual can handle given his/her regulatory resources, MDD symptoms manifest in our model. Let us now consider the addition of two feedback loops into this “toy” model. First, assume that a small positive gap between current environmental stressors and an individual’s current resource level can stimulate building of resilience, i.e. expands resources. This may happen because in dealing with challenges that are not too hard to
overcome, the individual learns new skills, expands his/her positive schemas, or deepens his/her social relationships; all enabling the individual to deal better with the next stressor, i.e. closing a balancing feedback loop that reduces vulnerability to MDD. The second feedback relates to deterioration of those resources as a result of MDD, e.g. through loss of intimacy in
relationships, negative rumination, or loss of financial independence. Note that this second loop is reinforcing: an episode of MDD leads to a lower resource base, which in turn increases the likelihood of future episodes.
Figure 1 presents a stock and flow diagram of this illustrative model and reports the resource and MDD distributions for 1000 simulated individuals exposed to identical patterns of environmental stressors under the two scenarios (excluding and including feedbacks). In the absence of any feedback loops between MDD and those resources, MDD patterns are determined directly by the environmental stressors: at times when environmental stressors are over one (the assumed constant resource), some level of MDD is observed, so the variations in MDD are
determined only by the variations in environmental stressors. However, the introduction of feedbacks leads to endogenous changes in resources: starting from the same initial resource, some individuals experience moderate stressors that help them build further resources, while others face significant stressors that are more than they can handle, which reduces their ability to cope. Despite identical initial points, parameters, and exposure to random stressors that are similar in expectation, the population separates over time into two groups: those who develop resiliency in the face of stressors and those susceptible to depression due to low resource levels. As a result, the observed MDD patterns follow a bimodal distribution with some individuals more likely to experience successive bouts of depression, even due to rather small environmental stressors, and others resilient to much larger shocks. In essence, the reinforcing loops and minor differences in environmental stressors are enough to lead to significantly different outcomes. This model is presented to illustrate basic concepts and not to inform actual MDD trajectories. Nevertheless, similar dynamics have been documented in experiments exposing rats to various levels of stressors, with those exposed to moderate stressors building resiliency, while extreme stressors led to learned helplessness (Maier et al., 2006).
Absent empirical grounding, this model is not informative about actual MDD patterns, but is intended to highlight two features of complex dynamic systems that motivate our study. First, under certain conditions reinforcing feedback loops can amplify small variations among individuals, leading to significant population level heterogeneity from much smaller variations in exogenous influences such as genetics and environmental factors. Second, the strength of the loops and the resulting dynamics are highly dependent on the sources of inertia on the causal pathways (i.e., stock or state variables) and the speed in which they change. In our simple MDD model example, the speed by which the stock of resources grows, or declines, is central to the
dynamics. Fast growth rates for this stock shift the dynamics toward the equilibrium with many resilient individuals and few at risk for MDD. Faster erosion rates increase risks. Therefore, understanding a complex system requires not only the mapping of feedback processes, but also the identification of key inertial factors, their speed of change, and the potential asymmetries in their growth versus decline mechanisms.
A Qualitative Model of Depression Dynamics
We used a structured approach to incorporate findings from the literature into a
conceptual model (e.g., see Hu et al., 2011). In the absence of prior efforts to compile a systems mapping, we selected a broad model boundary (i.e., cognitive, social, environmental, and biological processes and diverse disciplinary perspectives) at the expense of going in depth into any single area. In fact, several excellent review articles provide more in depth reviews of
specific mechanisms (Mössner et al., 2007; De Raedt & Koster, 2010; Palagini et al., 2013). The focus of this article is making connections among MDD drivers. To develop the model, we selected review papers on mechanisms of MDD pathogenesis (e.g., Kendler et al., 2002; Kendler
et al., 2006; Belmaker & Agam, 2008; Gotlib & Hammen, 2014) and identified key reinforcing
feedbacks and inertial factors. We then used reference lists from those publications and additional literature searches to develop an initial model of candidate drivers and their intersections. We assessed the strength of empirical support for each mechanism, prioritized mechanisms that had been validated, and revised our conceptual structure. Next, we invited five experts in unique areas of MDD research to critique our model and suggest additional literature, informing further model revisions. The final database used to develop the model included 594 publications. Only findings confirmed in human models were included in our synthesis due to
concerns with rodent models in late stage translational research (e.g., Seok et al., 2013; Lacro et
al., 2014).
In our review, we identified the reinforcing loops that could be relevant for understanding the etiology of depression and candidate stock variables that may regulate the strength and dynamics of these loops. Many balancing (homeostatic) feedbacks are also present in this system, yet given the breadth of the model we focused on the reinforcing feedbacks that could play a substantial role in creating heterogeneous depression related outcomes among individuals. Only factors thought, based on the current literature, to determine the behavior of MDD were included. We note that not all pathways are active for all depressed individuals so each empirical case may best be explained by a subset of these loops. Moreover, some factors may be
considered “two sides of the same coin”, i.e. previous literature may have used different levels of aggregation for describing causal processes that are otherwise rooted in the same biological mechanisms. We do not attempt to reconcile those alternative descriptions here and incorporate both in our diagram.
Next, we present the model and describe each feedback loop. To simplify the discussion, we describe cognitive, social and environmental, and biological dimensions separately, noting that some loops cross these conceptual boundaries. The causal loop diagram of the full model is depicted in Figure 4 (See the supplementary materials for further details). For each feedback loop, we discuss candidate stock variables and their speed of change and examine how various exogenous (i.e., non-feedback) factors interact with the feedback mechanisms we identify.
Cognitive dimensions. As Figure 2 illustrates in reinforcing feedback loop 1, or R1 (consolidation of negative cognitive representations), early adversity such as abuse or neglect of a child is processed and stored in the form of negative cognitive representations within an
individual’s memory (McGinn et al., 2005). Negative cognitive representations influence the way in which one attunes to stress stimuli, leading an individual to orient and maintain his/her focus on negative information. Negatively biased attention and processing increases one’s perceived level of stress which leads to negative affect such as sadness and biased interpretations of negative stimuli that often align with one’s negative mental models (De Raedt & Koster, 2010). The processing of negative thoughts and affect are encoded and stored in one’s memory, further strengthening existing negative cognitive representations (Cole et al., 2014). In R2 (rumination), negative affect and interpretations intensify one’s propensity for ruminative thought which further compounds perceptions of stress and increases negative affect (Nolen-Hoeksema & Morrow, 1991). In R3 (cognitive deficit), negative affect and interpretations contribute to dysfunctional behaviors (Hamilton et al., 2013) and strengthen negative cognitive models (Pettit & Joiner, 2006). An example of this is the self-perceptions of worthlessness and feelings of guilt one might experience after having shoved his/her partner during a heated argument. The dysfunctional behavior in this example intensifies the perception of oneself as worthless. As R4 (impaired working memory) illustrates, increased negative affect inhibits the efficiency of one’s working memory (De Lissnyder et al., 2012), leading to less optimal cognitive performance. Cognitive performance is weakened by impaired memory and sleep problems (Van Dongen et al., 2003) and further contributes to dysfunctional behaviors (McCall & Dunn, 2003). Dysfunctional behaviors reinforce negative cognitive representations and lead to biased attentional processes, increased perceptions of stress, negative affect and interpretations, and further inhibit the efficiency of working memory.
Temporal sensitivity of key stock candidates. Negative cognitive representations are key
important targets of change in cognitive theories of depression. Negative cognitive representations are, in essence, patterns embedded in neural connections in the brain that
accumulate over months and years (Beck, 2008). Negative cognitive representations are expected to change slowly in many cases, making these loops most relevant for dynamics that unfold over longer time horizons (Padesky, 1994). This stock has the potential to drive illness from early in life.
Social and environmental dimensions. Figure 3 is a causal loop diagram of the social and environmental dimensions of the model. Affected by cognitive actors, R5 (social isolation) depicts how dysfunctional behaviors contribute to weakened social networks in the form of poor interpersonal relationship quality or social isolation (Lovejoy et al., 2000). Stress related to interpersonal relationships contributes to negative affect and processing (Joiner et al., 2005) and can lead to problematic responses (e.g., aggression) which, in turn, depletes interpersonal relationship quality. As depressed patients become further plagued by challenging relationships or isolation, their negative cognitive representations are reinforced. One’s economic status, including material assets, income, and reputation, can be depleted through the effects of poor cognitive performance (McIntyre et al., 2013) or behaviors at work and beyond (Stewart et al., 2003) as shown in R6 (financial stress). Absenteeism or presenteeism can lead to job loss or limits to promotions and underemployment, thereby severing or restricting one’s income. Poor cognitive performance in the face of various risks at work and in society can also cause
economic and reputational damage. Financial stress can produce negative affect and problematic behavioral responses that increase economic adversity and reinforce negative mental models (Hobfoll et al., 2003).
Temporal sensitivity of key stock candidates. Social support and financial resources
could be important stock variables in the feedback loops described above. An individual’s personal economics and social networks typically build over the span of years, but have the potential to be depleted more quickly than they accumulate, an asymmetry that can exacerbate these reinforcing loops when they act as vicious cycles.
Biological Dimensions. The biological dimensions are illustrated in Figure 4. Stress initiates a cascade of responses relevant to depression. In R7 (elevated cortisol response), perceived psychosocial stress activates the central nervous system by inducing the secretion of corticotrophin releasing hormone and vasopressin in the hypothalamus that stimulates
adrenocorticotrophin hormone in the anterior pituitary and, in turn, releases cortisol in the adrenal cortex. As concentrations of cortisol increase, glucocorticoid receptors (GR) become overburdened (Strüber et al., 2014). Excess cortisol, cortisol reactivity, and altered GR function inhibit the hypothalamic-pituitary-adrenal (HPA) system and reinforce HPA dysregulation which has negative consequences for an individual’s physical and mental health. For clarity, the effects of brief periods of stress on cortisol are often adaptive and resolve autonomously, but chronic stress is what drives illness (Herbert et al., 2006). Early adverse experiences, both in utero and in early childhood, can also initiate changes to basal and stress related cortisol secretion (Slopen et
al., 2013).
The R7 and R8 (exaggerated immune response) loops are highly interrelated given extensive communication among the immune, endocrine, and central nervous systems. During increased periods of stress or chronic illness, pro-inflammatory cytokines are released. Cytokines are known to inhibit GR function. Although cortisol is a key anti-inflammatory hormone, when chronic stress sustains cortisol response and GR becomes overburdened, cortisol signaling
becomes insufficient and unable to reduce immune responses which leads to inflammation (Miller et al., 2009).
Chronic exposure to cortisol and cytokines reduces the availability of monoamines like serotonin, dopamine, and norepinephrine by influencing synthesis and reuptake (Miller et al., 2009; Strüber et al., 2014). Monoamine neurotransmitters regulate sleep and wakefulness and deficiencies lead to sleep problems. Sleep is vital to long-term memory consolidation, which is necessary for learning, and sleep problems can disrupt this process (Choi & Abel, 2013). Learning and memory deficits, including deficiencies in reward processing (Eshel & Roiser, 2010; Pizzagalli, 2014), inhibit effective cognitive performance which leads to dysfunctional behaviors, economic problems, and poor interpersonal relationships which increase stress and heighten immune and HPA response. This in turn triggers further monoamine neurotransmission abnormalities and compounds sleep problems (R11 sleep deprivation) and learning and memory deficits (R9 impaired memory). Monoamines also play an important role in emotion regulation. Serotonin deficiency reduces the brain’s regulatory capacity by not adequately modulating amygdala response to negative stimuli which leads to sustained emotional responding in the face of stress (De Raedt & Koster, 2010), and plays a key role in reinforcing negative cognitive and emotional processes in the R1, R2, and R3 feedback loops.
The hippocampus is sensitive to cortisol toxicity and elevated pro-inflammatory
cytokines, in part, because of its high concentration of GR (Herbert et al., 2006; Zunszain et al., 2011). Relevant to R10 (hippocampus atrophy), high levels of cortisol and cytokines in the context of GR resistance act to suppress neurogenesis and promote neuronal death that leads to hippocampal atrophy (Sapolsky, 2000). Reduction of hippocampal volume has a negative effect on learning and memory, especially in relation to explicit memory formation, which leads to
memory deficits and impaired cognitive performance. Poor cognitive performance hinders one’s personal economics and intimate relationship quality, producing additional stress that
compounds exaggerated cortisol and immune response and further reduces hippocampal volume. Physical health also interacts with depression. One of the two reinforcing feedback loops relevant to physical health works through the same paths as described for personal relationships and economics (R12 disease related stress). As an illustration, dysfunctional behaviors such as medication non-adherence (DiMatteo et al., 2000) and poor diet (e.g., diets low in omega-3 essential fatty acids or polyunsaturated fatty acids) have a negative effect on one’s health and can further enhance negative cognitive representations. The second loop for physical health relates to the deteriorating health (R13) one can experience when poor behaviors such as physical
inactivity due to loss of motivation contributes to chronic medical problems (Ye et al., 2013), affecting immune functioning, HPA axis reactivity, and sleep and eventually reinforcing declines in health. Also, declining physical health can limit an individual’s capacity to engage in physical activity and physical inactivity increases cortisol concentrations (Paddon-Jones, 2006).
Temporal sensitivity of key stock candidates. There is more uncertainty about potential
stock variables within this portion of the model. Plausible candidates include the level of
cytokines (changing over hours; Xiang et al., 2011), effective GR (changing over days; de Kloet
et al., 1998), cortisol (changing over minutes; Gruenewald et al., 2004), monoamines (changing
over minutes; Clow et al., 1997), and hippocampal volume (changing over years; Peng et al., 2015). An additional candidate is physical health which tends to accumulate slowly and can either be lost quickly in the face of an accident or fast-acting disease or may dwindle slowly. Physical health is likely a stronger driver of depression for aging adults. Many of the relevant dynamics in understanding depression unfold over longer time horizons, and thus some of the
stock variables may not represent the most viable candidates for explaining longer term dynamics. It remains to be seen if there are slow moving biological mechanisms beyond the formation of neural pathways that we discussed under cognitive factors and the change in
hippocampal volume. For example, sleep disturbances can persist well past depression remission, yet mechanisms for this slow moving change are unknown, meaning that our stock candidates don’t account for it.
Exogenous drivers. Our synthesis has been focused on endogenous reinforcing loops that could explain depression. These loops, in turn, are often triggered through various factors that are exogenous to the boundary of our model. Those include, among others, genes,
personality (e.g., neuroticism), gender, socio-economic status, nutritional environment, and built environment that influences opportunities for exercise. Also relevant are various random events such as accidents, the loss of loved ones, and early adverse events (which are partially identified in our model). These variables are included as exogenous and determine different parameters or exogenous drivers if we wished to quantify the feedback loops. The interaction between
exogenous factors and feedback loops also creates the potential for endogeneity through epigenetics.
Discussion
This is the first attempt to apply qualitative systems mapping to bring a feedback
perspective to understanding the broad etiology of depression and to develop a basis for building a quantitative model of depression dynamics. It describes a causal loop diagram of MDD that was developed based on a structured review of the literature in which we identified key drivers of disorder and their interconnections. The model highlights three conceptual insights in
some exogenous factor (be it genes, environmental stressors, or early childhood adversity), our model maps depression as a partially endogenous condition. Various reinforcing loops, activated by exogenous factors, will push some individuals towards a trajectory of increasingly negative cognitive representations, declining social, economic, and health resources, and various
perturbations in hormones, immune response, and neurotransmitters. Once in such equilibrium, the individual may have a hard time escaping, even if the original exogenous driver is removed. On the other hand, if the underlying reinforcing feedback is mitigated (by chance, intervention, or strengthening of homeostatic processes), spontaneous remission may ensue even in the presence of original exogenous shocks. Second, the strength and relevance of different loops depend heavily on the stock variables on each loop and their speed of change. Identifying those stock variables and their change mechanisms, including the timing in which they unfold and influence one another, is an important program of research that this feedback perspective
underscores. For example, such knowledge could better predict the treatment targets and dosages required to alter the feedbacks driving illness and return a patient to a healthy equilibrium. Third, this model explains how the specific feedback loops that trap patients into the same type of disorder could be unique across individuals. Some patients may be kept down by cognitive feedbacks, others by social ones, some by biological feedbacks, and others by combinations. Quantifying the model and estimating it empirically would allow for assessment of the relative strength of different mechanisms. Such a model could then play a significant role in personalized treatment, where we could identify the feedback loops most relevant for understanding each depressed patient and target those loops differentially.
Limitations. Our model was informed by existing literature and partially absorbs deficits in the current knowledge of depression, e.g., many mechanisms, particularly biological ones, are
not well understood and studies don’t often explicate causal drivers and their intersections. Therefore, more empirical studies and simulation models that expose the multiple drivers of depression and exactly how they intersect are needed to enhance the reliability of our model. Being a qualitative study, other limitations inherent to this mode of inquiry are relevant here as well, e.g., investigator bias and limits to replicability. However, qualitative systems mapping is an important first step towards developing new insights into the disorder, as well as quantifying and empirically validating simulation models of depression dynamics. Finally, the broad scope of this project led us to focus solely on reinforcing loops. Focusing on reinforcing mechanisms in the absence of homeostatic mechanisms may lead to over-estimating the role of reinforcing loops and the heterogeneity that a system produces. An important next step is to integrate key
balancing processes.
Future directions. Future research is needed to develop a quantitative simulation model of depression dynamics (Forrester, 1994). While ambitious, early efforts are encouraging (e.g., Hosseinichimeh et al., in press; Hosseinichimeh et al., 2015a). For example, we developed a dynamic model of depression and rumination and predicted the response of 32 patient profiles to a mindfulness intervention in simulation (Hosseinichimeh et al., 2015b). Other studies could identify intervention leverages and priorities and inform clinical decision-making such as dosage, treatment timing, and complementary intervention strategies. Future models could identify which causal inertial factors are at the core of a patient’s depression, and intervention could be re-imagined as resetting stocks to promote a new equilibrium versus treating symptoms of an underlying disorder. Simulation studies and more traditional methods could be used in
randomized controlled trials. Inquiries of prevention might also identify tipping points of illness (e.g., van de Leemput et al., 2014).
Conclusions
This paper presents the first causal loop diagram of depression dynamics. The model demonstrates a feasible path towards a causal based understanding of the systemic syndrome of depression. Furthering this line of research may produce a powerful tool for predicting best practices for personalized prevention and treatment of depression and propel progress in alleviating the burden of illness for the 350 million suffering worldwide (World Health Organization, 2008).
Acknowledgements
We wish to thank Steven Hollon, Adrian Blow, Lena Brundin, Daniel Pine, and the anonymous reviewers for their comments on the development of the model and article. Financial support
Research reported in this article was supported by the National Institute of Mental Health of the National Institutes of Health award R21MH100515. The content is solely the
responsibility of the authors and does not necessarily represent the official views of the National Institutes of Health.
Conflict of interest None
References
Aggen SH, Neale MC & Kendler KS (2005). DSM criteria for major depression: Evaluating symptom patterns using latent-trait item response models. Psychological Medicine, 35, 475-487.
Barber JP, Barrett MS, Gallop R, Rynn MA & Rickels K (2012). Short-term dynamic psychotherapy versus pharmacotherapy for major depressive disorder: A randomized, placebo-controlled trial. Journal of Clinical Psychiatry, 73, 66-73.
Beach SRH, Dreifuss JA, Franklin KJ, Kamen C & Gabriel B (2008). Couple therapy and the treatment of depression. In: Clinical Handbook of Couple Therapy. (ed. A. S. Gurman), pp. 545-566. Guilford Press: New York.
Beck AT (2008). The evolution of the cognitive model of depression and its neurobiological correlates. The American Journal of Psychiatry, 165, 969-977.
Belmaker RH & Agam G (2008). Major depressive disorder. The New England Journal of
Medicine, 358, 47-60.
Bohm D (1980). Wholeness and the Implicate Order. Routledge: New York.
Borsboom D & Cramer AOJ (2013). Network analysis: An integrative approach to the structure of psychopathology. Annual Review of Clinical Psychology, 9, 91-121. Carter JD, Mcintosh VV, Jordan J, Porter RJ, Frampton CM & Joyce PR (2013).
Psychotherapy for depression: A randomized clinical trial comparing schema therapy and cognitive behavior therapy. Journal of Affective Disorders, 151, 500-505.
Choi JHK & Abel T (2013). Sleep and long-term memory storage. In: The Genetic Basis of
Sleep and Sleep Disorders. (ed. P. Shaw, M. Tafti & M. Thorpy), pp. 208-218.
Clow A, Patel S, Najafi M, Evans PD & Hucklebridge F (1997). The cortisol response to psychological challenge is preceded by a transient rise in endogenous inhibitor of monoamine oxidase. Life Sciences, 61, 567-575.
Cole DA, Dukewich TL, Roeder K, Sinclair KR, Mcmillan J, Will E, Bilsky SA, Martin NC & Felton JW (2014). Linking peer victimization to the development of depressive self-schemas in children and adolescents. Journal of Abnormal Child Psychology, 42, 149-160.
De Kloet ER, Vreugdenhil E, Oitzl MS & Joëls M (1998). Brain corticosteroid receptor balance in health and disease. Endocrine Reviews, 19, 269-301.
De Lissnyder E, Koster EHW, Everaert J, Schacht R, Van Den Abeele D & De Raedt R (2012). Internal cognitive control in clinical depression: General but no emotion-specific impairments. Psychiatry Research, 199, 124-130.
De Raedt R & Koster EHW (2010). Understanding vulnerability for depression from a cognitive neuroscience perspective: A reappraisal of attentional factors and a new conceptual framework. Cognitive, Affective & Behavioral Neuroscience, 10, 50-70. Dimatteo MR, Lepper HS & Croghan TW (2000). Depression is a risk factor for
noncompliance with medical treatment: Meta-analysis of the effects of anxiety and depression on patient adherence. Archives of Internal Medicine, 160, 2101-2107. Eshel N & Roiser JP (2010). Reward and punishment processing in depression. Biological
Psychiatry, 68, 118-124.
Ferrari AJ, Charlson FJ, Norman RE, Patten SB, Freedman G, Murray CJL, Vos T & Whiteford HA (2013). Burden of depressive disorders by country, sex, age, and year: Findings from the Global Burden of Disease Study 2010. PLoS Medicine, 10, 1-12.
Forrester JW (1994). System dynamics, systems thinking, and soft OR. System Dynamics
Review, 10, 245-256.
Gotlib IH & Hammen CL (eds.) (2014). Handbook of Depression, 3rd edition, Guilford Press: New York.
Greenberg PE, Fournier AA, Sisitsky T, Pike CT & Kessler RC (2015). The economic burden of adults with Major Depressive Disorder in the United States (2005 and 2010).
Journal of Clinical Psychiatry, 76, 155-162.
Gruenewald TL, Kemeny ME, Aziz N & Fahey JL (2004). Acute threat to the social self: Shame, social self-esteem, and cortisol activity. Psychosomatic Medicine, 66, 915-924. Hamilton JL, Stange JP, Shapero BG, Connolly SL, Abramson LY & Alloy LB (2013).
Cognitive vulnerabilities as predictors of stress generation in early adolescence: Pathway to depressive symptoms. Journal of Abnormal Child Psychology, 41, 1027-1039.
Hammen CL (2006). Stress generation in depression: Reflections on origins, research, and future directions. Journal of Clinical Psychology, 62, 1065-82.
Hankin BL, Fraley RC, Lahey BB & Waldman ID (2005). Is depression best viewed as a continuum or discrete category? A taxometric analysis of childhood and adolescent depression in a population-based sample. Journal of Abnormal Psychology, 114, 96-110. Herbert J, Goodyer IM, Grossman AB, Hastings MH, De Kloet ER, Lightman SL, Lupien
SJ, Roozendaal B & Seckl JR (2006). Do corticosteroids damage the brain? Journal of
Neuroendocrinology, 18, 393-411.
Hobfoll SE, Johnson RJ, Ennis N & Jackson AP (2003). Resource loss, resource gain, and emotional outcomes among inner city women. Journal of Personality and Social
Hosseinichimeh N, Rahmandad H, Jalali MS & Wittenborn AK. (2015a). Using indirect
inference method for parameter estimation in dynamic models. Manuscript in
preparation.
Hosseinichimeh N, Rahmandad H & Wittenborn AK (in press). Modeling the hypothalamus-pituitary-adrenal axis: A review and extension. Mathematical Biosciences.
Hosseinichimeh N, Wittenborn AK, Rick J, Mclaughlin KA & Rahmandad H. (2015b).
Rumination as a mediator exacerbating depression by keeping a stressful event alive.
Manuscript in preparation.
Hu K, Rahmandad H, Smith-Jackson T & Winchester W (2011). Factors influencing the risk of falls in the construction industry: A review of the evidence. Construction Management
and Economics, 29, 397-416.
Insel TR (2014). The NIMH Research Domain Criteria (RDoC) Project: Precision medicine for psychiatry. American Journal of Psychiatry, 171, 395-397.
Insel TR & Wang PS (2009). The STAR*D trial: Revealing the need for better treatments.
Psychiatric Services, 60, 1466-1467.
Joiner TE, Wingate LR & Otamendi A (2005). An interpersonal addendum to the
hopelessness theory of depression: Hopelessness as a stress and depression generator.
Journal of Social & Clinical Psychology, 24, 649-664.
Kendler KS, Gardner CO & Prescott CA (2002). Toward a comprehensive developmental model for major depression in women. American Journal of Psychiatry, 159, 1133-1145. Kendler KS, Gardner CO & Prescott CA (2006). Toward a comprehensive developmental
Kendler KS, Zachar P & Craver C (2011). What kinds of things are psychiatric disorders?
Psychological Medicine, 41, 1143-1150.
Kirsch I, Deacon BJ, Huedo-Medina TB, Scoboria A, Moore TJ & Johnson BT (2008). Initial severity and antidepressant benefits: A meta-analysis of data submitted to the Food and Drug Administration. PLoS Medicine, 5, e45.
Lacro RV, Dietz HC, Sleeper LA, Yetman AT, Bradley TJ, Colan SD, Pearson GD, Selamet Tierney ES, Levine JC, Atz AM, Benson DW, Braverman AC, Chen S, De Backer J, Gelb BD, Grossfeld PD, Klein GL, Lai WW, Liou A, Loeys BL, Markham LW, Olson AK, Paridon SM, Pemberton VL, Pierpont ME, Pyeritz RE, Radojewski E, Roman MJ, Sharkey AM, Stylianou MP, Wechsler SB, Young LT & Mahony L (2014). Atenolol versus Losartan in children and young adults with Marfan's Syndrome.
The New England Journal of Medicine, 371, 2061-71.
Lovejoy MC, Graczyk PA, O'hare E & Neuman G (2000). Maternal depression and parenting behavior: A meta-analytic review. Clinical Psychology Review, 20, 561-592.
Maier SF, Amat J, Baratta MV, Paul E & Watkins LR (2006). Behavioral control, the medial prefrontal cortex, and resilience. Dialogues in Clinical Neuroscience, 8, 397-406.
Mccall WV & Dunn AG (2003). Cognitive deficits are associated with functional impairment in severely depressed patients. Psychiatry Research, 121, 179-184.
Mcginn LK, Cukor D & Sanderson WC (2005). The relationship between parenting style, cognitive style, and anxiety and depression: Does increased early adversity influence symptom severity through the mediating role of cognitive style? Cognitive Therapy and
Mcintyre RS, Cha DS, Soczynska JK, Woldeyohannes HO, Gallaugher LA, Kudlow P, Alsuwaidan M & Baskaran A (2013). Cognitive deficits and functional outcomes in Major Depressive Disorder: Determinants, substrates, and treatment interventions.
Depression and Anxiety, 30, 515-527.
Miller AH, Maletic V & Raison CL (2009). Inflammation and its discontents: The role of cytokines in the pathophysiology of major depression. Biological Psychiatry, 65, 732-741.
Mössner R, Mikova O, Koutsilieri E, Saoud M, Ehlis A-C, Müller N, Fallgatter AJ & Riederer P (2007). Consensus paper of the WFSBP Task Force on Biological Markers: Biological markers in depression. World Journal of Biological Psychiatry, 8, 141-174. Nolen-Hoeksema S & Morrow J (1991). A prospective study of depression and posttraumatic
stress symptoms after a natural disaster: The 1989 Loma Prieta earthquake. Journal of
Personality and Social Psychology, 61, 115-121.
Paddon-Jones D (2006). Interplay of stress and physical inactivity on muscle loss: Nutritional countermeasures. The Journal of Nutrition, 136, 2123-2126.
Padesky CA (1994). Schema change processes in cognitive therapy. Clinical Psychology &
Psychotherapy, 1, 267-278.
Palagini L, Baglioni C, Ciapparelli A, Gemignani A & Riemann D (2013). REM sleep dysregulation in depression: State of the art. Sleep Medicine Reviews, 17, 377-390. Pariante CM & Lightman SL (2008). The HPA axis in major depression: Classical theories
Peng G-P, Feng Z, He F-P, Chen Z-Q, Liu X-Y, Liu P & Luo B-Y (2015). Correlation of hippocampal volume and cognitive performances in patients with either mild cognitive impairment or Alzheimer's disease. CNS Neuroscience & Therapeutics, 21, 15-22. Pettit JW & Joiner TE (2006). Chronic depression: Interpersonal sources, therapeutic
solutions. American Psychological Association: Washington, DC.
Pizzagalli DA (2014). Depression, stress, and anhedonia: Toward a synthesis and integrated model. Annual Review of Clinical Psychology, 10, 393-423.
Rahmandad H & Sterman JD (2012). Reporting guidelines for simulation-based research in social sciences. System Dynamics Review, 28, 396-411.
Richardson GP (1999). Feedback thought in social science and systems theory. Pegasus Communications: Waltham, MA.
Sapolsky RM (2000). Glucocorticoids and hippocampal atrophy in neuropsychiatric disorders.
Archives of General Psychiatry, 57, 925-935.
Seok J, Warren HS, Cuenca AG, Mindrinos MN, Baker HV, Xu W, Richards DR, Mcdonald-Smith GP, Gao H, Hennessy L, Finnerty CC, López CM, Honari S, Moore EE, Minei JP, Cuschieri J, Bankey PE, Johnson JL, Sperry J, Nathens AB, Billiar TR, West MA, Jeschke MG, Klein MB, Gamelli RL, Gibran NS, Brownstein BH, Miller-Graziano C, Calvano SE, Mason PH, Cobb JP, Rahme LG, Lowry SF, Maier RV, Moldawer LL, Herndon DN, Davis RW, Xiao W, Tompkins RG,
Abouhamze A, Balis UGJ, Camp DG, De AK, Harbrecht BG, Hayden DL, Kaushal A, O’keefe GE, Kotz KT, Qian W, Schoenfeld DA, Shapiro MB, Silver GM, Smith RD, Storey JD, Tibshirani R, Toner M, Wilhelmy J, Wispelwey B, Wong WH & The Inflammation Host Response to Injury Large Scale Collaborative Research
Program (2013). Genomic responses in mouse models poorly mimic human
inflammatory diseases. Proceedings of the National Academy of Sciences of the United
States of America, 110, 3507-3512.
Slopen N, Kubzansky LD & Koenen KC (2013). Internalizing and externalizing behaviors predict elevated inflammatory markers in childhood. Psychoneuroendocrinology, 38, 2854-2862.
Stapelberg NJC, Neumann DL, Shum DHK, Mcconnell H & Hamilton-Craig I (2011). A topographical map of the causal network of mechanisms underlying the relationship between major depressive disorder and coronary heart disease. Australian & New
Zealand Journal of Psychiatry, 45, 351-369.
Sterman JD (2000). Business dynamics: Systems thinking and modeling for a complex world. Irwin/McGraw-Hill: Boston, MA.
Sterman JD (2006). Learning from evidence in a complex world. American Journal of Public
Health, 96, 505-514.
Stewart WF, Ricci JA, Chee E, Hahn SR & Morganstein D (2003). Cost of lost productive work time among US workers with depression. Journal of the American Medical
Association, 289, 3135-3144.
Strüber N, Strüber D & Roth G (2014). Impact of early adversity on glucocorticoid regulation and later mental disorders. Neuroscience & Biobehavioral Reviews, 38, 17-37.
Van De Leemput IA, Wichers M, Cramer AOJ, Borsboom D, Tuerlinckx F, Kuppens P, Van Nes EH, Viechtbauer W, Giltay EJ, Aggen SH, Derom C, Jacobs N, Kendler KS, Van Der Maas HLJ, Neale MC, Peeters F, Thiery E, Zachar P & Scheffer M (2014). Critical slowing down as early warning for the onset and termination of
depression. Proceedings of the National Academy of Sciences of the United States of
America, 111, 87-92.
Van Dongen HPA, Maislin G, Mullington JM & Dinges DF (2003). The cumulative cost of additional wakefullness: Dose-response effects on neurobehavioral functions and sleep physiology from chronic sleep restriction and total sleep deprivation. Sleep, 26, 117-126. Wainwright SR & Galea LM (2013). The neural plasticity theory of depression: Assessing the
roles of adult neurogenesis and PSA-NCAM within the hippocampus. Neural Plasticity, 2013, 805497.
Wichers M (2014). The dynamic nature of depression: A new micro-level perspective of mental disorder that meets current challenges. Psychological Medicine, 44, 1349-1360.
World Health Organization. (2008). The global burden of disease: 2004 update [Online]. (http://www.who.int/healthinfo/global_burden_disease/GBD_report_2004update_full.pdf ). Accessed 30 May 2012.
World Health Organization. (2014). Global health estimates 2014 summary tables [Online]. (http://www.who.int/healthinfo/global_burden_disease/estimates/en/index2.html). Accessed 24 August 2015.
Xiang L, Del Ben KS, Rehm KE & Marshall Jr GD (2011). Effects of acute stress-induced immunomodulation on Th1/Th2 cytokine and catecholamine receptor expression in human peripheral blood cells. Neuropsychobiology, 65, 12-19.
Ye S, Muntner P, Shimbo D, Judd SE, Richman J, Davidson KW & Safford MM (2013). Behavioral mechanisms, elevated depressive symptoms, and the risk for myocardial infarction or death in individuals With coronary heart disease: The REGARDS (Reason
for Geographic and Racial Differences in Stroke) study. Journal of the American College
of Cardiology, 61, 622-630.
Zunszain PA, Anacker C, Cattaneo A, Carvalho LA & Pariante CM (2011). Glucocorticoids, cytokines and brain abnormalities in depression. Progress in
Table 1. Results of PubMed search for articles on major depressive disorder 1980-2014 Terms 1 2 3 4 5 6 7 8 9 10 11 12 13 14 1. Cognitive bias 331 2. Rumination 11 263 3. Memory 3 8 296 4. Social isolation 4 4 1 363 5. Financial stress 0 0 2 9 280 6. Immune response 0 0 1 5 0 816 7. Cortisol 2 3 12 27 2 56 1884 8. Hippocampus 0 0 3 4 1 2 15 151 9. Sleep 3 6 4 7 11 43 127 0 2820 10. Gene 2 5 5 8 2 58 38 10 37 1552 11. Personality disorder 9 5 3 6 0 3 17 1 19 7 1225 12. Diet 2 0 0 0 0 24 5 0 11 15 3 294 13. Exercise 1 0 3 7 2 16 15 0 47 5 0 15 547 14. Early adverse experiences 6 4 0 2 0 10 21 8 1 40 16 0 1 347 Note: For a more comprehensive description of search terms and procedures, see Appendix A in the supplementary materials.
Figure 1. A simple model for illustration of feedback loops and stock variables. In the stock and
flow diagram on the left the stock variable “Regulatory Resources” is represented in a box, with Resource Development and Resource Erosion as its flows. Reinforcing loop “Resource Erosion” is indicated with an R sign, and the balancing loop “Resilience Building” with a B. Histograms for “Regulatory Resource” (Top) and MDD (bottom) are shown for a population of 1000 individuals. Each simulated individual is subjected to a distinct stream of normally distributed autocorrelated “Environmental Stress” noise and their level of Regulatory Resources and MDD are reported at the end of 100 months of simulation. The noise streams have identical parameters and only differ in their random realizations. Two scenarios are shown: without any feedbacks (i.e., constant “Regulatory Resource”) (gray) and with both feedbacks active (black). Full
equations and instructions for replicating the simulations consistent with reporting guidelines for simulation models (Rahmandad & Sterman, 2012) are available in Appendix B of the
Figure 2. Causal loop diagram of cognitive dimension. References for each link are represented
by the numbers on the diagram and the reference list is available in Appendix C of the supplementary materials.
Figure 3. Causal loop diagram of cognitive, social, and environmental dimensions. References
for each link are represented by the numbers on the diagram and the reference list is available in Appendix C of the supplementary materials.
Figure 4. Causal loop diagram of cognitive, social, environmental, and biological dimensions.
References for each link are represented by the numbers on the diagram and the reference list is available in Appendix C of the supplementary materials.