Definitions of Robust Structural Geometries:
Metrics and Form Finding
By
Steven Cerri
B.Eng. Civil Engineering
McGill University, Faculty of Engineering (2014)
MASSACHUSETTS INSTITUTE OF TECHNOLOGY
JUN 07 2016
LIBRARIES
ARCHIVES
Submitted to the Department of Civil and Environmental Engineering
in partial fulfillment of the requirements for the degree of
MASTER OF ENGINEERING IN CIVIL AND ENVIRONMENTAL ENGINEERING
at the
MASSACHUSETTS INSTITUTE OF TECHNOLOGY
June 2016
0 2016 Steven Cerri. All Rights Reserved.
The author hereby grants MITpermission to reproduce and distribute publicly paper and electronic copies of this thesis document or in part any medium now known or hereafter created
Signature of Author:
Certified by:
Certified by:
Accepted by
___Signature redacted
Department of Civil and Environm
ptal
Engineering
May 10th, 2016
iSignature
redacted
Lecturer in Civil and Env'
ental Engineering
Th~~sn
s Sufisor
Signature redacted
John (khsendorf
Professor of C 11 and Enviropmental Engineering
/
Thesis Supqvjsor
____________Signature redacted
/
'
Heidi M. Nepff
Donald and Martha Harleman Professor of Civil and Environmental Engineering
Definitions of Robust Structural Geometries:
Metrics and Form Finding
By:
Steven Cerri
Submitted to the Department of Civil and Environmental Engineering On May 10th, 2016, in partial
fulfillment
of the requirements for the Degree of Master of Engineering in Civil and Environmental EngineeringAbstract
Robustness varies highly between applications and consequently it is difficult to precisely quantify. However, robustness is a property of a structural system and thus can be described as a function of its form; in other words, as a function of topology, geometry and member properties. This thesis investigates the relationship between both a structure's geometry and topology, and robustness. Two quantitative metrics are proposed to quantify a structure's robustness as a function of geometry. The first metric is a measure of a member's importance relative to others in the redundancy of a structural system. The second metric characterizes the robustness efficiency of the entire structure. These metrics are developed using a novel analysis method coupled with an interactive MATLAB script which infers properties of a redundant structure through the analysis of its stable substructures. Together, these metrics give designers a powerful tool to evaluate the robustness of their preliminary structural design based soled on geometry and static equilibrium. Moreover, using these metrics, geometry optimization techniques are then implemented to discover robust structural geometries for given topologies and the general parameters that describe them.
KEYWORDS: Robustness, Redundancy, Structural Form, Geometry Optimization, Substructures
Thesis Supervisor: Corentin Fivet
Title: Lecturer in Civil and Environmental Engineering Thesis Supervisor: John Ochsendorf
Acknowledgments
Along the course of the past year I have received the advice and support from a great number of individuals. I would first like to thank my thesis advisor Dr. Corentin Fivet for his immense help in development of this thesis. He was always available for all my questions and never failed to provide guidance and suggestions for every chapter of this thesis. Without him and his expertise this work would not be possible.
I would also like to thank Prof John Ochsendorf as the final reviewer of this work. I
am indebted for his valuable comments and review.
Additionally, I would like to offer a very special thanks to Julie Wiley for her review of this work along with her patience, support and encouragement throughout my studies at MIT.
Finally, I would like to express my profound gratitude to my parents, family and friends, especially the M.Eng. class of 2016, for their unfailing support and continuous encouragement throughout this work and my studies.
Table of Contents
LIST OF FIGURES... 8
1. IN TRODUCTION ... 9
1.1 Rationale... 9
1.2 Redundancy and Robustness ... 10
1.3 Organization of the Thesis... 12
2. M ETHODOLOGY ... 13
3. LITERATURE REVIEW ... 15
3.1 Robustness M etrics ... 15
3.2 Geom etry Optim ization... 18
3.3 Robustness Optim ization... 18
4. SUBSTRUCTURE AN ALY SIS ... 19
4.1 Substructure Definition ... 19
4.2 Substructure Creation for a 2D Truss... 21
5. REDUNDANCY QUALITY AND RESIDUAL CAPACITY ... 23
5.1 Redundancy Quality Index (RQI)... 23
5.2 Residual Capacity Index (RCI)... 27
5.3 Loading Condition ... 29
5.4 Comparison w ith Established M etrics ... 30
5.5 RQI and RCI for Selected Topologies... 32
6. GEOM ETRY OPTIM IZATION ... 34
6.1 M inim izing RQI Variance ... 35
6.2 M axim izing RCI ... 36
6.3 Results for selected topologies ... 36
6.3.1 Bridge Truss... 36
6.3.2 Braced Fram e... 39
6.4 Design Space Exploration ... 41
6.5 Strain Energy -RCI Relationship... 42
7. CON CLU SION S AN D FUTURE W ORK: ... 43
LIST OF FIGURES
Figure 1-1: Some possible hanger systems for a vertical load ... 11
Figure 3-1:Normalized Redundancy factors for a four-floor 2D truss (Tibert and Achi 2012) ... 1 7 Figure 4-1 : Substructure deconstrucution ... 20
Figure 4-2: Valid substructures for a portal frame considering connection flexural capacity fa ilu re ... 2 1 Figure 4-3: Subnetwork creation algorithm ... 22
Figure 5-1: Robustness Indices for a Simple Hanger System ... 23
Figure 5-2: Hanger system with a low quality robustness in member 2... 24
Figure 5-3: Subscores for Valid Substructures ... 26
Figure 5-4: RQI for hanger system with adjusted geometry ... 26
Figure 5-5: RQI Dashboard for hanger 5-1 and 5-4... 27
Figure 5-6: Visual representation of the hangers RCIs ... 28
Figure 5-7: RCI for two different hanger geometry... 28
Figure 5-8: RQI and RCI for a hanger subjected to a lateral load ... 29
Figure 5-9: Comparison of Tibert and Achi scores (a and c) and the RQI values of this thesis (b an d c )... 3 0 Figure 5-10 : (a) Symmetric Bridge; (b) Anti-Symmetric Bridge; (c) Cantilever One Load; (d) Cantilever Two Loads; (e) Braced Frame; (f) Wheel; (g) Space Truss ... 33
Figure 6-1: Minimal variance RQI geometries for simple hanger system... 34
Figure 6-2: Initial geometry and constraints for bridge topology... 37
Figure 6-3: Minimum RCI variance geometry -Bridge ... 37
Figure 6-4: Element RQI dashboard for optimal RQI variance geometry -Bridge ... 37
Figure 6-5: Maximum RCI geometry -Bridge... 38
Figure 6-6: Element RQI dashboard for optimal RCI geometry-Bridge ... 38
Figure 6-7: Initial geometry and constraints for braced frame ... 39
Fig-re 6-8: Minimal RQI variance solution -Braced Fram... 9
Figure 6-9: Maximum RCI geometry- Braced Frame... 40
Figure 6-10: Element RQI dashboard for optimal RCI geometry-braced Frame... 40
Figure 6-11: Design Space for Bridge Topology... 41
Figure 6-12: Strain Energy- RCI Relationship ... 42
LIST OF TABLES Table 5-1:Sum m ary of RQI values ... 26
1. INTRODUCTION
A structure can be divided into three main categories: topology, geometry and member
properties. Together, these categories dictate every aspect of the structure's behavior and performance such as its stiffhess, frequency as well as stress and strain response. One of these behaviors, the ability to survive an unforeseen and unusual circumstance, can be described as the structure's robustness. Thus, a robust structure can be defined as one that can withstand certain arbitrary damage state. Robustness varies highly between applications and consequently it is difficult to precisely quantify. However, being a behavior of the structure, it can also be described as a function of the structure's topology, geometry and member/material properties. Therefore, modifications to these properties can directly impact the structure's
robustness.
With regards to topology, the introduction of redundant members into the structure's topology can be a simple way of generally improving robustness. Moreover, an increase in member sizes to provide excess capacity can also generally increase robustness. However, the relationship between the structure's geometry and robustness is not as simple. This thesis investigates the relationship between a structure's form, through geometry, and its robustness. Two quantitative metrics are first proposed to quantify a structure's robustness as a function of its topology and geometry. Using strain energy, these metrics describes and relates the ability of a structure to survive the localized removal of an element, the removal of a limited part of the structure or the occurrence of an acceptable localized damage to its geometry. For conciseness, such an event is now referred to as a detrimental event. Using these metrics, geometry optimization techniques are then implemented to discover robust geometries and the general parameters that describe them.
1.1 Rationale
Typically, the design of a structural system is oriented to the intended normal use of the structure. In other words, the system is designed for circumstances which can be anticipated to exist during the life of the system. The shortcomings of this design philosophy is that the structure is susceptible to events which were not originally anticipated to exist. Moreover, the structure may also be susceptible to an unforeseen increase in magnitude of an expected load. Although one may attempt to incorporate additional loading conditions into the design of the structure in order to anticipate unusual circumstances, the number of unforeseen conditions
still remains infinite. Therefore, there is a need to equip structures with robustness in order to account for the unforeseen conditions. Without robustness, there is an impossible need to design for the unforeseeable.
The use of appropriate safety factors on applied loads and member properties may be seen as a way of accounting for the innate variability in loadings of structural systems and negate the need for robustness. Namely, by increasing the magnitude of the known loading conditions, the unforeseeable conditions can be accounted for. However, despite the large amount of work dedicated to determine appropriate safety factors, structural failures do occur every year to the dismay of the population and the detriment of the economy; therefore, they are not adequate in ensuring that a system has sufficient robustness. The reason for these failures is varied, from extreme events to accidental or hostile actions of groups and individuals. Furthermore, the structural system itself may contain flaws which can cause failure under anticipated loads such as material deterioration, construction flaws and most notably human error. There is therefore a need to equip a system with a property of robustness to survive detrimental events.
1.2 Redundancy and Robustness
In order for a system to survive a detrimental event it must be equipped with additional members which were not strictly necessary to the functioning of the original system. The inclusion of supplementary members is known as structural redundancy. A non-redundant (statically determinate) structure can be classified as a "weakest-link" structure. Therefore, the loss of any element will result in the formation of a mechanism and the loss of the structure (Frangopol and Curley 1987). Redundancy is achieved by introducing structural indeterminacy to the system. A structure is indeterminate when it is stable and that the number of available degree of freedoms (DOF) is smaller than the number of inner response reactions(A). This relationship for a 2D structure is presented below,
DOF< A ->ET+3Ef+F<2Nt+3Nf+R (1)
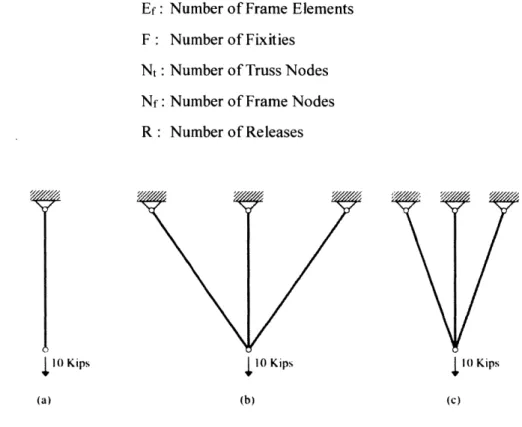
Ef: Number F: Number Nt: Number Nf: Number R : Number of Frame Elements of Fixities of Truss Nodes of Frame Nodes of Releases
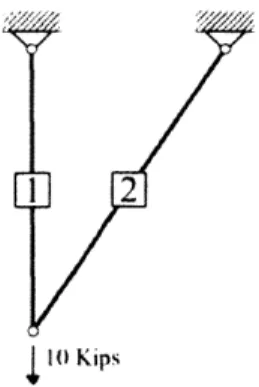
{10
Kips (b) 10 Kips (c)Figure 1-1: Some possible hanger systems for a vertical load
Figures 1 (a), (b) and (c) demonstrate three possible hanger systems for a vertical load. Figure 1 (a) is a non-redundant single element hanger system. This system is statically determinate and consequently has no redundancy. Figures 1 (b) and (c) are systems in which indeterminacy and thus redundancy and robustness are introduced. Although the topologies and the redundancy of the figures are identical, their residual capacities after a detrimental event are not. Although both figures (b) and (c) have an equal number of redundancies, their overall robustness is not the same. This is clear when considering the loss ofthe central member due a detrimental event. The residual capacity of the system in figure 1-1 (c) will have a lower strain energy and thus be better suited to withstand the applied force than the system in figure in 1-I (b). Therefore, the geometry of a system plays a vital role in the robustness of the system. Although the robustness of both systems are different there is a need to precisely quantify this difference in order to implement geometric optimization and discover robust structural forms. In this thesis two novel indices, the robustness quality index (RQI) and the residual capacity
index (RCI), are used to quantify the robustness of a system. Both of these indices are based
off a novel analysis method, the Substructure Analysis method, which determines properties of 0
1 1 Kips (a)
a redundant structural system through the analysis of its stable substructures. A substructure is formally defined in chapter 4 of this thesis.
1.3 Organization of the Thesis
This thesis is organized as follows. In the next chapter, an overview of the methodology used to conduct this research is presented. Chapter 3 consists of a literature review and assessment of the current state of the art of robustness metrics and their implementations in geometry and robustness optimization. In chapter 4, the Substructure Analysis method is explained in full. Moreover, an overview of the interactive MATLAB (The MathWorks 2016) script used to perform the analysis is presented. In chapter 5, the Substructure Analysis framework from chapter 4 is used to calculate the RQI and RCI for redundant trusses. The indices are also compared versus established robustness metrics from the literature review. A summary of results for select topologies is presented at the end of the chapter. Chapter 6 implements optimization techniques to study the influence of varying geometries on both of the proposed robustness indices. Moreover, conclusions are drawn for general methods of improving the indices through geometry modifications without performing a Subnetwork Analysis.
2. METHODOLOGY
The main focus of the proposed study of work is to determine the relationship between both a structure's geometry and topology, and robustness. The main hypothesis of the study is that such a relationship exists and that a metric which encompasses this relationship can be determined.
The study begins with an extensive literature review of the current state of the art. From the review, it is determined that many metrics have been proposed to attempt to quantify robustness. However, using these metrics as a guide to adopt and modify the geometry of a structure has not been previously proposed. The pros and cons of the current metrics are then analysed and used as a guide for the creation of the new metric. Generally, the validity of any new metric can be evaluated based of the following general requirements: expressiveness, objectivity, simplicity, calculability and generality (Starossek and Haberland 2011).
Two novel robustness metrics, referred to as the redundancy quality index (RQI) and the
residual capacity index (RCI), are devised using a method referred to as a subnetwork analysis.
The fundamental premise of the subnetwork analysis is that any redundant structural network can be decomposed into possible subnetworks. These subnetworks are formed through the removal of a member or through the loss of a fixity or support in the original network. Using these networks, general properties of the original system are inferred. In this thesis, these subnetworks, specifically the stable ones, are used to create the RQI for each member in a structure and the RCI. For these metrics, the substructures represent possible stable damaged states of the original structure. The residual performance of the substructures, measured as a ratio of strain energy, represents possible residual capacities after a detrimental event. The importance of each element in the original system can be found by combining the scores of each subnetwork the element is a member of This summed score is the RQI for the member and indicates the importance of a member in the original structure's overall redundancy. The RCI is defined as the summation of all the RQI across every member. Once the RQI and RCI are formed a second literature review is performed in order to assess the current state of the art and possibility of similar methods.
In order to facilitate the calculation of the RQI and RCI a script is written in MATLAB (The MathWorks 2016) in order to determine the substructures of any redundant truss for a
given loading. The script is verified through the comparison of the results for a simple truss to the results of a manual analysis in order and ensures that all the substructures are found.
A second script is written in MATLAB (The MathWorks 2016) in order to manipulate the
structure's geometry and investigate the effects of geometry on the member RQIs and the RC. This script randomly manipulates the location of selected nodal geometries and computes the RQIs for each member in the original system as well as the RC. The indices, geometries as well as several other properties are then stored for comparison against different geometries.
A Pareto efficiency analysis is used to compare and contrast the relationships between the
structure's geometry, both indices and their properties. Conclusions on optimal robust geometries are drawn through visually investigating the trends shown on the Pareto fronts. Once the robustness-geometry conclusions are drawn a final literature review is performed to ensure the novelty of the thesis's contribution to the field of structural optimization and structural robustness.
3. LITERATURE REVIEW
Although the property of robustness is difficult to quantify, given the variability of structural systems, general guidelines can be provided as a means of achieving robustness. The Eurocode recognises the need for robustness and requires the appropriate choice of one or more of the following measures :(1) Avoiding, eliminating or reducing the hazard which the structure can
be subjected. (2) Selecting a structural form which has a low sensitivity to the hazard
considered. (3) Selecting a structural form and design that survive adequately the accidental removal of an individual element or a limited part of the structure or the occurrence of acceptable localised damage. (4) Avoiding as far as possible a structural system that can collapse without warning. (5) Tying the structural members together (CEN 2006). Measures
(2) and (3) enforces the relationship between form and robustness indicating that robustness can be achieved through the selection of the appropriate form. However, the selection of said form is at the discretion of the designer and the Eurocode gives little guidance towards its proper selection. Therefore, there is a need for a better understanding of the relationship between form and robustness. An accurate robustness metric can further this understanding and guide the designer towards robust structural forms.
3.1 Robustness Metrics
Multiple attempts have been made to quantify certain aspects of robustness but no consistent and general theory has been produced (Starossek and Haberland 2011). A stiffness based metric has been created by Haberland (2007) to quantify the robustness of a system associated with the loss of an element or section of the structure. The formulation of this metric is calculated
by examining the static system stiffness as follows:
= det
K-nj det KO (2)
where Rs is the stiffness based robustness metric, Kj is the stiffness matrix of the structure after the removal of an element or connection, Ko is the active stiffness matrix ofthe intact structure. The advantages of this metric is that it is simply defined and easy to calculate. However, it was shown, through simple load capacity calculations on simple frame structures, that the corresponding residual strength of the system and the metric showed very low levels of correlation (Haberland 2007). Nevertheless, given its simplicity and ease of the calculation a modified form of the equation may reveal interesting results.
Biondini and Restelli (2008) have developed several metrics based solely on the properties of the structural system under different loadings. Notably, the metrics ps and pe can provide an effective measure of structural robustness. Both of these metrics are scenario-dependant. Thus, they compare the system's properties, given an applied load, before and after the partial or total loss of an elements capacity. The first metric, ps, is a ratio of the structural
displacements and is defined as:
SO Ps
=~-si (3)
where the subscripts "0" and "I" refer to the intact state and the damaged state of the structure respectively. The index s is the Euclidian scalar norm of the displacement vector s as shown in Eq. (3):
s =
ilsi
= |K-1 * fI1 (4)where K is the stiffness matrix of the system andf is the applied load vector. The second metric utilize the stored energy in the system. The stored energy, $, is defined as:
1
c=-sTf (5~)
The metric po is then defined as the ratio between the stored energies in the intact state and the damaged state as follows:
1 (6)
Biondini and Restelli have established that both of these metrics have demonstrated a close correlation with the damage level of a single member in a statically determinate truss system. Although the aforementioned metrics show close correlation to damage levels, they require the designer to predict which element will suffer damage. A generalized robustness metric should encompass the vulnerability of all the system's elements since it is impossible to accurately predict which ones will succumb to damage. Moreover, the metrics do not indicate which of the system's elements are contributing most to its robustness. This makes it difficult for a designer to identify the source of the robustness and more importantly optimize
robustness. Nevertheless, the simplicity and calculability of the proposed metrics still make for a very interesting way to quantify robustness.
Tibert and Achi (2012) have proposed a static redundancy factor which aims to visually distinguish non-redundant regions from overly redundant regions in complex truss systems. The method described determines the contribution of each element to the total degree of static indeterminacy of the original structure. Therefore, it uses the degree of indeterminacy as a measure of structural robustness. The advantage of this method is that it is done without considering a specific load case and thus only considers the topology, geometry, constraints and element properties of the structure. The results for the proposed method on a 2D truss system are shown in figure # 3-1. The darker red elements indicate a highly redundant member while the dark blue elements indicate an element which cannot be removed from the system(Tibert and Achi 2012).
7
~1
zz
7
~....
...
I
1 100 60 40 ( )Figure 3-1:Normalized Redundancy factors for a four-floor 2D truss (Tibert and Achi 2012)
17
3.2 Geometry Optimization
The use of geometry optimization in structural engineering application has become more readily accepted and utilized. Typical design goals include stress minimization, stiffness, displacement and frequency optimization as well as weight and overall cost reduction (Munk, Vio, and Steven 2015). These design criteria have been applied, with success, to a wide variety of structures ranging from simple trusses to tall buildings and stadiums. Moreover, multi-objective optimization has been implemented to allow designers to examine a wide range of goals simultaneously.
In 1904, Michell (1904) presented the optimal discrete truss structure which we now know as Michell structures. This can be seen as an early application of optimization techniques to the field of structural engineering. Although a majority of his early work focused on cross section optimization, it has been shown that topology and geometry optimization have a greater impact on structural performance and thus the amount of publications on this topic has seen an exponential increase (Munk, Vio, and Steven 2015). Generally, the design variables for geometric optimization are assumed continuous and numerical search algorithms are implemented to find the optimum solution (Kirsch 1993).
3.3 Robustness Optimization
The need for robustness in optimized structures has been studied in several papers. The focus of these studies has been on the sensitivity of a structure's topology to small design parameter variations such as material properties, geometry and loading variations. A method was demonstrated by Richardson et al (2015) for optimizing a discrete variable truss structure for a robust topology subjected to loading and material uncertainties. Although a different component of robustness is being optimized for, the sensitivity of the system to variations in design parameters is an important consideration.
The state of the art review has demonstrated that little has been done with regards to geometry optimization for robustness. In general, the fields of robustness and optimization seem to be segregated and little research has been done on combining both fields. This can be explained by inherent nature of the two fields. Robustness is difficult to quantify and fully encompass in a single metric while optimization requires a quantifiable parameter to be optimized for.
4. SUBSTRUCTURE ANALYSIS
In this chapter a novel method, know as a Substructure analysis, is presented. The general premise of this analysis method is that given a certain loading condition, any stable robust system can be broken down into its stable substructures. These substructures, and their properties, are then used to determine specific qualities of the original system. For this thesis, the properties of the substructures are used to calculate the RQI and RCI metrics.
4.1 Substructure Definition
In general, a substructure is defined as any structure which is a deconstruction of an original
structure. This deconstruction is done through the removal ofan element or fixity in the original structure. Therefore, the number of possible substructures for a frame is defined as follows:
# of Substructures = 2 Elements * 2Fixities (7)
Where the number of fixities is defined as the number of supports and the number of possible moment releases in the frame. For a truss, a loss of a fixity is equivalent to the loss of all the members which are connected to the fixity and thus the number of substructures for a truss is equaled to:
# of Substructures = 2 Elements (8)
Although Eq. 7 and 8 give an upper bound on the number of substructures possible, the ones of interest for this thesis are the ones that are stable. Furthermore, substructures which contain zero force members are not of interest since they can be removed to create a more fundamental substructure. A valid substructure is one that meets all the conditions presented above. In doing so, the valid substructure will represent a possible alternate load path configuration of the original system. Therefore, the substructures are representative of possible stable damaged configurations and thus all the valid substructures are all the possible ways a structure can remain stable after a detrimental event. For conciseness, the word substructure will indicate a valid substructure from this point forward unless otherwise noted.
10 Kips (a) 10 Kips (b) 10 Kips 10 Kips (C) 10 Kips (d) (C)
Figure 4-1 : Substructure deconstrucution
The possible substructures for a simple hanger system are illustrated in figure 4-1. In this
example, only Figures 4 (b) and 4(c) represent valid substructures. Although Figures 4(d) and (e) represent valid damaged states they also contain zero force members. Therefore, these substructures are identical to the system shown in Figure 4(c) and are not considered as valid substructures in the Substructure analysis.
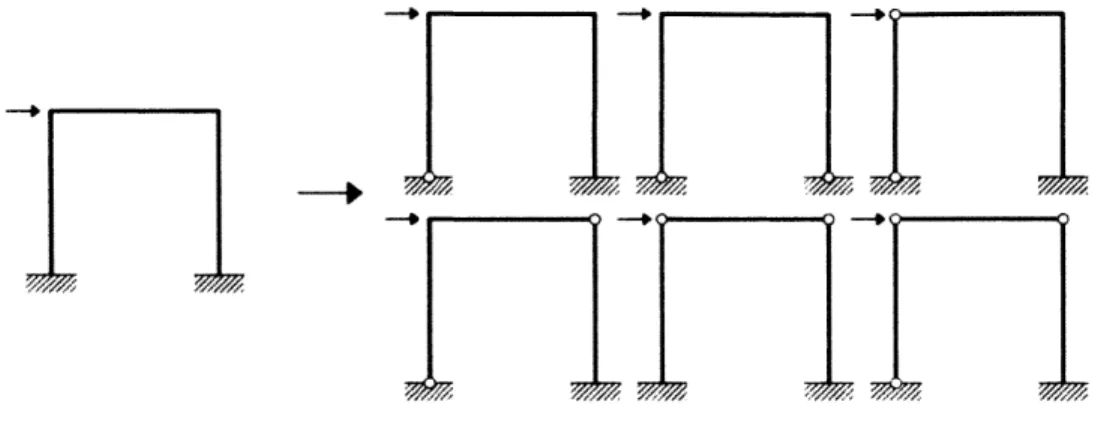
The same process can be used to decompose frame structures. However, unlike truss structures which act only in axial tension and compression, the possibility of a loss of fixity, in the form of a loss of moment resisting capacity must also be considered. Figure 4-2 shows the possible substructures for a simple portal frame structure subjected to a lateral load. The
occurrence of a possible loss of moment capacity was only considered at the connections. For clarity, the symmetric versions of the shown substructures are omitted.
4-1 A
~
7,77, 41Figure 4-2: Valid substructures for a portal frame considering connection flexural capacity failure
4.2 Substructure Creation for a 2D Truss
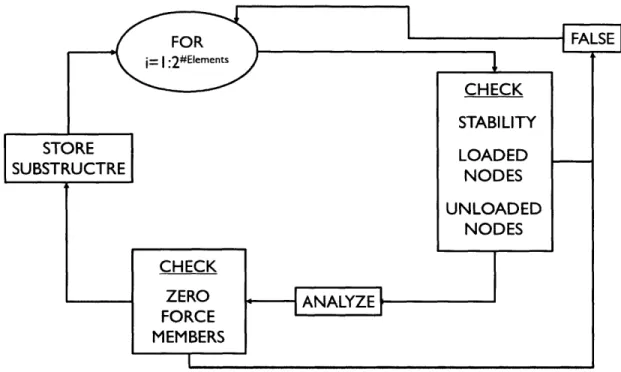
The subnetwork analysis algorithm used in this thesis is an iterative approach which determines the valid subnetworks for an initial stable redundant structure. The algorithm can be summarized in three repeated steps: subnetwork creation, subnetwork validation and finally index scoring. This algorithm is illustrated in Figure 8 and is implemented in MATLAB@ (The MathWorks 2016) as follows. Initially, each member in the initial configuration is assigned a Boolean toggle. The true condition indicates the member is a part of the subnetwork and conversely a false condition indicates the member is not a part of the possible subnetwork. Each iteration of the algorithm creates a possible subnetwork state in which the elements are in a combination of being in either their true or false state.
FOR FLSE j= I:2#Elements-[T CHECK STABILITY STORE LOADED __ SUBSTRUCTRE NODES UNLOADED NODES CHECK ZERO FORCE MEMBERS
Figure 4-3: Subnetwork creation algorithm
The validity of each subnetwork is then validated. Namely, the validation of the
stability, loaded nodes, unloaded nodes and the presence of zero force members. The initial validation is a general stability check using Maxwell's stability equation (Eq.6) for a 2D truss as demonstrated below:
2N 5 E + F -> Possibly Stable (9)
where N is the number of nodes, E is the number of elements and F is the number of fixities. The validation of the loaded nodes requires that every loaded node has a minimum of two elements connecting into it. This is required in order to ensure the stability of the loaded node. Likewise, every unloaded node requires three elements to be connecting into it in order to ensure that these elements are not zero force members. Finally, the structure is analysed and a check is performed to ensure that the substructure has no zero force members. These checks were ordered as a function of their computation times. The checks with better computing time are performed first to decrease the overall computation time of the program since a false return from any of the checks results in an invalid substructure. The algorithm's final step is to store the valid subnetworks for implementation in the calculation of the robustness metrics described in chapter 5.
5. REDUNDANCY QUALITY AND RESIDUAL CAPACITY
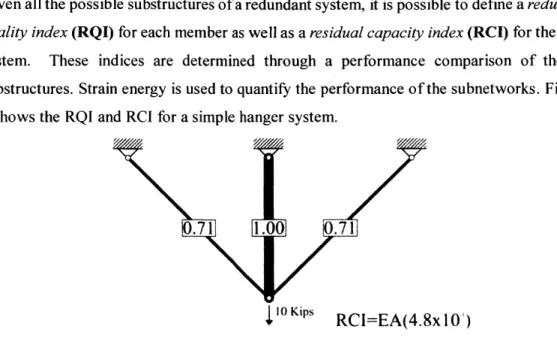
Given all the possible substructures of a redundant system, it is possible to define a redundancy
quality index (RQI) for each member as well as a residual capacity index (RCI) for the overall
system. These indices are determined through a performance comparison of the valid substructures. Strain energy is used to quantify the performance of the subnetworks. Figure
5-1 shows the RQI and RCI for a simple hanger system.
.71
1.00
.71
1 10OKips
RCI=EA(4.8x10)
Figure 5-1: Robustness Indices for a Simple Hanger System
5.1 Redundancy Quality Index (RQI)
The objective of the redundancy quality index (RQI) is to quantify, through a normalized score, the importance of a member in the overall robustness of a system for a given loading. If a member can be removed from the system without a major loss to the system's performance it would receive a low score, i.e., the removed member is not very important to the overall strength. In other words, the quality of the member's redundancy is very low. Conversely, if the member is very important it will receive a high score. This is shown in Figure 5-2, where
element 2 can be removed without the formation of a mechanism and thus the structure has one degree of redundancy. However, the removal of element 2 has no impact on the performance of the residual structure and therefore element 2 has a redundancy quality of zero. On the other hand, the removal of element 1 will result in the formation of a mechanism and thus is vital to the system. In this simple system, member I has an RQI of 1 and member 2 has an RQI of 2. It should be noted that element 2 is a zero force member and thus figure 5-2 is not a valid network.
2
10
KipsFigure 5-2: Hanger system with a low quality robustness in member 2
More formally, the RQI for an element is based off the summed performances of the subnetworks that the element is a part of. A high RQI indicates that the element is vital to the overall robustness of the structure. This can be due to it being part of a few vital, high performing, sub structures, many less performant substructures or a combination of both. Conversely, a low RQI indicates that the member has a low quality, thus it is not part of the high performing substructures or it is not in many substructures and thus a low quality of redundancy.
In this thesis, strain energy due to axial deformations is used as a performance metric and will be calculated per Eq.9 for a truss system.
#Elements F2 L
SE (S) = Y 2EA ' (9)
j=1
where SE(Si) denotes the strain energy of the substructure i.
For a frame system, the strain energy related to the bending of the elements is also included along with the axial strain and can be calculated per Eq. 10 as follows.
#Elements
SE(S) = I
f
2 dx (10)j=1
The strain energy due to shear deformation is neglected in frame structures. However, this shear strain energy should be included in systems where the prominent force flow path is shear.
relative strain energy have the highest residual capacity. The inverse of the strain energy, called the subscore, is taken to give high residual capacity systems, i.e., low strain energy, a high score and vice versa. This is illustrated in Eq. 11.
1
SubScore = SE (S(11)
The subscore is assigned to only the elements which are present in the respective substructure. Therefore, in equation form, a Boolean toggle is added to indicate if the element is a member of the subnetwork in question. The subscores of each element will then be summed across the
entire set of substructures they are a part of to give the final element RQI (Eq.12).
#Substructures
RQIElement = Subscore, * Boolean(i) =
#Substructures
Z 1lmet 2E1ements F 22 L'* BoeniBon=1
A (12)
#Substructures
EA * m F2L * Boolean(i)
The RQI represents the sum performance of the element in all the substructures and thus the importance of the element in the original system. In other words, the score represents the quality of the member's robustness. For clarity, the score is then normalized by the largest score. Therefore, the scores range in values from [0, 1]. Unless noted otherwise, the RQIs are represented in their normalized values. This is done since the interest in the RQIs stems from the difference between the values and not their magnitudes. In other words, what is important about the RQIs is by how much more a member is important in the system relative to the other members in the system.
The subscores for both valid subnetworks of the hanger system in figure 5-1 are shown in figure 5-3. A summary of the final element RQIs and their normalized values is shown in table 5-1. The depth of the hanger system is 10 feet and the total width is 20 feet.
3T1
-II
3'll
i IIKil( b
3
Figure 5-3: Subscores for Valid Substructures Table 5-1:Summary of RQI values
Element # Unnormalized RQI RQ1
I EAxl.41x10' .71
2 EAx2.0x10-3
3 EAx1.41x103 .71
The RQI values for each member are a function of the structure's geometry. Take for example the same hanger system with a total width of ten feet and a depth of ten feet. For comparison, both hangers are shown in figure 5-7. RQIs for this new geometry are shown below in figure 5-4. As shown below in figure, the most important element, namely the element with an RQI of one, has shifted from the central element to the exterior elements.
0.71
1.00 1.)00
1) Kip" R('I=EA(7.6x 10
Figure 5-4: RQI for hanger system with adjusted geometry
The member RQl can also be visualized by plotting the values for different geometries in descending order. This method is similar to the dashboard approach described by Verbeeck
(2015) in Structural Design by a Dashboard approach. The member RQI dashboards for
figures 5-1 and 5-4 are shown below in figure 5-5.
Element RQI Distribution
0 0.8 0.6 04 - 02- 0-Figure 5-4 --- Figure 5-1 3 2 Element
Figure 5-5: RQI Dashboard for hanger 5-1 and 5-4
5.2 Residual Capacity Index (RCI)
Although the RQI indicates which members in a redundant structural system are the most important, it lacks the ability to evaluate the residual capacity of the system. Moreover, comparisons cannot be made across different geometries. In order to address this problem, this thesis introduces a second scoring index called the Residual Capacity Index(RCl). The RCI measures the summed residual capacity of each member across all the subnetworks. In a functional form, the RCI is the summation of the RQI values before their normalization as
defined in Eq 13.
# Elements
RCI = j=1
RQI (13)
The score can also visually be interpreted by graphing the unnormalized element RQI scores in descending order. In this graph, the RCI score is represented by the area under the RQI curve. This process is shown in figure 5-6 for the hanger systems of figure 5-1 as well as figure 5-4. In this graph the top line represents the hanger from figure 5-4. The bottom line represents
the hanger from figure 5-1. The RCIs are shown for the hangers of figure 5-4 and figure 5-1 in figure 5-7.
LU 0
Unnormalized Element RQI Distribution
Figure 5-4 Figure 5-1 2-1.5 -0.5 - 0-2 3 Element
Figure 5-6: Visual representation of the hangers RCIs
//|
RCL=EA(4.SxIO
)
7-1 R.6x10
Figure 5-7: RCI for two different hanger geometry
Regardless of the geometry, the total number of valid Subnetworks for a fixed topology are the same. Moreover, each member will always be a part of the same Subnetworks. Therefore, a high RCI indicates that the given geometry arranges the topology so that the members have the
m
low RCI indicates that the topology is poorly arranged with the regards to residual capacity and thus the performance of the subnetworks is low. The RCI is a useful tool to compare a given topology across different geometries.
5.3 Loading Condition
Both of the indices, the RQI and RCI, of this thesis are based off the strain energy performance of the stable substructures of the original structural system. Since the strain energy of a structure is dependent on the magnitude and direction of the loading, the indices are also dependant of these factors. However, since the change of strain energy in the substructures is proportional to the magnitude the RQI values will be identical for the same direction of a load. The RCI values will decrease as a load is magnified, however the RCI values are used to compare across a fixed topology and loading and thus the initial magnitude of a load has no importance. Therefore, RQI and RCI values shown in figure 5-1 will be the same for any magnitude of load applied to the hangers.
The direction of the loading does significantly affects the indices of this thesis. For example, the RQI and RCI values for the hanger system in figure 5-1 subjected to a lateral load are shown in figure 5-8. For a lateral load, the exterior members become much more vital than the central member in resisting the load as demonstrated by the new scores. Therefore, it is important to choose the appropriate relative magnitudes of loading directions when analysing the redundancy quality scores. This choice should be based off the most expected loading condition. For the example, in the hanger case, the expected loading condition would be one caused by gravity downward with the addition of a marginal lateral load.
0.5
1.00
1.00
1
Kips RCI=EA(4.9x 10')5.4 Comparison with Established Metrics
In this section, the newly determined RQI values are compared to the scoring systems proposed
by Tibert and Achi (2012) in the literature review. It should be noted that in the scores proposed by Tibert and Achi, a lower value indicates a member which is more important in the system
while for the scores in this thesis, a lower value indicates a member of low importance in the system. To facilitate the comparison, the normalized values found by Tibert and Achi will be subtracted from 1.
0.79
.43 0.79
0.77 1.00 0.77
0
Kips (a)S36
7
0
[
8
82
1.00
1.00
10 Kips (c) (d)Figure 5-9: Comparison of Tibert and Achi scores (a and c) and the RQI values of this thesis
(b and c)
As it can be seen in figure 5-9, there is a significant difference when comparing the results from the Tibert and Achi method and the method proposed in this thesis. This difference can largely
be attributed to the loading conditions used for the metrics. The metric of this thesis is
dependent on a fundamental loading condition as explained in section 5.3. Conversely, the Tibert and Achi metric does not rely on a specific loading condition and is built simply from the contribution of the members to indeterminacy. It is for this reason that this metric increases the weight associated with the exterior members of the hanger in figure 5-9 (a).
Although the results are quite different, both metrics have their uses. For example, the Tibert and Achi metric may be used in a structure with no prevailing permanent loading condition present. On the other hand, the member RQI of this thesis are better suited for a structural system with a known distribution of possible loading conditions.
5.5 RQI and RCI for Selected Topologies
The following section is devoted to illustrating the member RQIs and the RCI for selected topologies and loading conditions. For all the figures the point loading is taken as 10 kips. In order to ensure the stability of the loaded nodes, a small force which is not shown is applied in the orthogonal direction of the shown loads.
.89A'
.8
0.8
0.8
.7
.7
1.00
.7.71.00
RCI=EA(.0 15)
(a)9
1.00
0.E7
1.00
..
8
1.00
1.00
1.00
I .0110.8 1.00 1.00RCI=EA(2.6x 10-)
(b)1.00
.7
.95
0.79
.8310.791
.8XA9
RCI=EA(1.4)
(c)RCI=EA(.81)
(d) 1.00.92
.92
0.93
.2
0.92
.91
0.92
1.00
.8
.82 .2.72
.9
'9
2.
.21
.75
.75
.97
1.00
1.00
.72
.72
1.00
.75
.75
-
~1.00
10
RCI=EA(8.2x 10-)
RCI=EA(12.8)
(e) ()0.94
9E1.00A(03
0.730
0.73
1.00
0.9
0.73
0.9
RCI=EA(.03)
(g)Figure 5-10: (a) Symmetric Bridge; (b) Anti-Symmetric Bridge; (c) Cantilever One Load; (d) Cantilever Two Loads; (e) Braced Frame; (f) Wheel; (g) Space Truss
6. GEOMETRY OPTIMIZATION
In chapter 5, it is shown that the geometry of a structural system with a fixed topology can greatly affect the quality of the system's robustness. Moreover, robustness indices are developed to quantify the relationship between a structure's geometry and robustness. In this chapter, using these indices, optimization objective functions are created in order to determine robust structural forms.
Two distinct optimization goals are derived from the proposed indices of chapter 5. The first objective function is to minimize the variance between the member RQIs. In this way, regardless of the damaging event and which member or multiple members are damaged, the resulting residual capacity of the structure is the closest to the residual capacity of all the other subnetworks.
The second optimization goal is to maximize the RCI for the structure. In this way, the members are oriented in a way that provides the total largest residual capacity after a detrimental event. In other words, the members are oriented in a way that they are best suited to resist loads after a detrimental event.
Figure 6-1 shows the geometry configurations for the hanger system which result in a RQI variance of zero. Moreover, Figure 6-1(a) is also the solution which maximizes the RCI for the structure.
S 1 1
Section A
10 Kips 10 Kips
(a)
R 1=5
(b)IR1=116
6.1 Minimizing RQI Variance
The member RQIs presented in chapter 5.1 indicate the member's importance to overall redundancy in a redundant system. Therefore, a robust system may be interpreted as one which would have equivalent scores for every member. In other words, every member is equally important and thus the variance of the scores is minimized. The equation for the calculation of the RQI variance is defined as follows:
Ziements(rQJ,
- U)Variance(RQI) = a2(RQI) = (14)
# Elements
where u is the mean of the member RQIs.
For geometry optimization, the objective function for this problem is to minimize the variance between the member RQIs. However, this objective function does not indicate how improved the solution is relative to the initial starting geometry. It is for this reason that the variance will be normalized by the initial structure's variance as shown in Eq. 15.
Objective = Minimize( VN (15)
where VN is the RQI variance of the new geometry and Vo is the RQI variance of the original geometry.
A RQI variance optimization is performed on the original hanger structure shown in
Figure 5-1. For this optimization, the first, and obvious, solution is to superimpose the three elements on top of each other which is demonstrated in figure 6-1 (a). This solution can be interpreted as a bundled cable system typically used on suspension bridges. Figure 6-1 (b) shows the second solution where the angles formed by the exterior element to the vertical are 37 0
6.2 Maximizing RCI
As previously mentioned, a second optimization goal is to maximize the structure's RCI. This optimization will lead to a geometrical configuration with the highest residual capacity while keeping all the other conditions the same. The optimization problem of maximizing the RCI can be converted into a minimization problem through Eq. 16.
Objective = Minimize RCI,
RCIN (16)
where RCIN is the RCI of the new geometry and RClo is the RCI of the original geometry.
The solution shown in Figure 6-1(a) is found when the objective function of equation
16 is used on the hanger system of Figure 5-1. Therefore, the most robust solution for the
hanger system is to superimpose the three members of the hanger. However, this trivial solution is not always the case. It will later be shown that an optimal solution in which both the RQI variance is minimized and the RCI is maximized is not always possible. Typically, these goals are opposing and a compromise between RQI variance minimization and RCI maximization is required.
6.3 Results for selected topologies
In the following section, the minimal variance RQI and maximum RCI geometries are shown for selected topologies. In addition to the geometries, the objective functions as defined in Equations 15 and 16 are shown as well as the RQI and unnormalized RQI dashboards.
6.3.1 Bridge Truss
The first selected topology is an indeterminate truss subjected to three equivalent point loads as seen in figure 6-2. The three top nodes are the design variables; in other words, these are the only nodes which may be moved in the system. The symmetry of the system is bilaterally constrained around the centerline of the truss. An additional constraint is the new possible locations of the top nodes. In order to constrain these values, a boundary box, shown in figure
6-2 is used. The dimensions of the box are determined by the author, however it should be
noted that no solutions lie on the boundaries of the box and therefore the box does not constrain the possible solutions.
Figure 6-2: Initial geometry and constraints for bridge topology
The minimal RQI variance solution for the bridge truss is shown below in figure 6-4. As seen on the dashboard of figure 6-3, the normalized scores for the optimal geometry have a flatter slope. This observation is confirmed with an objective value, as defined in equation 15 of.83. With this geometric configuration, the loss of any member of the truss will result in, as best as possible without superimposing the members, the same residual capacity.
Figure 6-3: Minimum RCI variance geometry -Bridge
Element RQI Distribution
Original - + Variance Optimization 0.9 -0 / 0.6 -Objective(VnVo): .83 0 .5 1 1 1 1 1 1 1 1 1 1 1 1 1 1 1 2 3 4 5 6 7 8 9 10 11 12 13 14 15 Element
Figure 6-4: Element RQI dashboard for optimal RQI variance geometry -Bridge
The found maximum RCI solution for the bridge truss is shown below in figure 6-6. Looking at the dashboard, figure 6-5, it can be seen that the unnormalized RQIs of the individual members are significantly higher than in the original geometry. Therefore, the resulting subnetworks in the optimized system have a higher residual capacity.
I I I
RCI=EA(.026)
Figure 6-5: Maximum RCI geometry -Bridge
Unnormalized Element RQI Distribution
Original Variance Optimization i - -I D 1 Objective(So/Sn) 53 1 2 4 1 7 8 9 10 11 12 13 14 13 Ele menti
6.3.2 Braced Frame
The second selected topology is an indeterminate braced frame subjected to a single point load at the top. This topology can be seen as the representation of a lateral bracing system in a one story structure and therefore the results obtained must be bilaterally symmetric. Therefore, once again, the system is constrained to be symmetric. The solutions are also constrained to be above the ground level.
Figure 6-7: Initial geometry and constraints for braced frame
For the braced frame, the geometry which reduces the RQI variance is the original geometry. The member RQls are shown in figure 6-8 below.
4
1 .60 94
0.99 0.941
0.94) ;1 .o;
(0.90
0.81
0.90 10.81I1
RCI=EA(8.6x 10)
Figure 6-9: Maximum RCI geometry- Braced Frame
Unnormalized Element RQI Distribution
1.5 -1.4 Original -- -RCI Maximization 1.3 ' 1.2 0 D 0.8 0.7 0.6 -Objective(So/Sn): .97 3 4 5 6 Element
Figure 6-10: Element RQI dashboard for optimal RCI geometry-braced Frame
40
-W
I
7 1 U.5Z 26.4 Design Space Exploration
The solutions of section 6.3 guide the designer to achieve the optimal geometry for the selected topology in regards to minimizing the RQI variance and maximizing the RC. However, a geometry which optimizes both these design objectives is not typically obtainable. Given that both design goals are necessary to achieve a robust structural system, it is important that the relationship between these objectives be well visualized. This can allow for the designer to make a well informed decision when selecting the structure's geometry. Furthermore, it is the designer's decision to attribute the weight for the design parameters and thus it is important to be able to view the solutions as a result of these weights.
1/RCI-RQI Variance
0.04 0.03 -C0.02 0 -0.01 - II. IIl i 11. 111 I 1 1 I I 1111111 I I .111 i I I 1111 i 10-5 10-4 10-3 10-2 10-1 100 101 1/RCIFigure 6-11: Design Space for Bridge Topology
Figure 6-11 shows the design space for the bridge topology of section 6.3.1. The inverse of the RCI scores is plotted so that the most performing structures occur on the left side of the graph. As it can be seen, there are a vast array of possible geometric configurations for the truss each with their own unique values for both objective functions. Moreover, a clear Pareto optimum
front can be observed from the data set. This Pareto front indicates all the optimum robust geometries for a given set of importance weights for the design parameters.
6.5 Strain Energy -RCI Relationship
A relationship is determined between a geometries RCI and the strain energy of the structure.
In figure 6-12, the strain energies of the structures are plotted against the reciprocal of the RCI scores for the bridge topology. This is done so that the geometries with higher RCI are plotted on the lower end of the y-axis.
-0 -~ 800 700 600 500 400 300 200 100 0 Strain Energy-I/RCI 'Its 0.5 1 1.5 Strain Enerqv 2 2.5 3 10-6
Figure 6-12: Strain Energy- RCI Relationship
A general trend is observable in the data. As the strain energy is minimized, the inverse RCI
values are also minimized. Therefore, the geometries with low strain energies had the largest RCL. Inversely, geometries with high strain energies had the lowest strain energy. Although the trend holds true for geometries with low strain energies, there is a large spread in the RCI values for geometries with high strain energies. However, the variation between the RCI values increases as the strain energy increases. This is the observed triangular splitting of the dataset as seen in figure 6-12.
7. CONCLUSIONS AND FUTURE WORK:
This thesis summarizes a comprehensive assessment of the relationship between redundancy and form. The main findings of this thesis are as follows:
* For a redundant structure, a Redundancy Quality index (RQI) which defines the importance of each member for the overall robustness of the structure is defined.
" For a redundant structure, a Residual Capacity index (RCI) is defined. The RCI is a
property of the structure and measures the summed residual capacity of the structure.
" Both indices are a measure of a structure's resilience against the loss of a portion of its structure. However, this is done without specifying the damage condition.
* Together, both indices give designers a powerful tool to evaluate the robustness of their preliminary structural design based soled on geometry and static equilibrium.
* For a given topology, the geometry of a structure greatly impacts both the RQI and RCI of a structure.
" Geometry optimization is implemented to optimize both the RQI and RCI values for a
topology and discover optimal redundant structural forms.
" New robust structural typologies are found for the explored topologies.
" Considering all possible failure modes, minimizing a structure's strain energy will
result in a system with the highest overall residual capacity.
Future works which can expand on the work of this thesis are as follows:
" Member sizing optimization may be implemented to vary the strain energies of the
subnetworks and create minimal RQI variance for a fixed geometry.
* The scoring methods may be expanded upon into frames. Specifically, non discrete scoring in which a possible moment capacity loss along any location of a member is considered.
* Optimizing the subnetwork determination algorithm in order to be able to explore topologies with many members.
* Adding an additional step in the subnetwork validation which verifies if the subnetwork can withstand the applied design loads
8. REFERENCES:
Biondini, F, and S Restelli. 2008. "Damage propagation and structural robustness." Life-Cycle Civil Engineering: Proceedings of the International Symposium on Life-Cycle Civil Engineering,
IALCCE'08, Held in Varenna, Lake Como, Italy on June 11-14 2008.
CEN. 2006. Eurocode
1
-Actions on structures -Part 1-7: General actions Accidental actions. In DesignSituations.
Frangopol, D., and J. Curley. 1987. "Effects of Damage and Redundancy on Structural Reliability."
Journal of Structural Engineering 113 (7):1533-1549. doi: 10.1061/(ASCE)0733-9445(1987)113:7(1533).
Haberland, M. 2007. "Progressiver Kollaps und Robustheit (Progressive collapse and robustness)."
Hamburg University of Technology, Structural Analysis and Steel Structures Institute, Diploma thesis. (in German).
Kirsch, Uri. 1993. Structural optimization : fundamentals and applications: Berlin ; New York Springer-Verlag, c1993. Bibliographies
Non-fiction
Electronic document.
Michell, A. G. M. 1904. "LVIII. The limits of economy of material in frame-structures." Philosophical
Magazine Series 6 8 (47):589-597. doi: 10.1080/14786440409463229.
Munk, David J, Gareth A Vio, and Grant P Steven. 2015. "Topology and shape optimization methods using evolutionary algorithms: a review." Structural and Multidisciplinary Optimization 52
(3):613-631.
Richardson, James N, Rajan Filomeno Coelho, and Sigrid Adriaenssens. 2015. "Robust topology optimization of truss structures with random loading and material properties: A multiobjective perspective." Computers & Structures 154:41-47.
Starossek, Uwe, and Marco Haberland. 2011. "Approaches to measures of structural robustness."
Structure and Infrastructure Engineering 7 (7-8):625-63 1.
MATLAB, Natick, Massachusetts, United States.
Tibert, Gunnar, and Lina M. Achi. 2012. "Static redundancy factors in conceptual design." Proceedings of the 25th Nordic Seminar on Computational Mechanics.
Verbeeck, Kenny, Laura Muller, and Lars De Laet. 2015. "Structural Design by a Dashboard approach." International Association for Shell and Spatial Structures (IASS), Amsterdam.