HAL Id: inserm-00137148
https://www.hal.inserm.fr/inserm-00137148
Submitted on 4 Sep 2009HAL is a multi-disciplinary open access archive for the deposit and dissemination of sci-entific research documents, whether they are pub-lished or not. The documents may come from teaching and research institutions in France or abroad, or from public or private research centers.
L’archive ouverte pluridisciplinaire HAL, est destinée au dépôt et à la diffusion de documents scientifiques de niveau recherche, publiés ou non, émanant des établissements d’enseignement et de recherche français ou étrangers, des laboratoires publics ou privés.
infected patients with viral breakthrough during
interferon-ribavirin therapy.
Isabelle Vuillermoz, Essam Khattab, Erwin Sablon, Ingrid Ottevaere, David
Durantel, Claude Vieux, Christian Trepo, Fabien Zoulim
To cite this version:
Isabelle Vuillermoz, Essam Khattab, Erwin Sablon, Ingrid Ottevaere, David Durantel, et al.. Ge-netic variability of hepatitis C virus in chronically infected patients with viral breakthrough during interferon-ribavirin therapy.. Journal of Medical Virology, Wiley-Blackwell, 2004, 74 (1), pp.41-53. �10.1002/jmv.20144�. �inserm-00137148�
Revised manuscript JMVir/2003/5692
Genetic variability of hepatitis C virus in chronically infected patients with
viral breakthrough during interferon-ribavirin therapy
I. Vuillermoz1*, E. Khattab1*, E. Sablon2, I. Ottevaere2, D. Durantel1, C. Vieux3, C. Trepo1,3,
F. Zoulim1,3
*I. Vuillermoz and E. Khattab contributed equally to this work.
1
INSERM UNIT 271, 151 cours Albert Thomas 69424 LYON cedex 03, France
2
INNOGENETICS, Industriepark Zwinjaarde 7, B 9052 GHENT, Belgium
3
Hôtel-Dieu, 1 place de l’Hôpital, 69288 LYON cedex 02, France
Running title: HCV breakthrough during antiviral therapy
Key words: hepatitis C virus - chronic hepatitis - antiviral therapy - drug resistance - genetic
variability
Correspondence author: Pr. Fabien Zoulim, M.D., Ph.D.
Mailing address: INSERM U271, 151 Cours Albert Thomas, 69003 Lyon, France
Phone: (33) 4 72 68 19 74, Fax: (33) 4 72 68 19 71
SUMMARY
Little is known about hepatitis C virus (HCV) breakthrough during antiviral therapy,
although it would help in understanding HCV resistance to current antiviral treatments. To
analyse the implication of virological factors and the vigour of humoral immune responses in
this phenomenon, we studied 9 chronic hepatitis C patients with a viral breakthrough during
IFN/ribavirin combination therapy, as well as 5 responders and 5 non responders. The IRES
and regions coding for the capsid protein, the PePHD domain of envelope glycoprotein E2
and the NS5A and 5B proteins were amplified by RT-PCR before treatment, before and
during breakthrough, and after treatment. The major variant sequence was obtained by direct
sequencing. The heterogeneity of quasispecies was studied by SSCP in all patients and
sequencing after cloning in seven genotype 1b-infected patients. Humoral responses against
HCV epitopes were also analysed. The major sequences of IRES, PePHD and NS5B
remained stable during treatment, regardless of the treatment response. However, the capsid
protein and the regions flanking PePHD showed sequence variations in breakthrough patients,
although no specific mutation was identified. The variable V3 region of NS5A, but not the
PKR-binding domain and the ISDR, seemed to be associated with differences in response to
treatment. The analysis of HCV quasispecies revealed no characteristic pattern during
treatment in breakthrough patients, whose HCV genome profiles looked most similar to that
of non responders. The humoral response was similar between groups. In conclusion, viral
breakthrough does not seem to be due to selection of resistant strains with signature
INTRODUCTION
Hepatitis C virus (HCV) is a major cause of severe liver disease worldwide. More than
80% of infected individuals develop chronic hepatitis that may progress to cirrhosis and
hepatocellular carcinoma. Antiviral treatment associating interferon (IFN) , or more recently pegylated IFN, and ribavirin lead to a sustained virological response in more than 50% of patients (Poynard et al., 1998; Manns et al., 2001; Fried et al., 2002).
Non response is currently defined by the detection of HCV RNA in serum at the end of
treatment. Schematically, two types of profiles can be observed: the absence of response
during treatment or an initial decrease of HCV RNA levels followed by an increase or
reappearance of viraemia, also called viral breakthrough. About 10% of patients treated with
IFN alone and 5% treated with IFN in combination with ribavirin experience a viral
breakthrough during treatment (Lebovics et al., 1995). In the absence of an efficient culture
system able to fully replicate HCV, HCV breakthrough represents a unique model for in vivo
study of resistance factors. Three main hypothesis have been proposed to explain viral
breakthrough during IFN treatment: i) the development of anti-IFN antibodies, ii) the
down-regulation of IFN receptors, iii) the emergence of resistant viral strains. The first hypothesis
can be partially ruled out as anti-IFN antibodies are not consistently found in association with
viral breakthrough (Heathcote et al., 1999; Hoffmann et al., 1999; Roffi et al., 1995). Second, the down-regulation of IFN receptors during therapy, as observed for hepatitis B, has not been
clearly correlated to treatment response (Nakajima et al., 1990). The third hypothesis, which
is the emergence of resistant strains during treatment, has been recently suggested. Indeed, a
recent study showed that the evolution of hypervariable region 1 (HVR1) quasispecies during
IFN monotherapy was different between sustained responders and patients who experienced a
performed on other regions within HCV genomes isolated from patients with a viral
breakthrough, particularly in regions potentially implicated in IFN resistance. Furthermore,
little is known with respect to viral breakthrough during IFN-ribavirin combination therapy.
The causes and mechanisms of HCV resistance to IFN treatment are not yet understood,
but several viral genomic regions or viral proteins may affect the antiviral process induced by
IFN (Pawlotsky et al, 2003). Changes in the nucleotide sequence and structure of the Internal
Ribosome Entry Site (IRES), which regulates the cap-independent translation of the HCV
genome, may interfere with the efficiency of protein translation (Soler et al., 2002).
Moreover, a recent study showed that IFN inhibits HCV IRES-directed translation by reducing the expression of La protein, which is necessary for IRES function (Shimazaki et al.,
2002). The highly basic Core protein, which encapsidates the viral genome to form a
nucleocapsid, acts in multiple cellular processes (McLauchlan, 2000). In particular, it may
enhance the expression of the IFN-induced 2’-5’ Oligoadenylate Synthetase (OAS) system,
leading to degradation of viral RNA (Naganuma et al., 2000). However, other in vitro studies
showed that it may have anti-IFN activities, as do other HCV structural proteins (Keskinen et
al., 2002), by blocking the Jak-Stat transduction pathway (Heim et al., 1999; Hosui et al.,
2003). The envelope glycoprotein E2 may interact with the IFN-induced cellular protein
kinase PKR and block its inhibitory activity on cellular and viral protein synthesis in vitro.
This property may rely on a small region of E2 protein that shows high sequence homology with the phosphorylation sites of PKR and eIF2α and is consequently named PKR and eIF2α
Phosphorylation Homology Domain (PePHD) (Taylor et al., 1999). NS5A, a non structural
protein, may also interact with PKR and inhibit its activity (Gale et al., 1997; Polyak et al.,
1999). The Interferon Sensitivity Determining Region (ISDR), a part of the PKR binding
domain of NS5A, or other domains, such as the V3 region, may be responsible for the
Western countries are controversial regarding the correlation between the number of
mutations in ISDR and the treatment response (Enomoto et al., 1996; Kurosaki et al., 1997;
Chayama et al., 1997; Watanabe et al., 2001; Nousbaum et al., 2000; Pawlotsky et al., 1998;
Murphy et al., 2002; Zeuzem et al., 1997; Polyak et al., 1998). Furthermore, the role of NS5A
in IFN resistance is still debated, as detailed analysis using HCV replicons showed that HCV
susceptibility to IFN was independent of the NS5A sequence (Guo et al., 2001). The
RNA-dependent RNA polymerase activity, which is essential for HCV replication, is carried by the
NS5B protein (Lohmann et al., 2000). As baseline viral load is a predictor of response to IFN
therapy, mutations in NS5B that may affect the viral replication capacity may also influence
response to treatment.
The object of this study was to identify factors involved in viral breakthrough during
IFN-ribavirin bitherapy. In order to test the hypothesis that resistant strains harbouring relevant
mutations may emerge, we performed a detailed analysis of the IRES, capsid, E2, NS5A and
NS5B sequences as well as of the quasispecies evolution in patients presenting a viral
breakthrough during combination therapy. In parallel we studied the anti-HCV humoral
PATIENTS AND METHODS
Patients. Nineteen patients chronically infected by hepatitis C virus, negative for HBV
and HIV markers, and treated with a combination of interferon -2b and ribavirin were retrospectively included in the study. Five patients were sustained responders to treatment, 5
patients were non responders and 9 experienced a viral breakthrough during treatment.
Sustained response was defined as a decrease, during treatment, of HCV RNA to titres below
the detection limit with a normalisation of ALT levels, which were maintained after the end of
treatment. In this study, non response was defined as no decrease in HCV RNA titres or a
decrease of less than one log10 during and after treatment without a drop of ALT levels down
to the normal range. Breakthrough was defined arbitrarily as an initial biochemical and
virological response, characterised by a normalisation of ALT levels and a significant
decrease of HCV RNA titre of more than one log10 up to no detectable HCV RNA, and a
subsequent significant increase of more than one log10 or reappearance of HCV RNA in the
serum during therapy, followed by return of ALT levels to abnormal values.
For all groups of patient, at least one serum sample before, at month 6, at the end and
after treatment (2 to 12 months after the end of treatment) were studied. For patients with
viral breakthrough, it corresponded to one sample before breakthrough and one after. For
responders, a sample in the first month of treatment, before disappearance of HCV RNA was
also included.
Quantitative measurement of HCV RNA. Quantification of serum HCV RNA was
performed by RT-PCR with an internal RNA standard derived from the 5’ non coding region
(5’ NCR) of HCV (COBAS Amplicor HCV Monitor 2.0; Roche Diagnostic Systems). The
HCV Genotyping. HCV genotypes were determined with the INNO-LIPA assay
(Innogenetics), based on analysis of genotype-specific 5’NCR polymorphisms by
hybridisation of PCR products with probes on nitrocellulose strips.
RNA extraction and amplification of HCV genomic regions by RT-PCR. HCV RNA
was extracted from 140 l of serum according to the manufacturer’s instructions (QIAmp viral RNA kit, QIAGEN). For the amplification of the IRES and regions coding for the Core,
a C-terminal part of E2, NS5A and NS5B proteins, the extracted RNA was initially amplified
by RT-PCR (Onestep RT-PCR, QIAGEN) followed by a nested or semi-nested PCR using
Taq polymerase (PROMEGA). Conditions of amplification were optimised for each region
and all steps were performed in a thermocycler (i-cycler, BIORAD). E2 sequences were
RT-amplified with outer primers located at nucleotides 2070-2086 (or 2079-2098 for genotype
1a) and 2580-2562 while nested PCR was performed with inner primers located at nucleotides
2157-2178 and 2440-2418. A primer pair at nucleotide positions 22-49 and 938-910 was used
for RT-PCR of IRES plus Core sequences while semi-nested PCR for the IRES was
performed with a primer pair at nucleotide positions 22-49 and 419-389 and semi-nested PCR
for Core with a primer pair at positions 342-376 and 938-910. The entire NS5 region was
obtained through amplification of 3 fragments: the first was RT-amplified with outer primers
located at nucleotides 6179-6198 and 7222-7200, the second with outer primers at positions
6859-6877 and 8826-8803 and the third with outer primers at positions 8482-8501 and
9390-9373. Nested PCR was then performed with inner primers at nucleotide positions 6187-6205
and 7171-7155 for the first fragment, at positions 6927-6942 and 8635-8612 for the second
one and at positions 8613-8633 and 9343-9323 for the last one. Nucleotide positions
correspond to the HCV-J sequence (Genbank accession number: D90208). To check that no
plasmid containing a known E2 sequence was submitted to the 2 rounds of PCR. Sequencing
of these PCR products revealed that they were identical to the original E2 sequence.
Analysis of genetic variability by direct sequencing and by sequencing of clones.
PCR products were directly sequenced using the appropriate inner primers (373 A automated
DNA sequencer, Applied Biosystems). Final amplification products for each region were
extracted from agarose gels, purified on silica columns (Qiaquick Gel Extraction kit,
QIAGEN) and quantified by ethidium bromide staining with DNA markers as quantity
standards. Purified PCR products for 2 responders, 2 non responders and 3 breakthroughs
were cloned into pGEM-T vector (PROMEGA). Transformation of recombinant plasmid
DNA into Escherichia coli competent cells was performed as specified by the manufacturer
and transformants were grown on LB/Amplicillin/IPTG/X-gal plates. For each sample, 10 to
22 clones were amplified with the region-specific primers used for the second round PCRs
described above. The PCR products obtained were purified, quantified and analysed by Single
Strand Conformation Polymorphism (SSCP) as described thereafter. Clones were grouped
according to their SSCP pattern. Plasmids from one or two clones of each pattern were
purified (Plasmid Mini Kit, QIAGEN) and sequenced using the dye termination method (ABI
PRISM 377 automated DNA sequencer, Applied Biosystems). Sequence analysis, including
alignment, translation and phylogeny was performed using the CLUSTALW program. The
genetic complexity of viral quasispecies at both the nucleotide and amino acid levels was
determined by measuring the Shannon entropy (Wolinsky et al., 1996), defined as S = -i(pi
ln pi), where pi is the frequency of each sequence in the quasispecies. The normalised entropy,
Sn, was calculated as Sn = S/ln N, where N is the total number of sequences analysed. The
MEGA 2.1 program was used to calculate distances between pairs of sequences, based on the
number of synonymous and non synonymous substitutions per synonymous and non
synonymous sites, respectively, based on the Jukes-Cantor correction for multiple
substitution.
SSCP analysis. The pattern of quasispecies for each isolate was analysed by Single
Strand Conformation Polymorphism (SSCP) of PCR products (Querenghi et al., 2001). The
clones obtained for each sample were also submitted to SSCP analysis. Twenty to thirty
nanograms of the purified PCR products were mixed with 4 µl of denaturing solution
containing 98% formamide, heated for 10 to 15 minutes at 95°C and chilled immediately on
ice. Six microlitres of denatured PCR products were loaded on a 12,5% non denaturing
polyacrylamide mini-gel (GenegelExcel, Pharmacia Biotech) and electrophoresis was
performed using the Genephor system (Pharmacia Biotech, Orsay, France) at 5° and 20°C
under optimised conditions for each region. The DNA bands were subsequently visualised by
silver staining (PlusOne DNA silver staining kit, Pharmacia Biotech).
Analysis of humoral immune responses. Selected sera were submitted to INNO-LIA
HCV Ab IV (Innogenetics). This Line Immunoassay using synthetic peptides and
recombinant proteins coated as discrete lines on a nylon strip detects antibodies directed
against seven HCV proteins: capsid, E1, E2, NS3, NS4A, NS4B, NS5A. Detection of
HCV-specific antibodies captured on lines was performed using alkaline phosphatase-labelled goat
anti-human IgG conjugate and the appropriate enzyme substrate. Because the intensity of
staining is proportional to the amount of HCV specific antibodies captured, semiquantitative
determination of HCV antibody levels against each epitope tested was obtained by scanning
Statistical analysis. Data were compared between the 3 groups using the non parametric
Kruskal-Wallis test and between the 2 profiles of breakthrough patients using the non
parametric Mann-Whitney test. Sex ratios were compared with a Chi-2 test. Results were
RESULTS
Selection of patients. To test the hypothesis of emergence of resistant strains as a factor
of HCV resistance to IFN-ribavirin combination therapy, we analysed nine patients who
experienced a viral breakthrough during treatment. They showed an initial virological
response characterised by a mean decrease of viral load of 2.5 log10, leading to undetectable
HCV RNA levels by quantitative PCR in 3 of them (patients #5, 6, 7), followed, in the first 12
months of treatment, by an increased titre or reappearance of HCV RNA (Figure 1). At the
time of reduction in viral RNA titres, all but one of the breakthrough patients showed a
biochemical response characterised by a normalisation of ALT levels (Figure 1). Patient #5
still had abnormal ALT values during treatment but showed a 2.5-fold decrease at the time of
HCV RNA disappearance. There was no difference in the breakthrough patients in whom
HCV RNA dropped to undetectable levels versus those in whom HCV RNA decreased but
did not become undetectable (Table I). These nine breakthrough patients were compared to
responders and non responders, who showed characteristic profiles, i.e. an early and sustained
virological and biochemical response and no decrease of viral load or a slight decrease of less
than 0.4 log10 during and after treatment without any biochemical response, respectively
(Figure 1). Only one non responder showed normal ALT levels during treatment but his ALT
levels never exceeded the upper normal limit value before, during and after treatment. Table I
summarises the clinical, histological and virological features of HCV infection in the 3 groups
of patients.
Study of the major variant within viral quasispecies. We first analysed the genetic
variability of the IRES (nucleotides 22-419), the capsid protein, the PePHD domain of E2 and
by direct sequencing of PCR products before, during and after therapy. Because of a rapid
decrease of viral load in responders, sequence data were available under therapy in only one
patient, sampled at the first month of treatment.
Both sequence alignments and phylogenetic trees showed that the major sequences of the
IRES, the capsid protein and the PePHD domain were genotype specific. The first 320
nucleotides of the pretherapeutic IRES sequences were highly conserved between responders,
non responders and breakthrough patients infected by the same genotype and remained highly
conserved during and after treatment in all patients, except for one breakthrough patient (data
not shown).
Despite the fact that almost all patients showed substitutions in their pretreatment core
sequences when compared to the HCV consensus sequence of their respective genotypes, no
pretherapeutic sequence was associated with treatment response (data not shown). During or
after treatment, changes in the major capsid sequence were observed in 4 breakthrough
patients, 2 of whom showed disappearance of HCV RNA, and 1 non responder (patients #2,
4, 5, 6 and 15, Figure 2), but no specific substitution was seen (data not shown). Breakthrough
strains of patients #2 and 5 showed sequence evolution in 2 of the highly conserved basic
domains of HCV capsid protein (amino acids 38-43 and 58-71). In particular, in breakthrough
patient #2, four amino acid changes, including a Thr to Arg substitution at position 43,
appeared before breakthrough and were maintained thereafter. However, such modifications
of a major variant during treatment may be explained by the presence of 2 distinct HCV
strains whose proportion were modified by antiviral therapy (Figure 2). This may be also the
case for non responder #15 whose capsid sequence showed sufficient alterations to cluster
with another genotype after treatment (Figure 2).
The PePHD region was highly conserved between patients infected by the same genotype,
the patients. Interestingly, during treatment, modification of PePHD flanking regions (amino
acids 622 to 696 according to HCV-J) was seen only in breakthrough patients: 2 with
disappearance of HCV RNA during treatment (patients #6 and 7) and 2 with a reduction of
HCV RNA titres (patients #1 and 9) (Figure 3). However, as for the capsid sequences, no
specific mutation could be observed. Before breakthrough, the HCV sequence of patient #6
contained several substitutions and did not cluster in phylogenetic trees with sequences
observed before treatment and after breakthrough. This also could reflect the presence of 2
co-infecting HCV strains, whose proportion varied during treatment, rather than drastic
modification of a single strain.
For the NS5A and NS5B regions, pre- and post-treatment data were available for only the
13 genotype 1b-infected patients and, during treatment, for only 6 of them (1 responder, 3 non
responders and 2 breakthrough patients including one with HCV RNA disappearance). Before
treatment, the whole NS5A sequence (amino acids 1973-2419), including the PKR-binding
domain (amino acids 2209-2274) and the ISDR (amino acids 2209-2248), showed no
significant difference between the different treatment response patterns with respect to the
number of mutated amino acids compared to the HCV-J prototype sequence (data not shown
and Table II). The mean number of mutations in the PKR-binding domain and the ISDR was
similar between breakthroughs and responders, but was greater for both of these groups than
in non responders. It is worth noting that the overall increase of the mean values for the
breakthrough group was mainly due to patient #4 whose HCV strain contained more
mutations than other breakthrough strains. However, the sequence of this HCV strain was
identical after breakthrough, suggesting that the accumulation of mutations in the
PKR-binding domain was not associated with sensitivity to IFN. Interestingly, the HCV strains of
the responder group contained more mutations than the strains found in the other groups with
This is mainly due to the N-terminal portion of the V3 domain (amino acids 2356-2366)
where HCV strains from responders had from 4 to 6 mutations compared to HCV-J while
breakthrough strains showed only 1 to 3 mutations and non responder strains none (Figure 4).
No significant difference was seen in the number of mutations in V3 compared to HCV-J
between breakthrough patients whose HCV RNA become undetectable and the other
breakthrough patients. After treatment, the V3 sequence showed mutations compared to
pretherapeutic samples in 2 breakthrough patients but no specific mutation could be identified
(patients #4 and 6, Figure 4).
The analysis of NS5B sequences (amino acids 2421-3011) in these genotype 1b-infected
patients did not show differences in the mutation rate between the groups and no specific
mutation was associated with a treatment response pattern (data not shown).
Analysis of the viral quasispecies. In order to analyse the relationship between the
modification of viral quasispecies and response to treatment, the pattern of HCV quasispecies
was studied by SSCP in samples obtained before, during and after treatment in all patients
(data not shown). For the IRES sequences, SSCP patterns indicated a stability of quasispecies
during treatment, with the exception of 2 breakthrough patients including patient #2. The
capsid, ISDR and PKR-binding domains showed less stability and changes of SSCP patterns
during treatment were more frequent in breakthrough patients than in non responders. In V3
and E2, the majority of non responders and breakthrough patients showed replacement of
bands under treatment. Interestingly, the analysis of the SSCP patterns of 2 successive
samples for patient #4 taken 3 months apart before breakthrough, revealed that modification
of the E2 quasispecies occurred in the second sample, just before the viral breakthrough.
To analyse the viral quasispecies of the capsid, E2 and V3 regions from 3 breakthroughs,
frequency was analysed by SSCP and 1 to 2 clones representative of each pattern were
sequenced. In all patients, the dominant sequence was the PePHD sequence associated with in
vitro resistance (659RSELSPLLLSTT670), with the exception of Ser660Thr and Ser660Ala
substitutions in a breakthrough (patient #4) and a responder (patient #12), respectively.
During treatment, all other minor sequences were cleared in non responders and breakthrough
patients, although 2 minor variants appeared after breakthrough in patient #4 (data not
shown). The analysis of V3 and the flanking regions of PePHD (E2 region) did not reveal any
selection of variants except for patient #6. For the E2 region, before breakthrough, patient #6
showed sequences not present before treatment or after breakthrough, while the major
sequence observed after breakthrough was present as a minor species in the pretherapeutic
viral population (data not shown). This was consistent with the hypothesis of 2 co-infecting
HCV strains, as mentioned above for the analysis of the major variant (Figure 3). For the V3
region, more than 80% of the quasispecies of patient #6 evolved towards the prototype HCV-J
sequence. No mutation was selected in viral capsid quasispecies during treatment except that
mentioned in direct sequencing for breakthrough patient #2 and non responder #15.
The quasispecies variability of capsid, V3 and region 622-696 of E2 was then analysed in
more detail (Tables III, IV and data not shown). The mean complexity and the mean within-
and between-sample genetic distances of the 3 regions were similar for all groups, except that
there was slightly greater E2 distances in non responders and breakthrough patients and
slightly greater capsid amino acid complexity before treatment in responders. For E2, the
differences were restricted to the nucleotide sequences as assessed by the proportion of
synonymous substitutions per synonymous site (dS) and non synonymous substitutions per
non synonymous site (dN). While dN was comparable between groups, dS was greater for
non responders and breakthrough patients. Capsid and V3 regions showed no difference in dN
E2 more synonymous mutations and less non synonymous mutations than in capsid and V3.
Altogether, these results suggest that, in the E2 region, non responder and breakthrough
strains present more variability than responder strains. However this variability remained
limited to the nucleotide level, suggesting structural and/or functional constraints at the
peptide level. Compared to E2, capsid and V3 showed lower variability. In patient #6, E2
quasispecies showed dS, dN and between-sample distances 3 to 4 times greater than in other
breakthroughs, suggesting an important divergence of the viral population before
breakthrough (Table III). These results are in agreement with the likely existence of a second
co-infecting HCV strain whose sequences were only detected when replication of the first
strain was decreased by the treatment and before less sensitive minor variants were selected.
With the exception of this patient, breakthrough strains were no more variable than strains of
primary non responders (Table III). Moreover, analysis of the evolution of complexity and
distances during treatment confirmed that no specific profile was observed for breakthrough
strains, some of them even showing patterns close to non responder strains (data not shown).
Humoral immune response against HCV proteins. Response to treatment may be
influenced by the host immune response. We therefore analysed the humoral immune
response in all samples using the INNO-LIA HCV Ab IV assay. For all groups of patients, the
strongest response was directed against the NS3 protein and the lowest against the envelope
glycoprotein E1. Reactivities were similar between groups except for the anti-E2 response:
antibody levels were lower for breakthroughs, but this difference was not statistically
significant (data not shown). For all 3 groups of patients, anti-HCV antibody levels were
DISCUSSION
The causes and mechanisms of viral breakthrough during treatment of chronic hepatitis C
are still poorly understood. Only few longitudinal studies during treatment have been
conducted, although it is a unique in vivo model for the study of drug resistance. Furthermore,
resistance factors were mainly analysed during IFN monotherapy, but current therapy
combines IFN and ribavirin. For these reasons, we analysed the HCV genome sequences and
host humoral immune responses in 9 patients who experienced a viral breakthrough during
IFN-ribavirin combination therapy.
All patients classified as breakthrough patients in this study showed a complete
biochemical response during treatment, except patient #5 who showed a significant ALT
value decrease without normalisation. Three of these patients (#5, 6, 7) could be defined as “true” breakthrough patients with a drop of HCV RNA levels to under the detection limit of
the PCR assay. The others showed HCV RNA titre reduction from 1.3 log10 to levels close to
the detection threshold. However, no significant difference with respect to pretherapeutic
clinical and virological features, genetic variability before, during and after treatment, and
anti-HCV humoral immune responses could be seen between these two profiles of
breakthrough patients.
Several viral genome regions were chosen for their role in viral replication and their
potential implication in response to treatment, i. e. the IRES and regions coding for the capsid
protein, the PePHD domain of E2, and the NS5A and NS5B proteins. The analysis of major
variants of viral quasispecies demonstrated the absence of selection of mutants in the IRES
and NS5B regions before or after viral breakthrough. In particular, the IRES sequence was
conserved and did not influence the treatment efficacy, as already shown for non responders
Since the identification of the ISDR in the PKR-binding domain (Enomoto et al., 1995),
the role of mutations within this region in the sensitivity to treatment has not been confirmed
during IFN monotherapy and IFN-ribavirin bitherapy (Enomoto et al., 1996; Pawlotsky et al.,
1998; Nousbaum et al., 2000; Murphy et al., 2002). Previous studies including 1 or 2 cases of
viral breakthrough during IFN monotherapy also showed conflicting results (Zeuzem et al.,
1997; Polyak et al., 1998). A recent report from Franco and colleagues (Franco et al., 2003)
confirmed that the NS5A viral populations vary widely between patients, but no differences
were observed in the complexity, diversity, types of nucleotide changes, or evolutionary
pattern of the quasispecies according to the stage of liver disease. This suggests that many of the “mutations” observed in our study may correspond to spontaneous variations. Our results
indicate that the PKR-binding domain and particularly the ISDR do not seem to play a role in
viral breakthrough (Table II). In contrast, our results suggest that the variable region V3 might
influence response to IFN, as already published by other groups (Figure 4)(Nousbaum et al.,
2000; Murphy et al., 2002).
By comparison with the consensus sequence, pretherapeutic amino acid changes at
position 660 in PePHD, observed here in 1 breakthrough and 1 responder, were also observed
in non responders in the study of Chayama and colleagues (Chayama et al., 2000) and
therefore did not seem to play a role in treatment response. Interestingly, during treatment, the
evolution of the major variant for capsid protein and E2, except PePHD which was highly
conserved, was more frequent in breakthrough patients than in others (Figures 2 and 3). It has
been suggested that the capacity of the PePHD domain to inhibit IFN-induced PKR, at least in
vitro, may explain the higher general resistance of genotype 1 strains to IFN therapies (Taylor
et al., 1999). However, the role of this domain in resistance to IFN with or without ribavirin is
still controversial (Berg et al., 2000; Cochrane et al., 2000; Polyak et al., 2000; Sarrazin et al.,
not play a role in the development of viral breakthrough, but mutations in the vicinity of
PePHD may affect the function of this domain by changing the secondary and tertiary
structures of this region of E2. However, no specific mutation associated with resistance
could be identified in the regions flanking PePHD. The capsid protein has a conserved
nucleotide and amino acid sequence (Ina et al., 1994; Smith and Simmonds, 1997), especially
through 4 basic clusters which may be important for its' interactions with HCV RNA, or may
contain potential nuclear localisation sites (Shimoike et al., 1999; Santolini et al., 1994; Bukh
et al., 1994). Our data revealed that these clusters remained stable during treatment in the
three groups, with the exception of some HCV strains from breakthrough patients which
showed 1 to 2 mutations. However, as for E2, no specific mutation was identified.
In selected patients, a detailed analysis of viral quasispecies was performed (Tables III
and IV). Quasispecies heterogeneity in capsid protein and V3 was comparable, regardless of
the treatment response. The amino acid sequence 622-696 of E2 showed a greater
heterogeneity in breakthroughs and non responders as compared to responders. However, this
increased variability was only tolerated at the nucleotide level, suggesting structural and/or
functional constraints on amino acid changes, which may account for an essential role of this
E2 region in the viral life cycle. For patient #6, important changes of the major variant during
treatment, confirmed by an increased quasispecies heterogeneity, reflected most likely a
co-infection with two HCV strains, as already observed in other studies (Soler et al., 2002). No
characteristic variation of quasispecies heterogeneity was seen in breakthrough patients
during treatment, some of them having a profile similar to non responders. Similarly, no
particular variant was selected in the quasispecies of capsid protein, V3 and the amino acids
622-696 of E2, except for patient #2 in the capsid protein and patient #6 in V3 and E2.
However, the PePHD sequence associated with in vitro resistance was selected in genotype
another study (Chayama et al., 2000). Therefore, the PePHD sequence may be one of the
determinants involved in resistance, but is insufficient to induce resistance on its own.
Response to treatment may also be influenced by hosts factors, and in particular by the
vigour of humoral response (Fujita et al., 2003). The analysis of anti-HCV humoral responses
in breakthroughs did not reveal any defect of the host immune response, apart from a slightly
weaker response against HCV E2 protein. However, no particular evolution of antibody levels
could be observed during treatment. Sustained viral clearance induced by antiviral therapy has
been shown to be associated with a subsequent decrease of antibodies against Core, NS3 and
E1 (Yoshioka et al., 1991; Yuki et al., 1993; Urushihara et al., 1994; Depraetere et al., 2000).
No significant decrease of these antibodies in responders as well as no difference in the
evolution of the general antibody levels in the 3 groups of patients were observed in this
study. However, our study did not involve a detailed analysis of multiple epitopes within each
of the HCV proteins. Decrease of antibody levels in sustained responders, as measured by the
INNO-LIA assay, is also seen when patients are monitored for longer periods after treatment,
although antibodies to certain HCV proteins may persist for extended periods of time
(Depraetere et al., 2000).
In conclusion, the analysis of HCV genetic variability in patients with a viral
breakthrough during IFN-ribavirin bitherapy showed a complex pattern of evolution of HCV
quasispecies. There was no common HCV genomic profile in breakthrough patients.
Concerning the capsid and E2 proteins and the V3 region, the selection of strains with a
higher fitness may play a role in the acquisition of resistance in some patients, but no
selection of specific mutations was observed. Studies involving larger cohorts of patients are
needed in order to elucidate the mechanism of this type of resistance to IFN-ribavirin
Acknowledgements
I. Vuillermoz was the recipient of a fellowship from the Ligue Contre le Cancer and
from the ARC. E. Khattab was the recipient of a fellowship from the Egyptian government.
The authors thank Dr Eberle for providing the Amplicor HCV Monitor 2.0 kit and Dr A. Kay
References
Berg T, Mas Marques A, Hohne M, Wiedenmann B, Hopf U, Schreier E. 2000. Mutations in
the E2-PePHD and NS5A region of hepatitis C virus type 1 and the dynamics of
hepatitis C viremia decline during interferon alfa treatment. Hepatology
32:1386-1395.
Bukh J, Purcell R, Miller R. 1994. Sequence analysis of the core gene of 14 HCV genotypes.
PNAS 91(17):8239-8243.
Chayama K, Suzuki F, Tsubota A, Kobayashi M, Arase Y, Saitoh S, Suzuki Y, Murashima N,
Ikeda K, Takahashi N, Kinoshita M, Kumada H. 2000. Association of amino acid
sequence in the PKR-eIF2 phosphorylation homology domain and response to
interferon therapy. Hepatology 32:1138-1144.
Chayama K, Tsubota A, Kobayashi M, Okamoto K, Hashimoto M, Miyano Y, Koike H,
Kobayashi M, Koida I, Arase Y, Saitoh S, Suzuki Y, Murashima N, Ikeda K, Kumada
H. 1997. Pretreatment virus load and multiple amino acid substitutions in the
Interferon Sensitivity-Determining Region predict the outcome of interferon treatment
in patients with chronic genotype 1b hepatitis C virus infection. Hepatology
25:745-749.
Cochrane A, Orr A, Shaw M, Mills P, McCruden E. 2000. The amino acid sequence of the
PKR-eIF2alpha Phosphorylation Homology Domain of hepatitis C virus envelope 2
protein and response to interferon-alpha. J Infect Dis 182:1515-1518.
Depraetere S, Van Kerschaever E, Van Vlierberghe H, Elewaut A, Brouwer J, Niesters H,
Schalm S, Maertens G, Leroux-Roels G. 2000. Long term response to interferon
treatment in chronic hepatitis C patients is associated with a significant reduction in
Enomoto N, Sakuma I, Asahina Y, Kurosaki M, Murakami T, Yamamoto C, Izumi N,
Marumo F, Sato C. 1995. Comparison of full-length sequences of interferon-sensitive
and resistant hepatitis C virus 1b. J Clin Invest 96:224-230.
Enomoto N, Sakuma I, Asahina Y, Kurosaki M, Murakami T, Yamamoto C, Ogura Y, Izumi
N, Marumo F, Sato C. 1996. Mutations in the nonstructural protein 5A gene and
response to interferon in patients with chronic hepatitis C virus 1b infection. N Engl J
Med 334:77-81.
Farci P, Strazzera R, Alter HJ, Farci S, Degioannis D, Coiana A, Peddis G, Usai F, Serra G,
Chessa L, Diaz G, Balestrieri A, Purcell RH. 2002. Early changes in hepatitis C viral
quasispecies during interferon therapy predict the therapeutic outcome. Proc Natl
Acad Sci USA 99(5):3081-3086.
Franco S, Gimenez-Barcons M, Puig-Basagoiti F, Furcic I, Sanchez-Tapias J, Rodes J, Saiz J.
2003. Characterization and evolution of NS5A quasispecies of hepatitis C virus
genotype 1b in patients with different stages of liver disease. J Med Virol
71(2):195-204.
Fried M, Shiffman M, Reddy K, Smith C, Marinos G, Goncales F, Haussinger D, Diago M,
Carosi G, Dhumeaux D, Craxi A, Lin A, Hoffman J, Yu J. 2002. Peginterferon alfa-2a
plus ribavirin for chronic hepatitis C virus infection. N Engl J Med 347(13):975-982.
Fujita N, Kaito M, Takeo M, Iwasa M, Ikoma J, Watanabe S, Adachi Y. 2003. Nonimmune
complexed HCV RNA titer in serum as a predictor of interferon response in patients
with chronic hepatitis C. Am J Gastroenterol 2003 98(3):645-652.
Gale M, Korth M, Tang N, Tan S-L, Hopkins D, Dever T, Polyak S, Gretch D, Katze M.
1997. Evidence that hepatitis C virus resistance to interferon is mediated through
repression of the PKR protein kinase by the nonstructural 5A protein. Virology
Guo J, Bichko V, Seeger C. 2001. Effect of alpha interferon on the hepatitis C virus replicon.
J Virol 75(18):8516-8523.
Heathcote J, James S, Mullen K, Hauser S, Rosenblate H, Albert D, Group TCIS. 1999.
Chronic hepatitis C virus patients with breakthroughs during interferon treatment can
successfully be retreated with consensus interferon. Hepatology 30:562-566.
Heim M, Moradpour D, Blum H. 1999. Expression of HCV proteins inhibits signal
transduction through the JAK-STAT pathway. J Virol 73(10):8469-8475.
Hoffmann RM, Berg T, Teuber G, Prummer O, Leifeld L, Jung M-C, Spengler U, Zeuzem S,
Hopf U, Pape GR. 1999. Interferon-antibodies and the breakthrough phenomenon
during ribavirin/interferon-alpha combination therapy and interferon-alpha
monotherapy of patients with chronic hepatitis C. Z Gastroenterol 37:715-723.
Hosui A, Ohkawa K, Ishida H, Sato A, Nakanishi F, Ueda K, Takehara T, Kasahara A, Sasaki
Y, Hori M, Hayashi N. 2003. HCV core protein differently regulates the Jak-STAT
signaling pathway under interleukin-6 and IFN- stimuli. J Biol Chem in press.
Ina Y, Mizokami M, Ohba K, Gojobori T. 1994. Reduction of synonymous substitutions in
the core protein gene of HCV. J Mol Evol 38(1):50-56.
Keskinen P, Melen K, Julkunen I. 2002. Expression of HCV structural proteins impairs
IFN-mediated antiviral response. Virology 299:164-171.
Kurosaki M, Enomoto N, Murakami T, Sakuma I, Asahina Y, Yamamoto C, Ikeda T, Tozuka
S, Izumi N, Marumo F, Sato C. 1997. Analysis of genotypes and amino acid residues
2209 to 2248 of the NS5A region of hepatitis C virus in relation to the response to
interferon- therapy. Hepatology 25:750-753.
Lebovics E, Lantin J, Chaurushia G, Dworkin B, Casellas A, Rosenthal W. 1995. The
breakthrough phenomenon during alpha-interferon therapy of chronic hepatitis C:
Lo S, Lin H. 2001. Variations within hepatitis C virus E2 protein and response to interferon
treatment. Virus Research 75:107-112.
Lohmann V, Roos A, Korner F, Koch J, Bartenschlager R. 2000. Biochemical and structural
analysis of the NS5B RNA-dependent RNA polymerase of the hepatitis C virus. J
Viral Hepatitis 7:167-174.
Manns M, McHutchison J, Gordon S, Rustgi V, Shiffman M, Reindollar R, Goodman Z,
Koury K, Ling M, Albrecht J. 2001. Peginterferon alfa-2b plus ribavirin compared
with interferon alfa-2b plus ribavirin for initial treatment of chronic hepatitis C: a
randomised trial. Lancet 358(9286):958-965.
McLauchlan J. 2000. Properties of the hepatitis C virus core protein: a structural protein that
modulates cellular processes. J Viral Hepat 7:2-14.
Murphy M, Rosen H, Marousek G, Chou S. 2002. Analysis of sequence configurations of the
ISDR, PKR-binding domain, and V3 region as predictors of response to induction
interferon- and ribavirin therapy in chronic hepatitis C infection. Dig Dis Sci 47(6):1195-1205.
Naganuma A, Nozaki A, Tanaka T, Sugiyama K, Takagi H, Mori M, Shimotohno K, Kato N.
2000. Activation of the interferon-inducible 2'-5'-oligoadenylate synthetase gene by
hepatitis C virus core protein. J Virol 74(18):8744-8750.
Nakajima S, Kuroki T, Shintani M, Kurai O, Takeda T, Nishiguchi S, Shiomi S, Seki S,
Kobayashi K. 1990. Changes in interferon receptors on peripheral blood mononuclear
cells from patients with chronic hepatitis B being treated with interferon. Hepatology
12:1261-1265.
Nousbaum J, Polyak S, Ray S, Sullivan D, Larson A, Carithers R, Gretch D. 2000.
Prospective characterization of full-length hepatitis C virus NS5A quasispecies during
Pawlotsky J. 2003. Mechanism of antiviral treatment efficacy and failure in chronic hepatitis
C. Antiviral Res 59:1-11.
Pawlotsky J, Germanidis G, Neumann A, Pellerin M, Frainais P, Dhumeaux D. 1998.
Interferon resistance of hepatitis C virus genotypes 1b: relationship to nonstructural
5A gene quasispecies mutations. J Virol 72(4):2795-2805.
Polyak S, McArdle S, Liu S, Sullivan D, Chung M, Hofgärtner W, Carithers R, McMahon B,
Mullins J, Corey L, Gretch D. 1998. Evolution of hepatitis C virus quasispecies in
hypervariable region 1 and the putative Interferon Sensitivity-Determining Region
during interferon therapy and natural infection. J Virol 72(5):4288-4296.
Polyak S, Nousbaum J, Larson A, Cotler S, Carithers R, Gretch D. 2000. The protein
kinase-interacting domain in the hepatitis C virus envelope glycoprotein-2 gene is highly
conserved in genotype 1-infected patients treated with interferon. J Infect Dis
182:397-404.
Polyak S, Paschal D, McArdle S, Gale M, Moradpour D, Gretch D. 1999. Characterization of
the effects of hepatitis C virus nonstructural 5A protein expression in human cell lines
and on interferon-sensitive virus replication. Hepatology 29:1262-1271.
Poynard T, Marcellin P, Lee SS, Niederau C, Minuk GS, Ideo G, Bain V, Heathcote J,
Zeuzem S, Trepo C, Albrecht J. 1998. Randomised trial of interferon alpha2b plus
ribavirin for 48 weeks or for 24 weeks versus interferon alpha2b plus placebo for 48
weeks for treatment of chronic infection with hepatitis C virus. International Hepatitis
Interventional Therapy Group (IHIT). The Lancet 352:1426-1432.
Querenghi F, Yu Q, Billaud G, Maertens G, Trepo C, Zoulim F. 2001. Evolution of hepatitis
C virus genome in chronically infected patients receiving ribavirin monotherapy. J
Roffi L, Mels GC, Antonelli G, Bellati G, Panizzuti F, Piperno A, Pozzi M, Ravizza D,
Angeli G, Dianzani F, Mancia G. 1995. Breakthrough during recombinant interferon
alfa therapy in patients with chronic hepatitis C virus infection: prevalence, etiology,
and management. Hepatology 21:645-649.
Santolini E, Migliaccio G, La Monica N. 1994. Biosynthesis and biochemical properties of
the hepatitis C virus core protein. J Virol 68(6):3631-3641.
Sarrazin C, Bruckner M, Herrmann E, Ruster B, Bruch K, Roth W, Zeuzem S. 2001.
Quasispecies heterogeneity of the carboxy-terminal part of the E2 gene including the
PePHD and sensitivity of hepatitis C virus 1b isolates to antiviral therapy. Virology
289:150-163.
Sarrazin C, Kornetzky I, Ruster B, Lee J, Kronenberger B, Bruch K, Roth W, Zeuzem S.
2000. Mutations within the E2 and NS5A protein in patients infected with hepatitis C
virus type 3a and correlation with treatment response. hepatology 31:1360-1370.
Shimazaki T, Honda M, Kaneko S, Kobayashi K. 2002. Inhibition of internal ribosome entry
site-directed translation of HCV by recombinant IFN-alpha correlates with a reduced
La protein. Hepatology 35:199-208.
Shimoike T, Mimori S, Tani H, Matsuura Y, Miyamura T. 1999. Interaction of hepatitis C
virus core protein with viral sense RNA and suppression of its translation. J Virol
73(12):9718-9725.
Smith D, Simmonds P. 1997. Molecular epidemiology of HCV. J Gastroenterol Hepatol
12(7):522-527.
Soler M, Pellerin M, Malnou C, Dhumeaux D, Kean K, Pawlotsky J. 2002. Quasispecies
heterogeneity and constraints on the evolution of the 5' noncoding region of hepatitis
C virus (HCV): relationship with HCV resistance to interferon-alpha therapy.
Taylor DR, Shi ST, Romano PR, Barber GN, Lai MM. 1999. Inhibition of the
interferon-inducible protein kinase PKR by HCV E2 protein. Science 285:107-110.
Urushihara A, Sodeyama T, Matsumoto A, Tanaka E. 1994. Changes in antibody titers to
hepatitis C virus following interferon therapy for chronic infection. J Med Virol
42(4):348-356.
Watanabe H, Enomoto N, Nagayama K, Izumi N, Marumo F, Sato C, Watanabe M. 2001.
Number and positions of mutations in the Interferon (IFN) Sensitivity-Determining
Region of the gene for nonstructural protein 5A correlate with IFN efficacy in
hepatitis C virus genotype 1b infection. J Infect Dis 183:1195-1203.
Wolinsky S, Korber B, Neumann A, Daniels M, Kunstman K, Whetsell A, Furtado M, Cao Y,
Ho D, Safrit J, Koup R. 1996. Adaptative evolution of human immunodeficiency
virus-type 1 during the natural course of infection. Science 272:537-542.
Yoshioka K, Kakumu S, Hayashi H, Shinagawa T, Wakita T, Ishikawa T, Itoh Y, Takayanagi
M. 1991. Anti-hepatitis C antibodies in patients with chronic non-A, non-B hepatitis:
relation to disease progression and effect of interferon alpha. Am J Gastroenterol
86(10):1495-1499.
Yuki N, Hayashi N, Hagiwara H, Takehara T, Katayama K, Kasahara A, Fusamoto H,
Kamada T. 1993. Quantitative analysis of antibodies to hepatitis C virus during
interferon-alpha therapy. Hepatology 17:960-965.
Zeuzem S, Lee J, Roth WK. 1997. Mutations in the nonstructural 5A gene of european
Figure Legends
Figure 1: Evolution of viral load (histogram) and ALT (black line) levels in the 3 groups of
patients during the study. Viral load and ALT scales are indicated on the left and on the right,
respectively. The ALT upper limit of the normal (ULN) value is indicated by a dotted line.
BT, breakthrough.
Figure 2: Phylogenetic tree of the predominant amino acid sequences of the core region in all
patients analysed. Patients whose predominant sequence evolved during treatment are in bold
type. Each patient is designated by a number. BT: breakthrough patient; NR: non responder;
R: responder; preT: before treatment; bt: breakthrough; M: month of treatment; postT: after
treatment. For patient #4, two successive samples were available before breakthrough (at 5
and 8 months of treatment respectively).
Figure 3: Phylogenetic tree of the predominant amino acid sequences of the PePHD domain
and its flanking regions in all patients analysed. Patients whose predominant sequence
evolved during treatment are in bold type. Each patient is designated by a number. BT:
breakthrough patient; NR: non responder; R: responder; preT: before treatment; bt:
breakthrough; W and M: week or month of treatment; postT:, after treatment. For patient #12,
two predominant sequences were present before treatment (named 1 and 2). For patient #4,
two successive samples were available before breakthrough (at 5 and 8 months of treatment
respectively). For patient #6, two different sequences (before bt (1) and (2)) were obtained in
2 separate amplifications of the sample. Pre- and post-treatment samples of patient #2 were
in the latter sequence. It is therefore not clear that the strain has evolved between both
analyses.
Figure 4: Major V3 sequences in genotype 1b-infected patients. Each sequence was
compared to the HCV-J 1b prototype sequence. The positions of the first and last amino acids
of the V3 domain in the HCV polyprotein are indicated under HCV-J sequence. Each patient
is designated by a number. BT: breakthrough patient; R: responder; NR: non responder; preT:
before treatment; bt: breakthrough; W and M; week and month of treatment; post: after
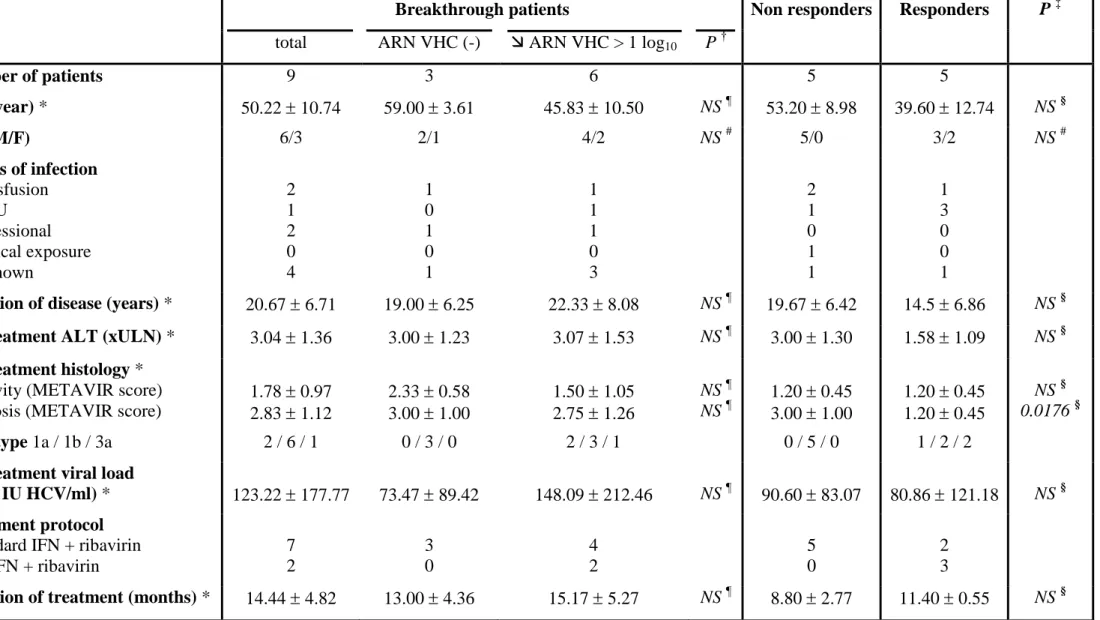
Table I: Clinical and virological characteristics of the patients prior to therapy.
Breakthrough patients Non responders Responders P ‡
total ARN VHC (-) ARN VHC > 1 log10 P †
Number of patients 9 3 6 5 5 Age (year) * 50.22 10.74 59.00 3.61 45.83 10.50 NS ¶ 53.20 8.98 39.60 12.74 NS § Sex (M/F) 6/3 2/1 4/2 NS # 5/0 3/2 NS # Routes of infection Transfusion IVDU Professional Medical exposure Unknown 2 1 2 0 4 1 0 1 0 1 1 1 1 0 3 2 1 0 1 1 1 3 0 0 1
Duration of disease (years) * 20.67 6.71 19.00 6.25 22.33 8.08 NS ¶ 19.67 6.42 14.5 6.86 NS §
Pretreatment ALT (xULN) * 3.04 1.36 3.00 1.23 3.07 1.53 NS ¶ 3.00 1.30 1.58 1.09 NS §
Pretreatment histology *
Activity (METAVIR score) Fibrosis (METAVIR score)
1.78 0.97 2.83 1.12 2.33 0.58 3.00 1.00 1.50 1.05 2.75 1.26 NS ¶ NS ¶ 1.20 0.45 3.00 1.00 1.20 0.45 1.20 0.45 NS § 0.0176 § Genotype 1a / 1b / 3a 2 / 6 / 1 0 / 3 / 0 2 / 3 / 1 0 / 5 / 0 1 / 2 / 2
Pretreatment viral load
(x 104 IU HCV/ml) * 123.22 177.77 73.47 89.42 148.09 212.46 NS ¶ 90.60 83.07 80.86 121.18 NS §
Treatment protocol
Standard IFN + ribavirin PegIFN + ribavirin 7 2 3 0 4 2 5 0 2 3
Duration of treatment (months) * 14.44 4.82 13.00 4.36 15.17 5.27 NS ¶ 8.80 2.77 11.40 0.55 NS §
* Data expressed as mean SD; † comparison between the 2 profiles of breakthrough patients; ‡ comparison between the 3 groups of patients;
§
Table II: Number of mutations in the NS5A pretreatment predominant sequences of genotype 1b-infected patients compared to the HCV-J sequence.
PKR-binding domain (2209-73) * ISDR (2209-48) * V3 (2356-79) *
Breakthrough patients Total (N=6) 6.83 4.07 2.67 3.14 5.00 1.10 HCV RNA (-) (N=3) 6.33 4.04 2.33 2.31 4.67 0.58 ARN VHC > 1 log10 (N=3) 7.33 4.93 3.00 4.36 5.33 1.53 P-value ‡ 0.4867 0.8166 0.6374 Non responders (N=5) 4.00 1.87 0.40 0.55 3.50 1.73 Responders (N=2) 6.50 2.12 2.50 2.12 10.5 0.71 P-value § 0.4863 0.1412 0.0425 ¶
* Data expressed as the mean number of mutations standard deviation,
‡
The mean number of mutations were compared between the 2 profiles of breakthrough patients using the non parametric Mann-Whitney test,
§
The mean number of mutations were compared between the 3 groups using the non parametric Kruskall-Wallis test,
¶
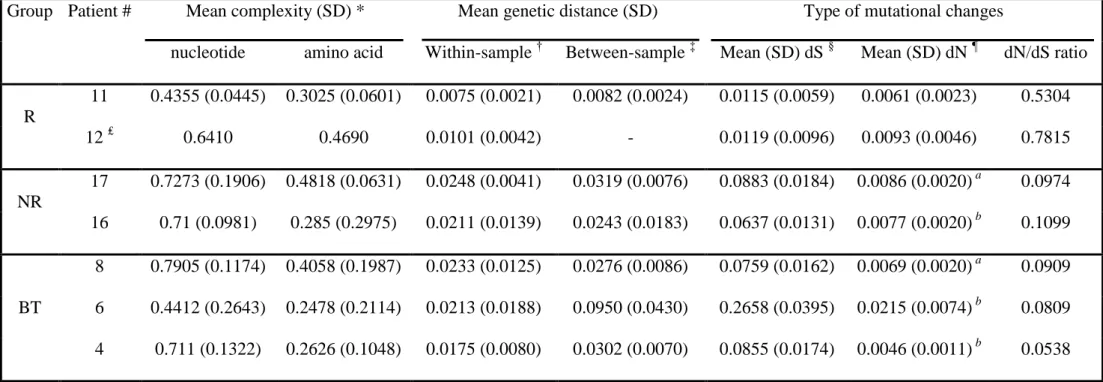
Table III: Analysis of PePHD and flanking regions quasispecies in genotype 1b-infected patients.
Group Patient # Mean complexity (SD) * Mean genetic distance (SD) Type of mutational changes
nucleotide amino acid Within-sample † Between-sample ‡ Mean (SD) dS § Mean (SD) dN ¶ dN/dS ratio
R 11 0.4355 (0.0445) 0.3025 (0.0601) 0.0075 (0.0021) 0.0082 (0.0024) 0.0115 (0.0059) 0.0061 (0.0023) 0.5304 12 ₤ 0.6410 0.4690 0.0101 (0.0042) - 0.0119 (0.0096) 0.0093 (0.0046) 0.7815 NR 17 0.7273 (0.1906) 0.4818 (0.0631) 0.0248 (0.0041) 0.0319 (0.0076) 0.0883 (0.0184) 0.0086 (0.0020) a 0.0974 16 0.71 (0.0981) 0.285 (0.2975) 0.0211 (0.0139) 0.0243 (0.0183) 0.0637 (0.0131) 0.0077 (0.0020) b 0.1099 BT 8 0.7905 (0.1174) 0.4058 (0.1987) 0.0233 (0.0125) 0.0276 (0.0086) 0.0759 (0.0162) 0.0069 (0.0020) a 0.0909 6 0.4412 (0.2643) 0.2478 (0.2114) 0.0213 (0.0188) 0.0950 (0.0430) 0.2658 (0.0395) 0.0215 (0.0074) b 0.0809 4 0.711 (0.1322) 0.2626 (0.1048) 0.0175 (0.0080) 0.0302 (0.0070) 0.0855 (0.0174) 0.0046 (0.0011) b 0.0538
* Mean Shannon entropy calculated for all samples obtained for each patient.
†
Mean within-sample genetic distance calculated for all samples obtained for each patient.
‡
Mean genetic distance between all samples obtained for each patient.
§
Mean proportion of synonymous substitutions per synonymous site among all quasispecies of each patient.
¶
Mean proportion of non synonymous substitutions per non synonymous site among all quasispecies of each patient. It was compared to the proportion
of synonymous substitutions per synonymous site by using a Z-test (a P < 0.001, b P < 0.0001).
₤
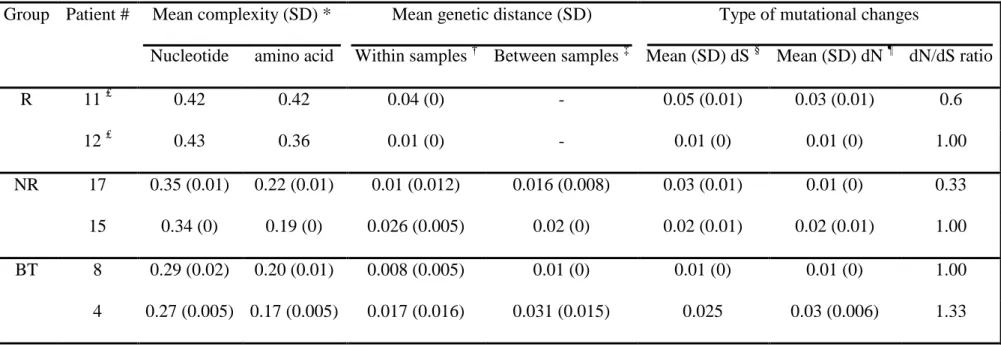
Table IV: Analysis of core region quasispecies in genotype 1b-infected patients.
Group Patient # Mean complexity (SD) * Mean genetic distance (SD) Type of mutational changes
Nucleotide amino acid Within samples † Between samples ‡ Mean (SD) dS § Mean (SD) dN ¶ dN/dS ratio
R 11 ₤ 0.42 0.42 0.04 (0) - 0.05 (0.01) 0.03 (0.01) 0.6 12 ₤ 0.43 0.36 0.01 (0) - 0.01 (0) 0.01 (0) 1.00 NR 17 0.35 (0.01) 0.22 (0.01) 0.01 (0.012) 0.016 (0.008) 0.03 (0.01) 0.01 (0) 0.33 15 0.34 (0) 0.19 (0) 0.026 (0.005) 0.02 (0) 0.02 (0.01) 0.02 (0.01) 1.00 BT 8 0.29 (0.02) 0.20 (0.01) 0.008 (0.005) 0.01 (0) 0.01 (0) 0.01 (0) 1.00 4 0.27 (0.005) 0.17 (0.005) 0.017 (0.016) 0.031 (0.015) 0.025 0.03 (0.006) 1.33
* Mean Shannon entropy calculated for all samples obtained for each patient.
†
Mean within-sample genetic distance calculated for all samples obtained for each patient.
‡
Mean genetic distance between all samples obtained for each patient.
§
Mean proportion of synonymous substitution per synonymous site among all quasispecies of each patient.
¶
Mean proportion of non synonymous substitution per non synonymous site among all quasispecies of each patient.
₤