HAL Id: hal-03213687
https://hal.sorbonne-universite.fr/hal-03213687
Submitted on 30 Apr 2021
HAL is a multi-disciplinary open access
archive for the deposit and dissemination of sci-entific research documents, whether they are pub-lished or not. The documents may come from teaching and research institutions in France or abroad, or from public or private research centers.
L’archive ouverte pluridisciplinaire HAL, est destinée au dépôt et à la diffusion de documents scientifiques de niveau recherche, publiés ou non, émanant des établissements d’enseignement et de recherche français ou étrangers, des laboratoires publics ou privés.
Proteomics and Transcriptomics of the Hippocampus
and Cortex in SUDEP and High-Risk SUDEP Patients
Dominique Leitner, James Mills, Geoffrey Pires, Arline Faustin, Eleanor
Drummond, Evgeny Kanshin, Shruti Nayak, Manor Askenazi, Chloe Verducci,
Bei Jun Chen, et al.
To cite this version:
Dominique Leitner, James Mills, Geoffrey Pires, Arline Faustin, Eleanor Drummond, et al.. Pro-teomics and Transcriptomics of the Hippocampus and Cortex in SUDEP and High-Risk SUDEP Patients. Neurology, American Academy of Neurology, 2021, pp.10.1212/WNL.0000000000011999. �10.1212/WNL.0000000000011999�. �hal-03213687�
Neurology Publish Ahead of Print DOI: 10.1212/WNL.0000000000011999
Proteomics and Transcriptomics of the Hippocampus and Cortex in SUDEP and High-Risk SUDEP Patients
1. The Article Processing Charge was funded by Finding a Cure for Epilepsy and Seizures (FACES).
This is an open access article distributed under the terms of the Creative Commons Attribution-NonCommercial-NoDerivatives License 4.0 (CC BY-NC-ND), which permits downloading and sharing the work provided it is properly cited. The work cannot be changed in any way or used commercially without permission from the journal.
Neurology® Published Ahead of Print articles have been peer reviewed and accepted for publication. This manuscript will be published in its final form after copyediting, page composition, and review of proofs. Errors that could affect the content may be corrected during these processes.
Dominique F. Leitner, PhD*1,2, James D. Mills, PhD*3, Geoffrey Pires, MS*2,4,5, Arline Faustin, MD2,4, Eleanor Drummond, PhD2,4,6, Evgeny Kanshin, PhD7, Shruti Nayak, MS7, Manor Askenazi, PhD8, Chloe Verducci, BA1, Bei Jun Chen, PhD9, Michael Janitz, PhD9, Jasper J. Anink, BSc3, Johannes C. Baayen, MD10, Sander Idema, MD, PhD10, Erwin A. van Vliet, PhD3,11, Sasha Devore, PhD1,2, Daniel Friedman, MD, MSc1,2, Beate Diehl, MD, PhD12, Catherine Scott, MPhil12, Roland Thijs, MD, PhD13, Thomas Wisniewski, MD2,4,14,15, Beatrix Ueberheide,
PhD2,7,16, Maria Thom, MD12, Eleonora Aronica, MD, PhD3,13, Orrin Devinsky, MD1,2
1
Comprehensive Epilepsy Center, NYU School of Medicine, New York, NY, USA.
2
Department of Neurology, NYU Langone Health and School of Medicine, New York, NY, USA.
3
Department of (Neuro)Pathology, Amsterdam UMC, University of Amsterdam, Amsterdam Neuroscience, Meibergdreef 9, Amsterdam, the Netherlands.
4
Center for Cognitive Neurology, NYU Langone Health and School of Medicine, New York, NY, USA.
5
Alzheimer’s and Prion Diseases Team, Paris Brain Institute, CNRS, UMR 7225, INSERM 1127, Sorbonne University UM75, Paris, France.
6
Brain & Mind Centre and School of Medical Sciences, Faculty of Medicine and Health, University of Sydney, Australia.
7
Proteomics Laboratory, Division of Advanced Research Technologies, NYU School of Medicine, New York, NY, USA.
8
Biomedical Hosting LLC, Arlington, MA, USA.
9
School of Biotechnology and Biomolecular Sciences, University of New South Wales, Sydney, New South Wales, Australia.
10
Amsterdam UMC, Vrije Universiteit Amsterdam, Department of Neurosurgery, Amsterdam Neuroscience, De Boelelaan 1117, Amsterdam, the Netherlands.
11
Swammerdam Institute for Life Sciences, Center for Neuroscience, University of Amsterdam, Amsterdam, the Netherlands.
12
Department of Clinical and Experimental Epilepsy, University College London Institute of Neurology, London, UK.
13
Stichting Epilepsie Instellingen Nederland (SEIN), Heemstede, the Netherlands.
14
Department of Pathology, NYU Langone Health and School of Medicine, New York, NY, USA.
15
Department of Psychiatry, NYU Langone Health and School of Medicine, New York, NY, USA.
16
Department of Biochemistry and Molecular Pharmacology, NYU School of Medicine, New York, NY, USA.
* These authors contributed equally to this work.
Search Terms: [60] All Epilepsy/Seizures, [86] Forensic neurology, SUDEP, proteomics, transcriptomics
Publication History: This manuscript was previously published on BioRxiv: doi: https://doi.org/10.1101/2020.07.27.223446
Submission Type: Article Title Character Count: 98 Number of Tables: 3 Number of Figures: 4
Data available on Dryad: 7 tables and 3 figures Word count of Abstract: 206
Word count of Paper: 4464
References: 50 (45 manuscript, 5 supplemental on Dryad) Corresponding author:
Orrin Devinsky
Email: Orrin.Devinsky@nyulangone.org
Disclosure: The authors declare that they have no competing interests.
Statistical analyses were conducted by DL, JD, GP, EK, SN, MA.
Study Funding: NINDS UO1 NS090415 05 Center for SUDEP Research: The
Neuropathology of SUDEP, Finding A Cure for Epilepsy and Seizures (FACES), National Institute of Aging P30AG066512, European Union's Seventh Framework Program (FP7/2007‐2013) under grant agreement 602102 (EPITARGET; EAvV, EA), and the Top Sector Life Sciences & Health via a PPP Allowance made available to the Dutch Epilepsy Foundation to stimulate public-private partnerships (EAvV, EA). This work was supported by funding from the Bluesand Foundation to ED, Philippe Chatrier Foundation to GP. The proteomics work was in part supported by the NYU School of Medicine and a shared instrumentation grant from the NIH, 1S10OD010582-01A1, for the purchase of an Orbitrap Fusion Lumos.
Abstract
Objective: To identify the molecular signaling pathways underlying sudden unexpected death in epilepsy (SUDEP) and high-risk SUDEP compared to epilepsy control patients. Methods: For proteomics analyses, we evaluated the hippocampus and frontal cortex
from microdissected post-mortem brain tissue of 12 SUDEP and 14 non-SUDEP epilepsy
patients. For transcriptomics analyses, we evaluated hippocampus and temporal cortex
surgical brain tissue from mesial temporal lobe epilepsy (MTLE) patients: 6 low-risk and
8 high-risk SUDEP as determined by a short (< 50 seconds) or prolonged (≥ 50 seconds)
postictal generalized EEG suppression (PGES) that may indicate severely depressed brain
activity impairing respiration, arousal, and protective reflexes.
Results: In autopsy hippocampus and cortex, we observed no proteomic differences
between SUDEP and non-SUDEP epilepsy patients, contrasting with our previously
reported robust differences between epilepsy and non-epilepsy control patients.
Transcriptomics in hippocampus and cortex from surgical epilepsy patients segregated by
PGES identified 55 differentially expressed genes (37 protein-coding, 15 lncRNAs, three
pending) in hippocampus.
Conclusion: The SUDEP proteome and high-risk SUDEP transcriptome were similar to
other epilepsy patients in hippocampus and frontal cortex, consistent with diverse
epilepsy syndromes and comorbidities associated with SUDEP. Studies with larger
cohorts and different epilepsy syndromes, as well as additional anatomic regions may
Introduction
Sudden unexpected death in epilepsy (SUDEP) affects 1 in 1000 epilepsy patients
annually and is the leading cause of epilepsy-related deaths.1 SUDEP most often follows
a generalized tonic-clonic seizure (GTCS), and excludes trauma, drowning, status
epilepticus, or other causes. Most deaths are unwitnessed, occur during sleep, and the
patient is found prone.
Studies on SUDEP epidemiology, risk factors, mechanisms, and prevention have
advanced our understanding, although pathophysiological understanding remains
limited.2,3 After a GTCS, prolonged (>50 sec) postictal generalized EEG suppression
(PGES) may increase SUDEP risk and may be a SUDEP biomarker, as severe prolonged
reduced brain activity impairs arousal, respiration, and other autonomic functions.4
However, we cannot predict why some low-risk patients become SUDEP patients,
high-risk patients survive for decades, and other patients succumb to SUDEP despite
recovering from many earlier GTCS. SUDEP patients may harbor pathogenic gene
variants in brain and heart ion channels,5-7 but a role in SUDEP pathogenesis remains
speculative. Animal models of genetic epilepsies and chemo-induced seizures implicate
abnormalities in respiration, arousal, and parasympathetic hyperactivity in SUDEP
pathogenesis.1,8-10 However, the neuropathology of SUDEP parallels findings in
non-SUDEP epilepsy patients.11,12 Potential proteomic and transcriptional molecular
signatures associated with SUDEP have not been studied.
Our study investigated the molecular signaling networks associated with SUDEP in brain
CA1-3, dentate gyrus, and superior frontal gyrus from SUDEP and non-SUDEP epilepsy
patients and transcriptomics in hippocampus and temporal cortex from low and high-risk
SUDEP (PGES < or ≥ 50 seconds) epilepsy surgical tissue.
Methods
Standard Protocol Approvals, Registrations, and Patient Consents: Autopsy brain tissue
and clinical information from SUDEP or non-SUDEP epilepsy patients was obtained
with approval by the New York University School of Medicine Institutional Review
Board (IRB). All next of kin provided written informed consent.
Human Brain Tissue for Proteomics: Post-mortem brain tissue from epilepsy patients
who died from SUDEP or other causes was obtained through the North American
SUDEP Registry (NASR), which began enrolling patients in October 20112, with
approval by the New York University School of Medicine Institutional Review Board
(IRB). Causes of death were classified (OD, DF) into non-SUDEP epilepsy and SUDEP
(definite SUDEP, definite SUDEP plus, and probable SUDEP).1,2 Lifetime GTCS history
was determined from interviews and medical records, representing the best estimate for
each patient and as described previously for these patients.2 After neuropathological
review (TW, AF), brain tissue was processed into formalin fixed paraffin embedded
(FFPE) blocks and sections were stained with luxol fast blue counterstained with
hematoxylin & eosin (LFB/H&E). Archival time for brain tissue storage in formalin was
less than or equal to three years, thus patients were chosen from those that were enrolled
in NASR between July 2014 to March 2017. Patients were age and sex matched from
available NASR cases. There were no significant differences in age at death (p=0.9190,
(p>0.9999). Clinical and neuropathologic data on the 14 non-SUDEP epilepsy and 12
SUDEP patients are summarized in Table 1. Group sizes were determined based on the
number of patients with significant findings as previously reported,14-16 including our
earlier studies in epilepsy patients with similar methods.17,18
Laser Capture Microdissection for Proteomics: FFPE brain tissue blocks containing either
hippocampus (lateral geniculate nucleus level)19 or superior frontal gyrus were sectioned at 8 µm and collected onto laser capture microdissection (LCM) compatible PET slides (Leica). Sections were stained with cresyl violet to localize regions of interest for LCM20 and air dried overnight in a loosely closed container. LCM was used to individually microdissect 10 mm2 from the hippocampal CA1-3 region and superior frontal cortex (layers I-IV), and 4 mm2 from the hippocampal dentate gyrus into LC-MS grade water (Thermo Scientific). Microdissected samples were centrifuged for 2 minutes at 14,000g and stored at -80˚C. LCM was performed at 5X magnification with a LMD6500
microscope equipped with a UV laser (Leica).
Label-free quantitative MS Proteomics: Label-free quantitative MS assessed differential
protein expression, as described previously.18,2122 FFPE cuts were incubate in 50 mM
ammonium bicarbonate (ABC) solution containing 20% (v/v) acetonitrile (ACN) for 1h
at 95oC followed by 2h at 65oC. Disulfide bonds were reduced with 10 mM DTT (1h at
57oC) and alkylated with 30 mM IAA (45 min at RT in the dark). Proteins were
enzymatically digested into peptides with 300 ng of trypsin (sequencing grade, Promega)
overnight at RT. Digestions were quenched by acidification with Trifluoroacetic acid (TFA) and peptides were concentrated and desalted on POROS R2 C18 beads. Eluates were dried in a speedvac and resuspended in 0.5% AcOH. LC separation was performed
online on EASY-nLC 1200 (Thermo Scientific) utilizing a Acclaim PepMap 100 (75 um
x 2 cm) precolumn and a PepMap RSLC C18 (2 um, 100A x 50 cm) analytical column.
Peptides were gradient eluted from the column directly into the Orbitrap Fusion Lumos
mass spectrometer using a 165 min ACN gradient (A=2% ACN 0.5% AcOH / B=80%
ACN 0.5% AcOH). The flowrate was set at 200 nl/min. The mass spectrometer was
operated in a data-dependent acquisition mode.High resolution full MS spectra were
acquired with a resolution of 240,000, an AGC target of 1e6, with a maximum ion
injection time of 50 ms, and scan range of 400 to 1500 m/z. Following each full MS scan
data-dependent HCD MS/MS scans were acquired in the ion trap (scan rate rapid, AGC
target of 2e4, NCE of 32). Precursor isolation window were set at 2 Da.
Proteomics Computational Analysis: MS data were analyzed as previously
described.1821,22 RAW MS data were processed using the MaxQuant23 software (v. 1.6.3.4) and the SwissProt human protein database (www.uniprot.org) containing 20,421
entries. Database including a common list of common laboratory contaminants (248
entries) were also used in the search. All peptide-spectrum matches, peptide and protein
identifications were filtered to get a desired FDR level below 1% (calculated using decoy
database approach). For the MS/MS search enzyme specificity was set to trypsin (up to 2
miscleavages), precursor mass tolerance was set to 20 ppm with subsequent non-linear
mass recalibration. Carbamidomethylation of cysteine was set as a fixed modification,
protein N-term acetylation and methionine oxidation were set as a variable modifications.
Match between runs (MBR) algorithm was enabled to transfer peptide feature
identifications between MS runs based on LC retention time (0.7 min tolerance after
performed used built in “maxLFQ” algorithm24 and normalization was performed
separately for all samples within each ROI.
Data analysis was performed in Perseus framework25
(http://www.perseus-framework.org/), R environment (http://www.r-project.org/), or GraphPad Prism.
Proteomics Statistical Analyses: The protein expression matrix (n=4,129) was filtered to contain only proteins that were quantified in ≥ 8 replicates in at least 1 condition (SUDEP or non-SUDEP epilepsy) in any brain region (n=2,847). Subsequently missing values
were imputed from the intensity distribution simulated low-intensity protein features
(width of 0.3 and downshift of 1.8 relative to measured protein intensity distribution). An
unpaired two-tailed t test was performed for PCA1 in each brain region to determine
significance of separation in the SUDEP and non-SUDEP epilepsy patients. All other
analyses were done using nonimputed data. A Student’s two sample t-test was used to
access statistical significance of the changes in protein abundance between conditions.
Obtained p-values were adjusted for multiple hypothesis testing using permulation-based
FDR to a cutoff of 5%. Cell type specific annotations were included in the data available
on Dryad (Table e-3) and on volcano plots in Fig. 1F-H, derived from previous data.26
Annotations were included when a protein had only one associated cell type after
removing cerebellar annotations and when the annotation included more than one
associated cell type (both excitatory and inhibitory neuron annotations) and were thus
assigned a general neuron annotation, for a total of 1066 possible annotations.
Proteomics Correlation: For the correlation in protein abundance between conditions and
brain regions we used averaged over replicates LFQ values. A Pearson’s correlation was
each brain region, with 2715 proteins for hippocampal CA1-3, 2464 proteins for dentate
gyrus, and 2695 proteins for the frontal cortex.
Immunohistochemistry: Immunohistochemistry was performed to validate the identified
protein of interest, ermin (ERMN) as previously described.18,27 Briefly, FFPE sections (8
µm) were deparaffinized and rehydrated through a series of xylenes and ethanol dilutions.
Heat-induced antigen retrieval was performed with 10 mM sodium citrate, 0.05% triton-x
100; pH6. Blocking with 10% normal donkey serum was followed by ERMN primary
antibody (1:200, Sigma HPA038295) overnight at 4°C. Sections were incubated with
donkey anti-rabbit Alexa-Fluor 647 secondary antibody (1:500, Thermofisher Invitrogen)
and coverslipped.
Image semiquantitative analysis: Whole slide scanning was performed at 20X
magnification with a NanoZoomer HT2 (Hamamatsu) microscope using the same settings
for each slide. One image containing the hippocampal CA1-3 region was collected for
each patient, 11 non-SUDEP epilepsy and 11 SUDEP patients. Images were analyzed in
Fiji ImageJ to compare the amount of ERMN in SUDEP and non-SUDEP epilepsy
patients. The same binary threshold was used for all images to determine the number of
ERMN positive pixels in each image, which was reported as a percentage of the total
image area. An unpaired t-test was performed for statistical analysis; p-value <0.05 was
considered significant.
Confocal imaging was used to collect representative images of ERMN
settings on each slide with a Plan-Apochromat 20X/0.8 M27 objective and a pinhole of
38 µm.
sequencing datasets: Small sequencing (small RNAseq) and
RNA-sequencing (RNAseq) data sets were retrieved form the European Genome-phenome
Archive (accession number: EGAS00001003922) from MTLE patients undergoing
surgical resection and with available PGES duration greater than 1 second.17 The patients
were age and sex matched, with no significant differences in age at surgery (p=0.6622,
unpaired t-test), disease duration (p=0.4391), disease onset (p=0.4612), or sex
(p>0.9999).Small RNAseq and RNAseq data was retrieved for 6 patients with PGES < 50 sec, indicating a potential low-risk for SUDEP, and 8 patients with PGES ≥ 50 sec, indicating a potential high-risk for SUDEP as previously described.4 Table 2 summarizes
the clinical characteristics of these patients. PGES occurrence and duration was assessed
by two epileptologists (CS, RT).
Bioinformatic analysis of RNAseq data: Bioinformatic analysis was performed as
described previously.17 Briefly, library normalization and differential expression testing
was carried out using the R package DESeq2. The Wald test identified differentially
expressed genes using a Benjamini-Hochberg adjusted p-value <0.05 for significance.
Cell type specific annotations were included (Dryad table e-4, table e-5), and on volcano
plots in Fig. 2C, 2E, derived from previous data.26 Annotations were included when a
protein had only one associated cell type after removing cerebellar annotations and when
the annotation included more than one associated cell type (both excitatory and inhibitory
neuron annotations) and were thus assigned a general neuron annotation, for a total of
A Reactome pathway enrichment analysis was performed using the R package
ReactomePA. The differentially expressed genes from the RNAseq differential expression
analysis were put into R and tested for over-representation of enriched Reactome
pathways using hypergeometric testing. Pathways with a Benjamini-Hochberg corrected
p-value <0.05 were considered significantly enriched.
Bioinformatic analysis of small RNAseq data: Bioinformatic analysis of the small
RNAseq data was performed as described previously.17 Briefly, library normalization and differential expression testing was carried out using the R package DESeq2. The Wald test identified differentially expressed genes with a Benjamini-Hochberg adjusted p-value <0.05 considered significant.
RNAseq validation by qPCR: The gene expression of GDNF Family Receptor Alpha 1
(GFRA1) was assessed in the same cohort of samples used in the RNAseq analysis for which sufficient RNA remained (PGES < 50s, n=4, PGES ≥ 50s, n=7). PCR primers based on the reported cDNA sequences were designed using the NCBI primer design
tool.28 The sequences for the forward and the reverse primers of GFRA1 were 5’-TCT
TCC AGC CGC AGA AGA AC-3’ and 5’-AAC AGT GGG GAC AAA CTG GG-3’
respectively. 700 ng of total RNA was reverse transcribed into cDNA using oligodT
primers. For each qPCR reaction, a mastermix was prepared as follows: 1 µl cDNA, 2.5
µl of 2x SensiFAST SYBR Green Reaction Mix (Bioline Inc, Taunton, MA, USA), 0.2
µM of both reverse and forward primers and the PCRs were run on a Roche Lightcycler
480 thermocycler (Roche Applied Science, Basel, Switzerland). Each sample and primer
relative to the reference genes, Eukaryotic Translation Elongation Factor 1 Alpha 1
(EEF1A1) and Chromosome 1 Open Reading Frame 43 (C1orf43). The normalized ratio
was compared between the two groups (Mann-Whitney U test); p <0.05 was considered
significant.
Data availability: All data needed to evaluate the conclusions in the paper are present in
the paper and on Dryad at https://doi.org/10.5061/dryad.dfn2z3508. Additional data
related to this paper may be requested from the authors.
Results
Proteome of SUDEP and non-SUDEP epilepsy autopsy patients
The differential expression of proteins in autopsy SUDEP (n=12) and non-SUDEP (n=14) epilepsy patients was evaluated using label-free quantitative mass spectrometry (MS) in the microdissected hippocampal CA1-3 region, dentate gyrus, and superior frontal cortex, as these regions have been implicated in ictogenesis and may also be influenced by seizure activity.13 Patient histories are summarized in Table 1 and Fig. 1A-B. A principal component analysis (PCA) did not distinguish SUDEP and non-SUDEP epilepsy patients in any of the studied brain regions (Fig. 2A-C). The main source of variation in these patients, PCA1, did not show a significant difference when comparing
SUDEP and non-SUDEP epilepsy patients in each brain region by an unpaired two-tailed
t test, as depicted by a box plot in Fig. 2A-C. Lifetime GTCS burden, associated with an
protein differences as seen by a separation of groups. From patients with available data (9
SUDEP and 8 SUDEP epilepsy patients), 55.6% of SUDEP and 62.5% of
non-SUDEP epilepsy patients had > 10 lifetime GTCS, and 22.2% of non-SUDEP patients and
12.5% of non-SUDEP epilepsy patients had > 100 lifetime GTCS. Lifetime GTCS
frequency did not contribute to group differences in the PCA (Fig.2A-C). There was no
enrichment in SUDEP or non-SUDEP epilepsy patients with > 10 or > 100 lifetime
GTCS by a Fisher’s exact test. Further, in the PCA, there was no relationship of SUDEP
status to neuropathology (focal cortical dysplasia (FCD, n = 10), hippocampal dentate
gyrus dysgenesis (n = 7), hippocampal sclerosis (n = 3), and gliosis (n = 3)). Of note,
microdissected regions did not necessarily contain observed FCD as it may have been
present in other brain regions. Similarly, neuropathology was unrelated to SUDEP status
(FCD in 50% of SUDEP patients versus 28.6% of non-SUDEP epilepsy patients, Fisher’s
exact test, p = 0.4216).
There were no significant differences in protein expression between SUDEP and
non-SUDEP epilepsy patients in any brain region (Fig. 3A-C, Dryad fig. e-1A-C, table e-3).
Further, a correlation of LFQ values for all proteins showed the similarity in protein
expression when comparing SUDEP and non-SUDEP epilepsy patients in each brain
region by a Pearson’s correlation (p < 0.0001) with the corresponding R2 values being
≥0.98 (Dryad, fig. e-1). Brain cell type specific annotation was evaluated in the 2847 identified proteins, derived from previous methods,26 with 19.8% (564/2847) proteins having an annotation while the remaining 80.2% did not and were more ubiquitously expressed or cell type is unknown. Most (78.2%; 502/564) annotated proteins were generally neuronal, with excitatory neuron proteins predominating (48.1%; 271/564)
SUDEP patients (p<0.01; Dryad table e-1-2), but these were not statistically significant at a 5% FDR. Several of these protein changes have been reported in epilepsy animal models and non-epilepsy patients or include proteins encoded by genes in which
mutations have been previously linked to epilepsy. Yet, none of the proteins trending for
altered expression in this study (Dryad table e-1-2) have been previously linked to
SUDEP pathogenesis. Ermin (ERMN) had the strongest trend for difference in SUDEP
with a 2.8-fold decrease in the hippocampal CA1-3 region when comparing SUDEP and
non-SUDEP epilepsy patients by MS (Dryad fig. e-2A). Further, ERMN was detected in
more non-SUDEP epilepsy than SUDEP patients by MS, indicating lower abundance of
this protein in SUDEP. Validation of the quantitative MS findings with
semiquantification of immunohistochemistry (Dryad fig. e-2B) also showed a decrease of
ERMN in SUDEP patients with a 1.3-fold change but was not significant (student’s
unpaired t test, p-value = 0.4871). Because ERMN may play a role in myelinogenesis and
myelin maintenance, we reviewed the mature oligodendrocyte marker myelin basic
protein (MBP) but found no difference between SUDEP and non-SUDEP epilepsy
patients in the hippocampal CA1-3 region by MS (Dryad fig. e-2C).
Analysis of RNAseq and small RNAseq in low and high-risk SUDEP patients
To determine whether there is a pathological difference in epilepsy patients of low (PGES <50 seconds, n=6) and high (PGES ≥50 seconds, n=8) risk of SUDEP, RNAseq and small RNAseq analyses were performed on resected surgical frozen hippocampal and
temporal cortex tissue. Patient histories are summarized in Table 2 and Fig. 4A. A t-SNE
(t-distributed stochastic neighbor embedding) plot revealed that anatomical region rather
the hippocampus of low and high-risk SUDEP patients identified 55 differentially
expressed genes: 11 were decreased and 44 were increased in high-risk SUDEP patients
(Fig. 4C, Dryad table e-4). Brain cell type specific annotation was evaluated in the 55 differentially expressed genes in the hippocampus, derived from previous methods,26 with 14.5% (8/55) of genes having a cell type specific annotation: 4 generally neuronal, 3 excitatory neuron, and 1 inhibitory neuron. The dominant transcripts for the differentially expressed genes in hippocampus were: 37 protein-coding, 15 long non-coding RNAs (lncRNAs), and three awaiting confirmation (Fig. 4D). A Reactome pathway analysis on the 55 significant genes in the hippocampus did not reveal a significant association with any signaling pathways. Several of these genes have been associated with epilepsy human disease and have been studied in animal models, however none of the genes in Table 3 have been linked to SUDEP pathogenesis. The most significantly decreased protein-coding gene in the high-risk SUDEP patients, GFRA1, was validated by real time
quantitative PCR (RT-qPCR, Table 3, Dryad fig. S3). In accordance with the RNAseq
analysis, GFRA1 was decreased 1.7-fold in the high-risk SUDEP patients
(Mann-Whitney U test, p-value = 0.0121). In the temporal cortex, one protein-coding gene
(SLC6A5) with an “undefined” cell type annotation was significantly decreased in the
high-risk SUDEP patients, within this small group of patients (Fig. 4E, Dryad table e-5).
No genes were differentially expressed in the small RNAseq analyses in the hippocampus
and temporal cortex (Dryad table e-6-7).
Comparison of SUDEP Proteome to High-risk SUDEP Transcriptome
Comparing the 37 differentially expressed protein-coding genes in the RNAseq analyses
to the proteomics analyses, only four (GRM2, ERC2, CRTC1, AHNAK2) were detected
hippocampal CA1-3 region but showed no trend in differential expression for SUDEP
patients compared to non-SUDEP epilepsy patients in the proteome. Additional analysis
on the fold change of proteins in the hippocampus with a p<0.05 (before the FDR at 5%,
n=83 proteins) that match RNA gene IDs (n=83 gene IDs) do not show a significant
correlation (p=0.3510, R2=0.01075, Pearson correlation).
Discussion
Our study compared SUDEP or high-risk SUDEP patients to epilepsy controls and
revealed no differentially expressed proteins in the hippocampus and frontal cortex and
limited transcriptomic changes in the hippocampus and temporal cortex. Thus, the
proteome in SUDEP and transcriptome in high-risk SUDEP largely reflects other
epilepsy patients, consistent with the diverse spectrum of syndromes and severities
associated with SUDEP.2 In the hippocampus, the few differentially expressed genes
identified in high-risk SUDEP patients included a high proportion of lncRNAs (15/55,
27%). Given that we detect robust proteome18 and transcriptome17 differences in the
hippocampus and cortex with similar group sizes for epilepsy and non-epilepsy control
patients, our data in this study suggest that these brain regions are not especially or
uniquely affected in SUDEP.
To validate the label-free quantitative MS findings, immunohistochemistry was used to
confirm changes in ermin (ERMN) expression, as this protein had the strongest trend for
difference in SUDEP. Immunohistochemistry results corroborated a trend in a decreased
compared to non-SUDEP epilepsy patients, although this similarly was not significant.
Further, ERMN was not significantly altered in the current RNAseq study or in our
previous proteomics analyses between non-SUDEP epilepsy and controls.18 However, in
our previous RNAseq study between MTLE and non-epilepsy controls, ERMN was
decreased17 and is reportedly decreased in a murine model of status epilepticus.29
Expressed by oligodendrocytes, ERMN regulates cytoskeleton arrangement during
myelinogenesis and myelin sheath maintenance.30 Myelin damage may occur after
prolonged seizures and its loss may promote further seizure activity.31 We found that the
mature oligodendrocyte marker myelin basic protein (MBP) is decreased in epilepsy
patients compared to non-epilepsy control patients,18 and it is decreased in the
hippocampus of an animal model of epilepsy.32 However, we found no further decrease
in MBP expression in SUDEP or high-risk SUDEP patients when compared to controls in
this study, nor was MBP different in our recent RNAseq analysis between MTLE and
non-epilepsy controls.17 Overall, ERMN is significantly decreased in surgical MTLE
versus non-epilepsy controls at the transcriptomic level17 and trending to decrease in
protein expression of SUDEP versus non-SUDEP epilepsy, indicating that ERMN may
be decreased in response to the elevated seizure activity that may be seen in refractory
epilepsy that requires surgery and in some patients with SUDEP. The affect on
myelination, as measured by MBP, is only apparent in these patients for protein
expression rather than gene expression in epilepsy versus non-epilepsy controls with no
further decrease in SUDEP. Thus, further investigation should assess the potential role of
ERMN in epilepsy and SUDEP, and whether reduced ERMN may reflect the severity of
The RNAseq and small RNAseq analyses showed moderate changes in the hippocampus
and minimal differences in the temporal cortex in high-risk compared to low-risk SUDEP
MTLE patients. Interestingly, 15/55 differentially expressed genes in the hippocampus
were lncRNAs. LncRNAs are an understudied transcriptomic component implicated in
many neurological disorders,33 but few studies have been done regarding their role in
epilepsy or SUDEP.34 Among the protein-coding genes differentially expressed in the
hippocampus, GFRA1 (GDNF Family Receptor Alpha 1) was the most decreased. GDNF
(glial cell-derived neurotrophic factor) binds to GFRA1 and plays a role in neuronal
survival and differentiation, including that of GABAergic interneurons.35 Localized
release of GDNF in the hippocampus of an animal model of epilepsy suppresses seizure
activity.36 Thus, decreased GFRA1 may reflect a change in cell survival or result in
reduced GDNF mediated seizure suppression in high-risk SUDEP patients. Of the top 20
differentially expressed genes (Table 3), SGCG (Sarcoglycan Gamma) had the largest
change at a 22.0-fold increase (adjusted p=0.0023) in the high-risk SUDEP patients.
SGCG is expressed in the cerebrovascular system and may localize to vascular smooth
muscle cells, potentially involved in membrane contractility, stabilization, and signaling
in the associated dystrophin complex affecting neurovascular coupling.37 Its neural role is
unknown, but aberrant cerebrovascular organization occurs in MTLE.38 Additional
studies are needed to determine how the altered levels of some protein-coding genes and
lncRNAs we identified may affect mechanisms related to SUDEP risk.
Protein expression in the brain has rarely been studied in human SUDEP. Hippocampal
HSP70 positive neurons are reportedly increased in post-mortem SUDEP patients when
compared to non-SUDEP epilepsy patients, but similar to surgical epilepsy patients,
seizure in SUDEP patients.39 HSP70 expression was similar in both the proteomic and
RNAseq analyses among our patients. Another immunohistochemistry study found few
differences in the hippocampus, amygdala, and medulla of post-mortem SUDEP
compared to non-SUDEP epilepsy and non-epilepsy control patients with minimal
significant changes reported for several markers of inflammation (CD163, HLA-DR,
GFAP), compromised blood brain barrier (IgG, albumin), and HIF-1α, a transcriptional
regulator of cellular responses to hypoxia.12 We found increased GFAP in the
hippocampus of three epilepsy patients (3/26, 11.5%); two had gliosis independent of
SUDEP status. GFAP was not increased in most non-SUDEP epilepsy patients when
compared to non-epilepsy control patients,18 but it was increased in the hippocampus of
one (1/14, 7.1%) epilepsy patient with hippocampal gliosis. Increased GFAP occurs in
some epilepsy patients and after prolonged seizures in rodent models.40 Further, GFAP
was not altered in MTLE patients with high-risk of SUDEP in the current RNAseq
analysis, but this gene was significantly increased in the hippocampus of MTLE patients
compared to non-epilepsy controls.17
Our study had some limitations. The LCM derived label-free quantitative MS allows for
detection of localized protein changes that would not be possible using bulk homogenate,
however this technique detects a lower quantity of membrane proteins that are relatively
insoluble with this method. Thus, we may not detect differential expression of some
membrane proteins, although downstream signaling pathways reflecting their functional
activity may be identified. Additional limitations include the heterogeneity of epilepsies,
seizure types, and neuropathology due to available patients, and further reinforces the
importance of banking various brain tissue samples from SUDEP patients. Our study was
than epilepsy-subgroups. Potential pathogenic gene variants were not assessed in our
patients. Our proteomics analyses were based on NASR referrals, skewed by major
referral sources: the San Diego Medical Examiner Office (mainly low socioeconomic
white and Hispanic patients) and direct referrals (mainly high socioeconomic white
patients). For the RNAseq analyses, surgical patients had treatment-resistant MTLE.
PGES duration as a biomarker of SUDEP risk has not been validated, can vary within the
same patient for different seizures, and the number video EEG-recorded GTCS in each
patient was limited.4,41,42 Thus, group differences may reflect sampling bias. Further, the
number of patients used for the RNAseq temporal cortex analyses was low. Finally,
further investigation is needed in brain regions implicated in SUDEP, including the
brainstem, as it modulates autonomic functions and it has been suggested that
seizure-induced postictal depression of arousal, respiratory, and cardiac function may occur in
SUDEP.43,44
In summary, in contrast to robust differences we found in proteomic and RNAseq
analyses between epilepsy and non-epilepsy patients,17,18 there were no differences
detected in the proteomic analyses of autopsy tissue from SUDEP and non-SUDEP
epilepsy patients and limited transcriptomic differences comparing surgical tissue from
low and high-risk SUDEP patients in the brain regions analyzed, consistent with the
diverse epilepsy syndromes and comorbidities associated with SUDEP and indicating that
Figures and Tables:
Figure 1. SUDEP and non-SUDEP epilepsy patient history. A) Patient history is
summarized for autopsy SUDEP and non-SUDEP epilepsy patients. B) A summary of
Figure 2. Proteomics PCA analyses in hippocampus, dentate gyrus, and frontal
cortex of SUDEP and non-SUDEP epilepsy patients. A-C) A principal component
analysis (PCA) of the proteomics analyses shows the indicated variation in each brain
region of SUDEP patients (n=12) and non-SUDEP epilepsy patients (n=14). There is no
separation by SUDEP status or lifetime GTCS history burden. An unpaired two-tailed t
test of PCA1 between the SUDEP and non-SUDEP epilepsy groups in each brain region
was not significant, as depicted by a box plot with bars indicating minimum and
Figure 3. Proteomics analyses in hippocampus, dentate gyrus, and frontal cortex of
SUDEP and non-SUDEP epilepsy patients. A-C) Volcano plots indicate that there are
no significantly different proteins in the hippocampal CA1-3 region, dentate gyrus, or
frontal cortex of SUDEP and non-SUDEP epilepsy patients as determined by a student’s
two tailed t-test with permutation correction at a 5% FDR. The top proteins with the
lowest p values in each brain region are noted. Cell type specific protein annotation is
included, with the most predominant listed in decreasing order in the legend. Proteins
Figure 4. RNAseq in hippocampus and temporal cortex with low and high-risk
SUDEP, as determined by PGES. A) Patient history is summarized for low and
high-risk SUDEP patients. B) The t-SNE (t-distributed stochastic neighbor embedding) plot of
RNAseq data shows separation by brain region rather than SUDEP risk status. C) A
volcano plot shows the results of differential expression analysis of the hippocampus
from low-risk (n=4) and high-risk (n=8) SUDEP patients. Eleven genes were decreased
and 44 genes were increased in hippocampus of high-risk SUDEP patients. The Wald test
identified differentially expressed genes using a Benjamini-Hochberg adjusted p-value
<0.05 for significance. Cell type specific gene annotation is included, with the most
predominant listed in decreasing order in the legend. Genes annotated “General –
Neuron” have both excitatory and inhibitory neuron annotations. D) Biotypes of
differentially expressed genes are depicted in the hippocampus for high-risk SUDEP
compared to low-risk SUDEP patients. Of the 55 differentially expressed genes 67.3%
were protein-coding genes, 27.3% were long non-coding RNAs, and 5.5% are yet to be
experimentally confirmed (TEC). E) A volcano plot shows the results of differential
expression analysis in the temporal cortex from low-risk (n=2) and high-risk (n=3)
SUDEP patients. One gene was decreased and no genes were increased in the temporal
cortex. The Wald test identified differentially expressed genes using a
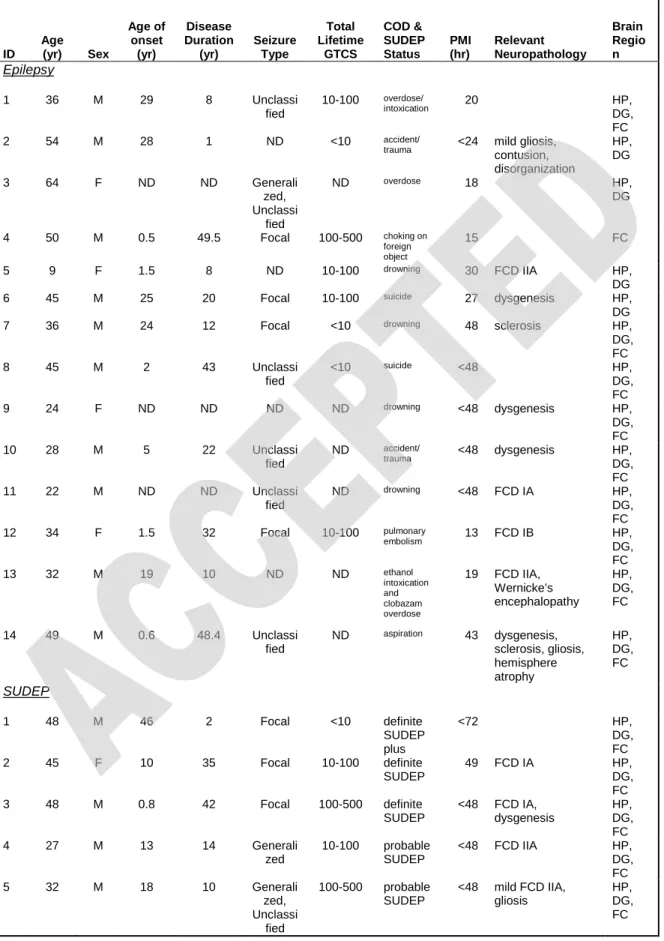
Table 1. Epilepsy and SUDEP Patients in Proteomics Analyses
Table 1. Epilepsy and SUDEP Patients in Proteomics Analyses
ID Age (yr) Sex Age of onset (yr) Disease Duration (yr) Seizure Type Total Lifetime GTCS COD & SUDEP Status PMI (hr) Relevant Neuropathology Brain Regio n Epilepsy 1 36 M 29 8 Unclassi fied 10-100 overdose/ intoxication 20 HP, DG, FC 2 54 M 28 1 ND <10 accident/
trauma <24 mild gliosis,
contusion, disorganization HP, DG 3 64 F ND ND Generali zed, Unclassi fied ND overdose 18 HP, DG 4 50 M 0.5 49.5 Focal 100-500 choking on foreign object 15 FC 5 9 F 1.5 8 ND 10-100 drowning 30 FCD IIA HP, DG 6 45 M 25 20 Focal 10-100 suicide 27 dysgenesis HP,
DG 7 36 M 24 12 Focal <10 drowning 48 sclerosis HP,
DG, FC 8 45 M 2 43 Unclassi fied <10 suicide <48 HP, DG, FC 9 24 F ND ND ND ND drowning <48 dysgenesis HP, DG, FC 10 28 M 5 22 Unclassi fied ND accident/ trauma <48 dysgenesis HP, DG, FC 11 22 M ND ND Unclassi fied ND drowning <48 FCD IA HP, DG, FC 12 34 F 1.5 32 Focal 10-100 pulmonary embolism 13 FCD IB HP, DG, FC 13 32 M 19 10 ND ND ethanol intoxication and clobazam overdose 19 FCD IIA, Wernicke’s encephalopathy HP, DG, FC 14 49 M 0.6 48.4 Unclassi fied ND aspiration 43 dysgenesis, sclerosis, gliosis, hemisphere atrophy HP, DG, FC SUDEP 1 48 M 46 2 Focal <10 definite SUDEP plus <72 HP, DG, FC 2 45 F 10 35 Focal 10-100 definite SUDEP 49 FCD IA HP, DG, FC 3 48 M 0.8 42 Focal 100-500 definite SUDEP <48 FCD IA, dysgenesis HP, DG, FC 4 27 M 13 14 Generali zed 10-100 probable SUDEP <48 FCD IIA HP, DG, FC 5 32 M 18 10 Generali zed, Unclassi fied 100-500 probable SUDEP <48 mild FCD IIA, gliosis HP, DG, FC
6 20 F 9 11 Generali zed, Unclassi fied 10-100 definite SUDEP <48 dysgenesis HP, DG, FC 7 28 M 27 1 Focal <10 definite SUDEP 25 dysgenesis HP, DG, FC 8 30 F ND ND Unclassi fied ND definite SUDEP 23 HP, DG, FC 9 55 M 5 50 Focal ND definite SUDEP plus <48 sclerosis, infarct HP, DG, FC 10 20 M 9 11 ND 0 definite SUDEP <48 FCD IIA HP, DG, FC 11 44 M 4 40 Unclassi fied ND definite SUDEP <48 FCD IIA HP, DG, FC 12 49 F 41 9 Unclassi fied <10 definite SUDEP <24 venous angioma HP, DG, FC
yr = year, hr = hours, ND = not determined, GTCS = generalized tonic-clonic seizure, COD = cause of death, PMI = post-mortem interval, FCD = focal cortical dysplasia, HP = hippocampus, DG = dentate gyrus, FC = frontal cortex, dysgenesis = dysgenesis of the hippocampal dentate gyrus, sclerosis = hippocampal sclerosis
Table 2. Epilepsy Patients with Low or High-Risk of SUDEP in RNAseq Analyses
Table 2. Epilepsy Patients with Low or High-Risk of SUDEP in RNAseq Analyses
ID Age at Surgery (yr) Sex Age of onset (yr) Disease Duration (yr) Seizure Type Prior to GTCS PGES length (sec) Brain Region PGES < 50 sec
1 34 M 19 15 Focal with motor 3 TC
2 22 M 7 15 Focal with motor 37 TC
3 33 F 9 24 Focal with motor 24 HP, TC
4 33 F 22 11 Focal with motor 43 HP
5 58 M 51 7 Focal without motor 2 HP 6 29 F 13 16 Focal to bilateral tonic-clonic 49 HP PGES ≥ 50 sec
1 30 M 21 9 Focal with motor 62 HP, TC
2 53 M 0 53 Focal with motor 73 HP, TC
3 55 F 20 35 Focal without
motor
51 HP
4 32 F 15 17 Focal with motor 52 HP
5 45 F 23 22 Focal with motor 52 HP
6 37 M 8 11 Focal with motor 54 HP
7 25 M 18 7 Focal to bilateral tonic-clonic 51 HP 8 25 M 17 8 Focal without motor 62 HP
PGES = postictal generalized EEG suppression, GTCS = generalized tonic-clonic seizure, yr = years, sec = seconds, HP = hippocampus, TC = temporal cortex
Table 3. Top 20 Significant Protein-coding Genes in Hippocampus of High vs Low-Risk SUDEP Patients
Table 3. Top 20 Significant Protein-coding Genes in Hippocampus of High vs Low-Risk SUDEP Patients
Ensembl Gene ID
Gene ID Gene Name UniProt
ID Adjusted p Value Fold Change Related References Increased ENSG00000164082.14 GRM2 Glutamate Metabotropic Receptor 2 Q14416 0.00002 3.80 Increased protein in epilepsy;18 GRM2 knockout mice are NMDA toxicity resistant thus GRM2 activation may be damaging to neurons exposed to toxic insults;45 decreased transcript in MTLE with sclerosis46
and in models of status epilepticus47,48 ENSG00000137766.16 UNC13C Unc-13 Homolog C Q8NB66 0.00026 2.67 Increased transcript in
status epilepticus murine model29
ENSG00000082293.12 COL19A1 Collagen Type XIX Alpha 1 Chain
Q14993 0.00057 3.33
ENSG00000164112.12 TMEM155 Transmembrane Protein 155
Q4W5P6 0.00057 3.47
ENSG00000152784.15 PRDM8 PR/SET Domain 8 Q9NQV8 0.00142 2.79 Gain-of-function mutation results in myoclonus epilepsy with Lafora bodies7,49
ENSG00000027001.9 MIPEP Mitochondrial Intermediate Peptidase Q99797 0.00142 2.92 ENSG00000102683.7 SGCG Sarcoglycan Gamma Q13326 0.00229 22.01
ENSG00000033867.16 SLC4A7 Solute Carrier Family 4 Member 7
Q9Y6M7 0.00287 2.47 Increased transcript in status epilepticus murine model29
ENSG00000164638.10 SLC29A4 Solute Carrier Family 29 Member 4
Q7RTT9 0.00412 2.12
ENSG00000171126.7 KCNG3 Potassium Voltage-Gated Channel Modifier Subfamily G Member 3
Q8TAE7 0.00566 3.09
Decreased
ENSG00000151892.14 GFRA1 GDNF family receptor alpha-1
P56159 0.00180 2.39 Localized GDNF release in animal models of epilepsy suppresses seizure activity36,50 ENSG00000108018.15 SORCS1 Sortilin Related
VPS10 Domain Containing Receptor 1
Q8WY21 0.00318 2.32
ENSG00000146070.16 PLA2G7 Phospholipase A2 Group VII
Q13093 0.00461 2.91 Decreased transcript in status epilepticus murine model29
ENSG00000005981.12 ASB4 Ankyrin Repeat And SOCS Box Containing 4
Q9Y574 0.00507 4.18
ENSG00000185567.6 AHNAK2 AHNAK Nucleoprotein 2
Q8IVF2 0.00752 1.65
ENSG00000140557.11 ST8SIA2 Alpha-2,8-sialyltransferase 8B
Q92186 0.01550 3.02
ENSG00000152595.16 MEPE Matrix Extracellular Phosphoglycoprotei n
Q9NQ76 0.02729 4.56
ENSG00000177106.14 EPS8L2 EPS8 Like 2 Q9H6S3 0.02729 1.54
ENSG00000189127.7 ANKRD34 B
Ankyrin Repeat Domain 34B
A5PLL1 0.02963 6.12
ENSG00000224982.3 TMEM233 Transmembrane protein 233
Appendix 1. Authors
Name Location Contribution
Dominique F. Leitner, PhD NYU School of Medicine
Data collection and analysis, drafting and revision of manuscript
James D. Mills, PhD Amsterdam UMC Data collection and analysis, drafting and revision of manuscript
Geoffrey Pires, MS NYU School of Medicine
Data collection and analysis, drafting and revision of manuscript
Arline Faustin, MD NYU School of Medicine
Clinical data collection, drafting and revision of manuscript Eleanor Drummond, PhD University of
Sydney
Data collection and analysis, drafting and revision of manuscript
Evgeny Kanshin, PhD NYU School of Medicine
Data collection and analysis, drafting and revision of manuscript
Shruti Nayak, MS NYU School of
Medicine
Data collection and analysis Manor Askenazi, PhD Biomedical
Hosting LLC
Data analysis, drafting and revision of manuscript Chloe Verducci, BA NYU School of
Medicine
Clinical data collection, revision of manuscript
Bei Jun Chen, PhD University of New South Wales
Data analysis Michael Janitz, PhD University of New
South Wales
Data analysis
Jasper J. Anink, BSc Amsterdam UMC Clinical data collection Johannes C. Baayen, MD Amsterdam UMC Clinical data collection Sander Idema, MD, PhD Amsterdam UMC Clinical data collection Erwin A. van Vliet, PhD Amsterdam UMC Data collection Sasha Devore, PhD NYU School of
Medicine
Revision of manuscript Daniel Friedman, MD, MSc NYU School of
Medicine
Clinical data collection, drafting and revision of manuscript Beate Diehl, MD, PhD University College
London
Clinical data collection Catherine Scott, MPhil University College
London
Clinical data collection Roland Thijs, MD, PhD Stichting Epilepsie
Instellingen Nederland
Clinical data collection
Thomas Wisniewski, MD NYU School of Medicine
Clinical data collection, drafting and revision of manuscript Beatrix Ueberheide, PhD NYU School of
Medicine
Data collection and analysis, drafting and revision of manuscript
Maria Thom, MD University College London
Clinical data collection, drafting and revision of manuscript Eleonora Aronica, MD, PhD Stichting Epilepsie
Instellingen Nederland
Design and conceptualized study, clinical data collection, drafting and revision of manuscript
Orrin Devinsky, MD NYU School of Medicine
Design and conceptualized study, clinical data collection, drafting and revision of manuscript
Acknowledgments: The authors wish to thank the participating families and clinicians
References
1. Devinsky O, Hesdorffer DC, Thurman DJ, Lhatoo S, Richerson G. Sudden unexpected death in epilepsy: epidemiology, mechanisms, and prevention. Lancet Neurol 2016;15(10):1075-88.
2. Verducci C, Hussain F, Donner E, Moseley BD, Buchhalter J, Hesdorffer D, Friedman D, Devinsky O. SUDEP in the North American SUDEP Registry: The full spectrum of epilepsies. Neurology 2019;93(3):e227-e236.
3. Thom M, Michalak Z, Wright G, Dawson T, Hilton D, Joshi A, Diehl B, Koepp M, Lhatoo S, Sander JW and others. Audit of practice in sudden unexpected death in epilepsy (SUDEP) post mortems and neuropathological findings. Neuropathol Appl Neurobiol 2016;42(5):463-76.
4. Kang JY, Rabiei AH, Myint L, Nei M. Equivocal significance of post-ictal
generalized EEG suppression as a marker of SUDEP risk. Seizure 2017;48:28-32. 5. Myers CT, Mefford HC. Advancing epilepsy genetics in the genomic era.
Genome Med 2015;7:91.
6. Friedman D, Kannan K, Faustin A, Shroff S, Thomas C, Heguy A, Serrano J, Snuderl M, Devinsky O. Cardiac arrhythmia and neuroexcitability gene variants in resected brain tissue from patients with sudden unexpected death in epilepsy (SUDEP). NPJ Genom Med 2018;3:9.
7. Wang J, Lin ZJ, Liu L, Xu HQ, Shi YW, Yi YH, He N, Liao WP. Epilepsy-associated genes. Seizure 2017;44:11-20.
8. Zhang H, Zhao H, Zeng C, Van Dort C, Faingold CL, Taylor NE, Solt K, Feng HJ. Optogenetic activation of 5-HT neurons in the dorsal raphe suppresses seizure-induced respiratory arrest and produces anticonvulsant effect in the DBA/1 mouse SUDEP model. Neurobiol Dis 2018;110:47-58.
9. Zhang P, Zhang L, Li Y, Zhu S, Zhao M, Ding S, Li J. Quantitative Proteomic Analysis To Identify Differentially Expressed Proteins in Myocardium of Epilepsy Using iTRAQ Coupled with Nano-LC-MS/MS. J Proteome Res 2018;17(1):305-314.
10. Kalume F, Westenbroek RE, Cheah CS, Yu FH, Oakley JC, Scheuer T, Catterall WA. Sudden unexpected death in a mouse model of Dravet syndrome. J Clin Invest 2013;123(4):1798-808.
11. Thom M, Boldrini M, Bundock E, Sheppard MN, Devinsky O. Review: The past, present and future challenges in epilepsy-related and sudden deaths and
biobanking. Neuropathol Appl Neurobiol 2018;44(1):32-55.
12. Michalak Z, Obari D, Ellis M, Thom M, Sisodiya SM. Neuropathology of SUDEP: Role of inflammation, blood-brain barrier impairment, and hypoxia. Neurology 2017;88(6):551-561.
13. Aronica E, Mühlebner A. Neuropathology of epilepsy. Handb Clin Neurol 2017;145:193-216.
14. Mendonça CF, Kuras M, Nogueira FCS, Plá I, Hortobágyi T, Csiba L, Palkovits M, Renner É, Döme P, Marko-Varga G and others. Proteomic signatures of brain regions affected by tau pathology in early and late stages of Alzheimer's disease. Neurobiol Dis 2019;130:104509.
15. Johnson ECB, Dammer EB, Duong DM, Yin L, Thambisetty M, Troncoso JC, Lah JJ, Levey AI, Seyfried NT. Deep proteomic network analysis of Alzheimer's disease brain reveals alterations in RNA binding proteins and RNA splicing associated with disease. Mol Neurodegener 2018;13(1):52.
16. Xu J, Patassini S, Rustogi N, Riba-Garcia I, Hale BD, Phillips AM, Waldvogel H, Haines R, Bradbury P, Stevens A and others. Regional protein expression in human Alzheimer's brain correlates with disease severity. Commun Biol 2019;2:43.
17. Mills JD, van Vliet EA, Chen BJ, Janitz M, Anink JJ, Baayen JC, Idema S, Devore S, Friedman D, Diehl B and others. Coding and non-coding transcriptome of mesial temporal lobe epilepsy: Critical role of small non-coding RNAs.
Neurobiol Dis 2020;134:104612.
18. Pires G, Leitner D, Drummond EE, Kanshin E, Nayak S, Askenazi M, Faustin A, Friedman D, Debure L, Ueberheide B and others. Proteomic Differences in the Hippocampus and Cortex of Epilepsy Brain Tissue. bioRxiv
2020:2020.07.21.209163.
19. Kinney HC, Poduri AH, Cryan JB, Haynes RL, Teot L, Sleeper LA, Holm IA, Berry GT, Prabhu SP, Warfield SK and others. Hippocampal Formation Maldevelopment and Sudden Unexpected Death across the Pediatric Age Spectrum. J Neuropathol Exp Neurol 2016;75(10):981-997.
20. Drummond ES, Nayak S, Ueberheide B, Wisniewski T. Proteomic analysis of neurons microdissected from formalin-fixed, paraffin-embedded Alzheimer's disease brain tissue. Sci Rep 2015;5:15456.
21. Drummond E, Nayak S, Ueberheide B, Wisniewski T. Localized Proteomics of Individual Neurons Isolated from Formalin-Fixed, Paraffin-Embedded Tissue Sections Using Laser Capture Microdissection. 2017. 289-301 p.
22. Drummond E, Pires G, MacMurray C, Askenazi M, Nayak S, Bourdon M, Safar J, Ueberheide B, Wisniewski T. Phosphorylated tau interactome in the human Alzheimer's disease brain. Brain 2020.
23. Cox J, Mann M. MaxQuant enables high peptide identification rates, individualized p.p.b.-range mass accuracies and proteome-wide protein quantification. Nat Biotechnol 2008;26(12):1367-72.
24. Cox J, Hein MY, Luber CA, Paron I, Nagaraj N, Mann M. Accurate proteome-wide label-free quantification by delayed normalization and maximal peptide ratio extraction, termed MaxLFQ. Mol Cell Proteomics 2014;13(9):2513-26.
25. Tyanova S, Temu T, Sinitcyn P, Carlson A, Hein MY, Geiger T, Mann M, Cox J. The Perseus computational platform for comprehensive analysis of (prote)omics data. Nat Methods 2016;13(9):731-40.
26. Lake BB, Chen S, Sos BC, Fan J, Kaeser GE, Yung YC, Duong TE, Gao D, Chun J, Kharchenko PV and others. Integrative single-cell analysis of transcriptional and epigenetic states in the human adult brain. Nat Biotechnol 2018;36(1):70-80. 27. Drummond E, Nayak S, Faustin A, Pires G, Hickman RA, Askenazi M, Cohen M,
Haldiman T, Kim C, Han X and others. Proteomic differences in amyloid plaques in rapidly progressive and sporadic Alzheimer's disease. Acta Neuropathol
2017;133(6):933-954.
28. Ye J, Coulouris G, Zaretskaya I, Cutcutache I, Rozen S, Madden TL. Primer-BLAST: a tool to design target-specific primers for polymerase chain reaction. BMC Bioinformatics 2012;13:134.
29. Hansen KF, Sakamoto K, Pelz C, Impey S, Obrietan K. Profiling status epilepticus-induced changes in hippocampal RNA expression using high-throughput RNA sequencing. Sci Rep 2014;4:6930.
30. Brockschnieder D, Sabanay H, Riethmacher D, Peles E. Ermin, a myelinating oligodendrocyte-specific protein that regulates cell morphology. J Neurosci 2006;26(3):757-62.
31. Gibson EM, Geraghty AC, Monje M. Bad wrap: Myelin and myelin plasticity in health and disease. Dev Neurobiol 2018;78(2):123-135.
32. Ye Y, Xiong J, Hu J, Kong M, Cheng L, Chen H, Li T, Jiang L. Altered
hippocampal myelinated fiber integrity in a lithium-pilocarpine model of temporal lobe epilepsy: a histopathological and stereological investigation. Brain Res 2013;1522:76-87.
33. Li L, Zhuang Y, Zhao X, Li X. Long Non-coding RNA in Neuronal Development and Neurological Disorders. Front Genet 2018;9:744.
34. Villa C, Lavitrano M, Combi R. Long Non-Coding RNAs and Related Molecular Pathways in the Pathogenesis of Epilepsy. Int J Mol Sci 2019;20(19).
35. Canty AJ, Dietze J, Harvey M, Enomoto H, Milbrandt J, Ibáñez CF. Regionalized loss of parvalbumin interneurons in the cerebral cortex of mice with deficits in GFRalpha1 signaling. J Neurosci 2009;29(34):10695-705.
36. Kanter-Schlifke I, Fjord-Larsen L, Kusk P, Angehagen M, Wahlberg L, Kokaia M. GDNF released from encapsulated cells suppresses seizure activity in the epileptic hippocampus. Exp Neurol 2009;216(2):413-9.
37. Boulay AC, Saubaméa B, Cisternino S, Mignon V, Mazeraud A, Jourdren L, Blugeon C, Cohen-Salmon M. The Sarcoglycan complex is expressed in the cerebrovascular system and is specifically regulated by astroglial Cx30 channels. Front Cell Neurosci 2015;9:9.
38. Guelfi S, Botia JA, Thom M, Ramasamy A, Perona M, Stanyer L, Martinian L, Trabzuni D, Smith C, Walker R and others. Transcriptomic and genetic analyses reveal potential causal drivers for intractable partial epilepsy. Brain
2019;142(6):1616-1630.
39. Thom M, Seetah S, Sisodiya S, Koepp M, Scaravilli F. Sudden and unexpected death in epilepsy (SUDEP): evidence of acute neuronal injury using HSP-70 and c-Jun immunohistochemistry. Neuropathol Appl Neurobiol 2003;29(2):132-43. 40. Robel S. Astroglial Scarring and Seizures: A Cell Biological Perspective on
Epilepsy. Neuroscientist 2017;23(2):152-168.
41. Rajakulendran S, Nashef L. Postictal generalized EEG suppression and SUDEP: a review. J Clin Neurophysiol 2015;32(1):14-20.
42. Lamberts RJ, Gaitatzis A, Sander JW, Elger CE, Surges R, Thijs RD. Postictal generalized EEG suppression: an inconsistent finding in people with multiple seizures. Neurology 2013;81(14):1252-6.
43. Mueller SG, Nei M, Bateman LM, Knowlton R, Laxer KD, Friedman D,
Devinsky O, Goldman AM. Brainstem network disruption: A pathway to sudden unexplained death in epilepsy? Hum Brain Mapp 2018;39(12):4820-4830. 44. Patodia S, Somani A, O'Hare M, Venkateswaran R, Liu J, Michalak Z, Ellis M,
Scheffer IE, Diehl B, Sisodiya SM and others. The ventrolateral medulla and medullary raphe in sudden unexpected death in epilepsy. Brain 2018;141(6):1719-1733.
45. Corti C, Battaglia G, Molinaro G, Riozzi B, Pittaluga A, Corsi M, Mugnaini M, Nicoletti F, Bruno V. The use of knock-out mice unravels distinct roles for mGlu2 and mGlu3 metabotropic glutamate receptors in mechanisms of
46. Griffin NG, Wang Y, Hulette CM, Halvorsen M, Cronin KD, Walley NM, Haglund MM, Radtke RA, Skene JH, Sinha SR and others. Differential gene expression in dentate granule cells in mesial temporal lobe epilepsy with and without hippocampal sclerosis. Epilepsia 2016;57(3):376-85.
47. Aronica EM, Gorter JA, Paupard MC, Grooms SY, Bennett MV, Zukin RS. Status epilepticus-induced alterations in metabotropic glutamate receptor expression in young and adult rats. J Neurosci 1997;17(21):8588-95.
48. Pacheco Otalora LF, Couoh J, Shigamoto R, Zarei MM, Garrido Sanabria ER. Abnormal mGluR2/3 expression in the perforant path termination zones and mossy fibers of chronically epileptic rats. Brain Res 2006;1098(1):170-85.
49. Turnbull J, Girard JM, Lohi H, Chan EM, Wang P, Tiberia E, Omer S, Ahmed M, Bennett C, Chakrabarty A and others. Early-onset Lafora body disease. Brain 2012;135(Pt 9):2684-98.
50. Martin D, Miller G, Rosendahl M, Russell DA. Potent inhibitory effects of glial derived neurotrophic factor against kainic acid mediated seizures in the rat. Brain Res 1995;683(2):172-8.
DOI 10.1212/WNL.0000000000011999 published online April 28, 2021
Neurology
Dominique F. Leitner, James D. Mills, Geoffrey Pires, et al.
SUDEP Patients
Proteomics and Transcriptomics of the Hippocampus and Cortex in SUDEP and High-Risk
This information is current as of April 28, 2021
Services
Updated Information &
ull
http://n.neurology.org/content/early/2021/04/28/WNL.0000000000011999.f
including high resolution figures, can be found at:
Subspecialty Collections http://n.neurology.org/cgi/collection/forensic_neurology Forensic neurology http://n.neurology.org/cgi/collection/all_epilepsy_seizures All Epilepsy/Seizures collection(s):
This article, along with others on similar topics, appears in the following
Permissions & Licensing
http://www.neurology.org/about/about_the_journal#permissions
entirety can be found online at:
Information about reproducing this article in parts (figures,tables) or in its
Reprints
http://n.neurology.org/subscribers/advertise
Information about ordering reprints can be found online:
0028-3878. Online ISSN: 1526-632X.
Kluwer Health, Inc. on behalf of the American Academy of Neurology.. All rights reserved. Print ISSN: is now a weekly with 48 issues per year. Copyright Copyright © 2021 The Author(s). Published by Wolters
® is the official journal of the American Academy of Neurology. Published continuously since 1951, it Neurology