HAL Id: hal-01358617
https://hal.sorbonne-universite.fr/hal-01358617
Submitted on 1 Sep 2016
HAL is a multi-disciplinary open access
archive for the deposit and dissemination of
sci-entific research documents, whether they are
pub-lished or not. The documents may come from
teaching and research institutions in France or
abroad, or from public or private research centers.
L’archive ouverte pluridisciplinaire HAL, est
destinée au dépôt et à la diffusion de documents
scientifiques de niveau recherche, publiés ou non,
émanant des établissements d’enseignement et de
recherche français ou étrangers, des laboratoires
publics ou privés.
Distributed under a Creative Commons Attribution| 4.0 International License
Plasma DYRK1A as a novel risk factor for Alzheimer’s
disease
N Janel, M Sarazin, F Corlier, H Corne, Lc de Souza, L Hamelin, A Aka, J
Lagarde, H Blehaut, V Hindié, et al.
To cite this version:
N Janel, M Sarazin, F Corlier, H Corne, Lc de Souza, et al.. Plasma DYRK1A as a novel risk
factor for Alzheimer’s disease. Translational Psychiatry, Nature Pub. Group, 2014, 4, pp.e425.
�10.1038/tp.2014.61�. �hal-01358617�
OPEN
ORIGINAL ARTICLE
Plasma DYRK1A as a novel risk factor for Alzheimer’s
disease
N Janel1,10, M Sarazin2,10, F Corlier3,4,5, H Corne3,4, LC de Souza3,4,5, L Hamelin2, A Aka1, J Lagarde2, H Blehaut6, V Hindié7, J-C Rain7, ML Arbones8, B Dubois3,4, MC Potier4, M Bottlaender9and JM Delabar1
To determine whether apparent involvement of DYRK1A in Alzheimer’s disease (AD) pathology makes it a candidate plasma biomarker for diagnosis, we developed a method to quantify plasma DYRK1A by immunoblot in transgenic mouse models having different gene dosages of Dyrk1a, and, consequently, different relative protein expression. Then, we measured plasma DYRK1A levels in 26 patients with biologically confirmed AD and 25 controls (negative amyloid imaging available on 13). DYRK1A was detected in transgenic mouse brain and plasma samples, and relative levels of DYRK1A correlated with the gene copy number. In plasma from AD patients, DYRK1A levels were significantly lower compared with controls (Po0.0001). Results were similar when we compared AD patients with the subgroup of controls confirmed by negative amyloid imaging. In a subgroup of patients with early AD (CDR = 0.5), lower DYRK1A expression was confirmed. In contrast, no difference was found in levels of DYRK1B, the closest relative of DYRK1A, between AD patients and controls. Further, AD patients exhibited a positive correlation between plasma DYRK1A levels and cerebrospinalfluid tau and phosphorylated-tau proteins, but no correlation with amyloid-β42 levels and Pittsburgh compound B cortical binding. DYRK1A levels detected in lymphoblastoid cell lines from AD patients were also lower when compared with cells from age-matched controls. Thesefindings suggest that reduced DYRK1A expression might be a novel plasma risk factor for AD.
Translational Psychiatry (2014)4, e425; doi:10.1038/tp.2014.61; published online 12 August 2014
INTRODUCTION
An estimated 24 million people worldwide have dementia, and this number, predicted to double every 20 years, will rise to more than 65 million in 2030.1 The most common form of dementia, Alzheimer’s disease (AD) represents a major public health concern and has been identified as a research priority. Identifying blood biomarkers of AD is critical to improving early diagnosis and selecting patients who would benefit from new disease-modifying therapies. Such tools should detect specific features of the disease, have high sensitivity and specificity for AD, and be reliable, reproducible, noninvasive, easy to perform and low cost.
Current pathophysiological biomarkers are limited to amyloid imaging with positron emission tomography (PET) and cerebrosp-inalfluid (CSF) biomarkers, including total tau (T-tau), phosphory-lated tau (p-tau) and beta-amyloid peptide 1–42 (Aβ42) measures.2 These tests can distinguish controls from individuals
with AD with high sensitivity and specificity, even in the early stages of the disease.3 However, CSF collection is invasive and
requires brief hospitalization, whereas PET imaging is costly and not always readily accessible. Therefore, blood-based biomarkers of AD may be of great interest.
Most studies have tried to identify plasma markers of amyloid pathology in accordance with the amyloid hypothesis, which places amyloid at the heart of AD pathogenesis.4However, clinical
signs of AD are more closely associated with cortical progression of the neurofibrillary tangles than amyloid plaques. Neurofibrillary tangles comprise insoluble aggregates of hyperphosphorylated tau protein. Phosphorylation of tau regulates its capacity to form oligomers and aggregates. Once filamentous tau has formed, it can be transmitted to other brain regions. Many phosphokinases, including glycogen synthase kinase 3β (GSK3β), have been implicated in the phosphorylation of tau protein. DYRK1A (dual specificity tyrosine-phosphorylation-regulated kinase 1A) is known to phosphorylate numerous proteins involved in a wide variety of signalling pathways.5 In AD, DYRK1A primes tau molecules for further phosphorylation by GSK3β;6,7
it might also be important in linking Aβ and tau pathology because it is upregulated by Aβ.8 Polymorphisms in phosphokinases, such as DYRK1A, might be associated with an increased risk of AD.9DYRK1A is encoded from
within the Down syndrome chromosomal region10 on human chromosome 21, and current research suggests that overexpres-sion of DYRK1A may be a significant factor leading to cognitive deficits in people with AD and Down syndrome.
This study sought to determine whether apparent involvement of DYRK1A in AD pathology makes it a candidate biomarker for the diagnosis of AD. First, we developed an experimental animal approach to detect and quantify DYRK1A levels in mouse plasma. Then we used this method to analyse human plasma DYRK1A
1
Unité de Biologie Fonctionnelle et Adaptative, Sorbonne Paris Cité, Université Paris Diderot, EAC4413 CNRS, Paris, France;2
Department of Neurology, Neurology of Memory and Langage, Université Paris Descartes, Sorbonne Paris Cité, INSERM UMR S894, Centre Hospitalier Sainte Anne, Paris, France;3Department of Neurology, Alzheimer Institute (MB, LCdS, BD, MS), Hôpital Pitié-Salpêtrière (Assistance Publique—Hôpitaux de Paris), Paris, France;4
Brain & Spine Institute (ICM) CNRS UMR7225, INSERM UMRS 975, Paris, France;
5
Université Pierre et Marie Curie, Sorbonne Universités, Paris, France;6
Fondation Jérome Lejeune, Paris, France;7
HYBRIGENICS Services SAS, Paris, France;8
Instituto de Biología Molecular de Barcelona (CSIC), Barcelona, Spain and9CEA (MB), DSV, Institut d’Imagerie Biomédicale, Service Hospitalier Frédéric Joliot, Orsay, France. Correspondence: Professor
M Sarazin or Dr JM Delabar, Unité de Biologie Fonctionnelle et Adaptative, Sorbonne Paris Cité, Université Paris Diderot, EAC4413 CNRS, Case 7104, 75205 Paris, France. E-mail: m.sarazin@ch-sainte-anne.fr or delabar@univ-paris-diderot.fr
10
These authors contributed equally to this work. Received 16 May 2014; accepted 5 June 2014
Citation: Transl Psychiatry (2014)4, e425; doi:10.1038/tp.2014.61 © 2014 Macmillan Publishers Limited All rights reserved 2158-3188/14 www.nature.com/tp
levels in patients with AD biologically confirmed (positive CSF biomarkers and PiB-PET) and controls defined by normal cognitive performances and negative PiB-PET imaging.
MATERIALS AND METHODS
Identification and quantification of DYRK1A
Experimental mice. We conducted afirst experimental animal study using murine BAC clones containing the entire Dyrk1a gene, as previously described.11Mice were housed in standard cages with access to food and water ad libitum, under a controlled environment (temperature = 20 ± 1 °C; humidity = 60%), and with a light/dark cycle of 12 h. All experiments were conducted in accordance with the ethical standards of French and European regulations (European Communities Council Directive, 86/609/ EEC). Official authorization from the French Ministry of Agriculture was granted to carry out research and experiments on animals (authorization number 75–369). The study was approved by the local ethical committee (Univ Paris Diderot). Mice carrying the murine BAC containing one copy of Dyrk1a were maintained on a C57BL/6J background; Dyrk1a(+/− ) mice were maintained on a CD1 background and genotyped as described.11 Mice were anesthetized and blood was collected through retro-orbital sinus sampling into tubes containing a 1/10 volume of 3.8% sodium citrate.
Plasma was isolated by centrifugation at 2500 g. Mouse brains were collected and frontal cortices were dissected.
Protein purification and quantification. Western blots were processed as described previously.11,12 Proteins separated by SDS–PAGE were trans-ferred to a nitrocellulose membrane (ProtanR) using a slot blot apparatus (Proteigene, St Marcel, France). Membranes were saturated by incubation in 5% w/v nonfat milk powder in Tris–saline buffer (1.5 mMTris base, pH 8;
5 mM NaCl; 0.1% Tween-20) and incubated overnight at 4 °C with
antibodies against DYRK1A (1/250; Abnova Corporation, Taipei, Taiwan; H00001859-M01). Binding of the primary antibody was detected by incubation with HRP-conjugated secondary antibody using the Western Blotting Luminol Reagent (Santa Cruz Biotechnology, Tebu, France). Ponceau-S coloration was used as an internal control. Digitized images of the immunoblots obtained using an LAS-3000 imaging system (Fuji Photo Film, Paris, France) were used for densitometric measurements with an image analyser (UnScan It software, Silk Scientific, Orem, UT, USA). All assays were performed in duplicate. In addition, human brain frontal cortex was obtained (control from La Salpetrière Hospital Brain Bank) and proteins were analysed with the same method.
Brain and plasma DYRK1A quantification. Using yeast two-hybrid, we screened a highly complex random-primed human adult brain cDNA library to identify genes encoding DYRK1A-interacting proteins. The assay Figure 1. DYRK1A expression in plasma as detected by immunoblot. Western blotting of (a) DYRK1A expression in mouse and human frontal cortex; and (b) DYRK1A expression in human plasma. Slot blot analysis of relative DYRK1A protein levels in: (c) cortex of Dyrk1a(+/− )mice
(120-day-old males) in light grey versus wild-type mice (WT); (d) cortex of mBACtgDyrk1a mice (120-(120-day-old males) in dark grey versus WT; (e) plasma of Dyrk1a(+/− )mice; and (f) plasma of mBACtgDyrk1a mice. Box plots indicate median with min to max, *Po0.05; a.u., arbitrary unit.
DYRK1A a novel plasma biomarker for AD N Janel et al
2
identified 79 DYRK1A interactants (data not shown). Of these, 54 were from the extracellular matrix, like clusterin, an abundant protein in plasma.13 DYRK1B, the closest member within the DYRK family of proteins (81% identity for the central 427 amino acids) but not functionally overlapping with DYRK1A, was used as a negative control in a second yeast two-hybrid experiment. Most interactants of DYRK1B were intracellular proteins that differed from those interacting with DYRK1A; there were some extracellular common preys, including clusterin and MAGEH1. From DYRK1A sequence, we hypothesized that the histidine-rich domain of DYRK1A could interact with cysteine-rich regions (like those present in the EGF motif) and generate false-positives in the yeast two-hybrid experiment. We thus ran one by one yeast two-hybrid experiments using a mutated form of DYRK1A lacking the histidine-rich domain and some extracellular preys: ABHD12, MAGEH1 and clusterin: we confirmed the interaction of DYRK1A with these preys.
To determine whether interactions with extracellular matrix proteins and other plasma proteins signalled the likely presence of DYRK1A in plasma, we performed western blotting using human albumin-depleted plasmas. Long DYRK1A isoforms migrating at the same apparent molecular weight (80–85 kDa) as the isoforms from human and mouse frontal cortex were detected using a DYRK1A mouse monoclonal antibody (Figures 1a and b) and two different rabbit DYRK1A polyclonal antibodies (data not shown), all raised against the carboxy terminus of DYRK1A.
To assess the relative amount of DYRK1A in plasma we used a slot blot method previously developed for the quantification of a large number of brain homogenates from transgenic mice.11Along with quantifying plasma
DYRK1A in wild-type mice, we used two different models carrying altered gene copy numbers for Dyrk1a: a mBACtgDyrk1a model with three copies of the murine Dyrk1a gene and a Dyrk1a(+/− ) model with only one copy.14
Clinical research
Population. Fifty-one participants were recruited in the Memory and Alzheimer Institute of the Pitié-Salpêtrière Hospital, including 30 subjects from the Biomage study (ANR-07-LVIE-002–01). Twenty-six biologically confirmed AD patients (n = 11 with clinical dementia rating (CDR) = 0.5; n = 15 with CDR⩾ 1) were included using the following criteria: (1) predominant and progressive episodic memory impairment, characterized by low free recall not normalized with cueing, associated or not with other cognitive deficits;15 and (2) biological evidence of AD from CSF AD biomarker profile and/or significant amyloid retention on positron emission tomography (PET) with 11C-labelled Pittsburgh compound B [11C-PiB]. A‘CSF AD biomarker profile’ was defined as score below 0.8 for the ratio of Aβ42:tau, calculated with the formula Aβ42/[240+(1.18 × T-tau)].16,17Significant fixation of PiB on PET was defined by a global cortical
index higher than 1.4.16,17Twenty-one patients had lumbar puncture, 17 patients had PiB-PET (12 patients had both lumbar puncture and PiB-PET exam). We excluded subjects who presented with the following: (1) clinical or neuroimaging evidence of focal lesions, (2) severe cortical or subcortical vascular lesions or (3) severe depression.
Twenty-five healthy controls were selected according to the following criteria: (1) Mini-Mental State Exam ⩾ 27, normal neuropsychological testing and normal neurological exam; (2) no neurological or psychiatric history; and (3) global index for11C-PiB retention lower than 1.4 when
PiB-PET was available (n = 13).
Both groups were matched for age (Table 1).
The study was approved by the Ethics Committee of Pitié-Salpêtrière Hospital. All the subjects provided written informed consent before participating.
Measurement of CSF biomarkers
CSF samples were collected by lumbar puncture and analysed for total tau, tau phosphorylated at threonine 181 (p-tau), and Aβ42 with a double-sandwich enzyme-linked immunosorbent assay method (Innogenetics, Gent, Belgium) at the Metabolic Biochemistry Department at the Pitié-Salpêtrière Hospital, as described elsewhere.18 Controls had no lumbar
puncture for ethical reasons.
11
C-PiB-PET imaging procedures
PET imaging with11C-labelled PiB was performed in 13 controls and in 17 AD patients included in the Biomage study, using previously described methods.17 In brief, a global cortical index was defined by the mean standard uptake value ratio (with the cerebellum as the reference region) of the following cortical regions: (i) frontal cortex, by grouping the
orbitofrontal, polar prefrontal and dorsolateral cortex; (ii) anterior cingulate; (iii) medial cingulate; (iv) posterior cingulate; (v) precuneus; (vi) occipital cortex, by grouping the calcarine cortex, occipital cortex and cuneus; (vii) temporal cortex, by grouping the anterior and lateral temporal cortex; (viii) hippocampus and (ix) parietal cortex, by grouping the inferior and superior parietal cortex and the parieto-temporal junction.
Blood collection and processing
Blood samples were collected from participants into citrate containers, and the containers were immediately placed on ice until processed. Plasma was obtained by centrifugation of containers for 15 min at 2000 g at 4 °C, then rapidly frozen and stored at − 80 °C until analysis. Plasma and serum aliquots were thawed on the same day of the experiment. Plasma was diluted at 1:20 in 1 × phosphate-buffered saline.
To identify and quantify plasma DYRK1A, the same technique developed in mouse plasma was applied to plasma from individuals with AD and age-matched control individuals.
In addition, for subjects included in the Biomage study (n = 30), APOE genotypes were analysed.
Cell cultures
Epstein–Barr virus-transformed lymphoblastoid cell lines (LCLs) were derived from B lymphocytes of late-onset AD patients and from nondemented age-matched control individuals. LCLs were cultured in Opti-MEM with GlutaMax (Invitrogen, Cergy, France) supplemented with 5% fetal bovine serum from a unique batch and 1% penicillin and streptomycin mix (10 000 U ml− 1). Cell lines were grown at 37 °C in humidified incubators under 5% CO2 and collected at a cell density below 3 × 10⁵.
Statistical analysis
Results are expressed as mean ± s.e.m. Normality was assessed using the Kolmogorov–Smirnov test. Statistical analysis was performed with unpaired t-test and two-tailed P-values for comparison of means between two groups using Prism6 (Graphpad) software, which calculates the exact P-value and accounts for ties among values. Correlations were assessed with nonparametric Spearman's rank correlation test. Data were consid-ered significant when P ⩽ 0.05. A P-value of 0.06–0.10 was considered to indicate a strong statistical tendency due to the small sample size.
RESULTS
Dyrk1a in brain and plasma of transgenic mouse models having different gene dosage of Dyrk1a
After showing that long DYRK1A isoforms from human and mouse frontal cortex migrated at the same apparent molecular weight using the highly specific monoclonal antibody, we used immuno-blot to analyse plasma DYRK1A in transgenic mouse models (see Materials and methods, Figures 1c and d). DYRK1A was detected in mouse plasma samples (Figures 1e and f). In addition, relative levels of DYRK1A correlated with the gene copy number for
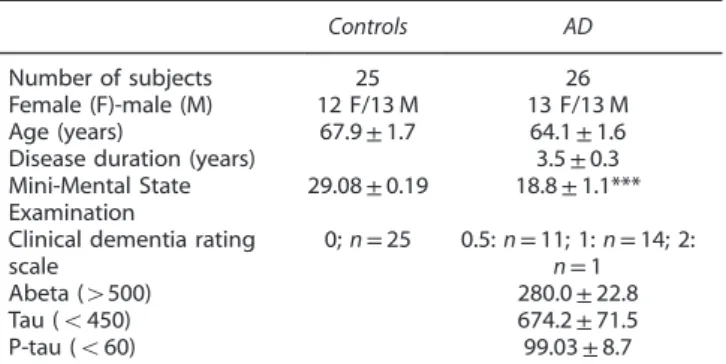
Table 1. Demographic and clinical data of studied groups Controls AD Number of subjects 25 26 Female (F)-male (M) 12 F/13 M 13 F/13 M Age (years) 67.9± 1.7 64.1± 1.6 Disease duration (years) 3.5± 0.3 Mini-Mental State
Examination
29.08± 0.19 18.8± 1.1*** Clinical dementia rating
scale 0; n= 25 0.5: n= 11; 1: n = 14; 2: n= 1 Abeta (4500) 280.0± 22.8 Tau (o450) 674.2± 71.5 P-tau (o60) 99.03± 8.7 Abbreviation: AD, dementia in Alzheimer’s disease. ***Po0.001. DYRK1A a novel plasma biomarker for AD
N Janel et al
Dyrk1a in the transgenic mouse models carrying different gene copy numbers.
Comparison of DYRK1A and DYRK1B in plasma of AD patients and controls
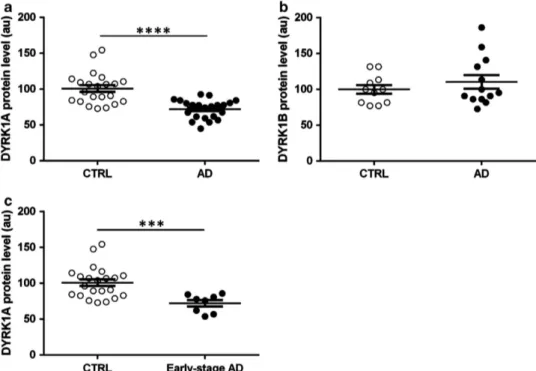
Using the same method as in mouse, we detected DYRK1A in human plasma. Mean relative DYRK1A expression was significantly lower in AD patients as compared with controls (Po0.0001; Figure 2a). As a control, we assessed expression of DYRK1B (or MIRK), a member of the same kinase family as DYRK1A, which presents a different pattern of expression and is expressed at low levels in the brain.19This protein has been detected previously in plasma (plasma protein database). Plasma samples from a subgroup of CTRL and AD patients were analysed with the same slot blot method. Relative DYRK1B expression was similar between groups (Figure 2b). Further, in the subgroup of patients with early AD (CDR = 0.5), the same decrease in DYRK1A expression was found (Figure 2c). When we compared DYRK1A levels between AD patients and controls for whom PiB-PET imaging was available (n = 17 AD patients with positive amyloid imaging and n = 13 controls with negative amyloid imaging), we observed similar results (Figure 3a). No difference was found in plasma DYRK1A levels in AD patients at an early stage (CDR = 0.5) and AD patients at a dementia stage (CDR⩾ 1). DYRK1A protein levels were not correlated with the Mini-Mental State Exam scores.
The results were the same when stratifying by gender, therefore results for both sexes are presented jointly.
Correlations between DYRK1A plasma levels and both CSF biomarkers and PiB-PET in AD patients
When we analysed the correlations between plasma DYRK1A and CSF biomarkers in the AD group, we found positive correlations with both p-tau protein (P = 0.02, r = 0.53), and total tau (P = 0.05, r = 0.45), but no correlation with Aβ42 levels (P = 0.06, r = 0.51; Figures 4a–c). No correlation was found between PiB cortical index and DYRK1A levels.
Stratification by APOE genotype
The mean DYRK1A level in individuals (CTRL and AD) with the APOE4 allele was significantly lower than that of individuals with either the APOE2 or APOE3 genotype (P = 0.03; Figure 3b). The level of DYRK1A in AD individuals with an ApoE4 genotype is very significantly decreased in comparison with controls (Po0.0001). Interestingly, the level of DYRK1A in individuals with AD who did not have the APOE4 allele was also significantly lower than that of controls (P = 0.01).
DYRK1A expression in LCLs from AD patients
Lymphoblastoid cell lines established from lymphocytes of AD patients and controls were grown in standard medium. They were used to isolate proteins for quantification of DYRK1A by slot blot. Relative DYRK1A expression in LCLs was significantly lower in AD than in controls (Po0.05; Figure 5).
DISCUSSION
This study aimed to determine whether DYRK1A, a brain kinase involved in AD pathology, may be a plasma biomarker for the diagnosis of AD. First, we developed a method to quantify plasma DYRK1A by immunoblot in transgenic mouse models having different gene dosage of Dyrk1a, and, consequently, different relative protein expression. DYRK1A was detected in brain mouse and plasma samples. Levels of DYRK1A correlated with the gene copy number, demonstrating that the highly specific monoclonal antibody was able to detect changes in expression of DYRK1A in plasma due to altered gene copy number in transgenic mice.
Using immunoblotting, we assessed the potential of plasma DYRK1A level to differentiate AD patients from controls. We applied strict inclusion criteria for AD based on both neuropsy-chological deficits and biological evidence of AD underlying pathophysiology, including typical AD CSF biomarker profiles and positive amyloid 11C-PiB-PET imaging. In addition, all controls who underwent PiB-PET (13/25) had no cortical amyloid retention, thus excluding presymptomatic AD.
Figure 2. DYRK1 protein levels in plasma from control (CTRL) individuals and Alzheimer’s disease (AD) patients. Slot-blotting was used to detect relative expression of (a) DYRK1A in CTRL and AD; (b) DYRK1B in CTRL and AD; (c) DYRK1A in CTRL and early-stage AD. White dots: controls; black dots: AD patients. Graph bars indicate mean± s.e.m; ****Po0.0001; ***Po0.001; a.u., arbitrary unit.
DYRK1A a novel plasma biomarker for AD N Janel et al
4
We found that DYRK1A was expressed at significantly lower levels in plasma from AD patients compared with controls. DYRK1A levels were 23% lower in AD patients, with few samples overlapping the mean for the control group. Three ranges of relative DYRK1A expression were detected among all samples: high (150 to 100 arbitrary units), corresponding to controls only; intermediate (100 to 75), with controls and AD patients; and low (o75), with no controls. In contrast, levels of DYRK1B were not significantly different in AD and controls.
The DYRK family consists offive mammalian subtypes including 1A, 1B, 2, 3 and 4, of which only the gene encoding DYRK1A is located on human chromosome 21, as is the gene encoding amyloid precursor protein. DYRK1A has been shown to be expressed ubiquitously, but is abundant in the cerebellum, olfactory bulb and hippocampus.5 Increased activity of DYRK1A has been reported in various brain compartments in individuals with Down syndrome and neurodegenerative diseases including AD. In particular, the percentage of DYRK1A-positive nuclei in the
frontal cortex of AD brains is about 10% compared with 0.5% in normal brains.20 Evidence is accumulating to suggest that the
activity of DYRK1A is involved in regulating a multitude of cellular pathways, especially by phosphorylation of a variety of proteins. DYRK1A-mediated tau phosphorylation has also been shown to promote further tau phosphorylation at multiple sites by GSK3β, which increases the accumulation of DYRK1A-positive neuro fibril-lary tangles.8 In addition, overactivity of DYRK1A has also been implicated in increased proteolytic cleavage of amyloid precursor protein, contributing to increased production of neurotoxic Aβ peptides.21These combined observations implicate DYRK1A in the generation of both amyloid and tau pathologies associated with Down syndrome and AD. However, the specificity of DYRK1A in vivo remains poorly defined.
We demonstrate here, for the first time, that DYRK1A can be detected in human plasma and that the plasma levels of DYRK1A expression may distinguish between AD patients and controls. Interestingly, we observed the same amplitude of decrease in the
Figure 3. DYRK1A protein levels stratified (a) according to PIB values with PIBo1.4 and PIB41.4; and (b) according to APOE genotype with ‘no ApoE4’ for APOE2 or APOE3 genotypes and ‘ApoE4’ for one or two APOE4 alleles. White dots: controls; black dots: Alzheimer's disease patients. Graph bars indicate mean± s.e.m; ***Po0.001; **Po0.01; a.u., arbitrary unit; PIB, Pittsburgh compound B.
Figure 4. Correlation analysis between level of CSF markers and DYRK1A level. (a) Aβ42 level and DYRK1A level; (b) tau level and DYRK1A level; (c) p-tau level and DYRK1A level. Correlation was assessed with nonparametric Spearman's rank correlation test. Graphs show regression lines with a 95% confidence interval; a.u., arbitrary unit; CSF, cerebrospinal fluid; p-tau, phosphorylated tau.
DYRK1A a novel plasma biomarker for AD N Janel et al
subgroup of very mild AD patients (CDR = 0.5), suggesting that DYRK1A could be useful to detect AD even at an early stage. Furthermore, the results were similar when we restricted the comparison between AD patients and ‘true’ controls defined by negative amyloid imaging.
In the DYRK family, DYRK1B, which is closely related to DYRK1A, is highly expressed in the testis and skeletal muscle and mediates muscle differentiation,22cell survival and cell migration. Contrary to DYRK1A, DYRK1B is not known to be involved in AD pathology. DYRK1B was previously detected in human plasma.23 We have therefore compared DYRK1B in AD patients and controls. In accordance with our hypothesis, we found no difference between both groups.
We analysed the correlations between plasma DYRK1A and other pathophysiological markers of AD. We observed a positive correlation with CSF tau and p-tau measures. These results agree with previous reports from cellular models and mouse models, in which increased expression of DYRK1A induces increased expres-sion of tau and p-tau proteins.8,24 On the other hand, DYRK1A
protein levels were not correlated with CSF amyloid peptide and cortical amyloid load assessed by PiB-PET. These results suggest that lower expression of DYRK1A in plasma of AD patients may reflect the impact of tau pathology more than amyloid pathology in AD.
Another pathophysiological hypothesis is based on the role of DYRK1A in inflammation. We showed recently that decreased DYRK1A induces diabetes with a decreased pancreatic beta cell mass.25 We also previously demonstrated in another peripheral organ, liver, that decreased DYRK1A induces NF-kappaB activation and increased inflammation.26 In contrast, increased DYRK1A is associated with increased NRF2 and decreased NF-kappaB activation.27Gene therapy delivering an adeno-DYRK1A construct in liver rescued a normal level of homocysteine and of APO-AI,28 which is a regulator of inflammation. Brain inflammation seems to be present also at early stages of AD: microglia activation is observed in the dentate gyrus as early as the MCI stage.29
Therefore, decreased levels of plasma DYRK1A in AD patients might contribute to increased inflammation related to amyloid accumulation, maybe at a preclinical stage of the disease when cortical amyloid deposition progressed.
Lymphoblastoid cell lines are used often to investigate genetic mechanisms. To begin to dissect a potential genetic contribution of DYRK1A to AD pathology, we derived LCLs from individuals with AD and control individuals. Relative DYRK1A expression was lower in LCLs from AD patients than in those from controls, and with the same order of magnitude as observed in plasma. These immortalized cells, which are grown in cell culture medium, have no direct relations with the tissues or cells producing DYRK1A in plasma. Although it is too early to differentiate between a genetic or epigenetic mechanism, these results together with the observation that DYRK1A levels vary among the population,12 suggest that DYRK1A decrease might be a novel risk factor for AD.
Taken together, our results suggest that decreased expression of DYRK1A in plasma may serve as a potential biomarker for AD even at the MCI stage. Further studies on larger cohorts may help establish the utility of DYRK1A plasma concentration as a new risk factor, alone or in combination with other markers for the diagnosis of AD. The predictive power of this factor will need further experiments with larger cohorts to be established. CONFLICT OF INTEREST
The authors declare no conflict of interest.
ACKNOWLEDGMENTS
We thank the HAP Salpetrière lymphoblastoid cell bank, Dr Foudil Lamari for the analysis of CSF biomarkers. We are greatly indebted to the chemical/radio-pharmaceutical and nursing staff of Service Hospitalier Frederic Joliot, CEA, Orsay, for the synthesis of the 11C-PIB and patient management, respectively.
AUTHOR CONTRIBUTIONS
MS designed the clinical experiments. MS, NJ and JMD supervised the project, found the funding and wrote the paper conjointly with MCP.
REFERENCES
1 Corbett A, Pickett J, Burns A, Corcoran J, Dunnett SB, Edison P et al. Drug repo-sitioning for Alzheimer's disease. Nat Rev Drug Discov 2012;11: 833–846. 2 Jack CR Jr, Albert MS, Knopman DS, McKhann GM, Sperling RA, Carrillo MC et al.
Introduction to the recommendations from the National Institute on Aging-Alz-heimer's Association workgroups on diagnostic guidelines for AlzAging-Alz-heimer's disease. Alzheimers Dement 2011;7: 257–262.
3 Hansson O, Zetterberg H, Buchhave P, Londos E, Blennow K, Minthon L. Asso-ciation between CSF biomarkers and incipient Alzheimer's disease in patients with mild cognitive impairment: a follow-up study. Lancet Neurol 2006; 5: 228–234.
4 Ballard C, Gauthier S, Corbett A, Brayne C, Aarsland D, Jones E. Alzheimer's dis-ease. Lancet 2011;377: 1019–1031.
5 Smith B, Medda F, Gokhale V, Dunckley T, Hulme C. Recent advances in the design, synthesis, and biological evaluation of selective DYRK1A inhibitors: a new avenue for a disease modifying treatment of Alzheimer's? ACS Chem Neurosci 2012;3: 857–872.
6 Woods YL, Cohen P, Becker W, Jakes R, Goedert M, Wang X et al. The kinase DYRK phosphorylates protein-synthesis initiation factor eIF2Bepsilon at Ser539 and the microtubule-associated protein tau at Thr212: potential role for DYRK as a gly-cogen synthase kinase 3-priming kinase. Biochem J 2001;355: 609–615. 7 Sheppard O, Plattner F, Rubin A, Slender A, Linehan JM, Brandner S et al. Altered
regulation of tau phosphorylation in a mouse model of down syndrome aging. Neurobiol Aging 2012;33: 828.e31–828.e44.
8 Liu F, Liang Z, Wegiel J, Hwang YW, Iqbal K, Grundke-Iqbal I et al. Overexpression of Dyrk1A contributes to neurofibrillary degeneration in Down syndrome. FASEB J 2008;22: 3224–3233.
9 Kimura R, Kamino K, Yamamoto M, Nuripa A, Kida T, Kazui H et al. The DYRK1A gene, encoded in chromosome 21 Down syndrome critical region, bridges between beta-amyloid production and tau phosphorylation in Alzheimer disease. Hum Mol Genet 2007;16: 15–23.
10 Korenberg JR, Aaltonen J, Brahe C, Cabin D, Creau N, Delabar JM et al. Report and abstracts of the Sixth International Workshop on Human Chromosome 21 Map-ping 1996. Cold Spring Harbor, New York, USA. May 6-8,1996. Cytogenet Cell Genet 1997;79: 21–52.
11 Guedj F, Pereira PL, Najas S, Barallobre MJ, Chabert C, Souchet B et al. DYRK1A: a master regulatory protein controlling brain growth. Neurobiol Dis 2012; 46: 190–203.
12 Tlili A, Hoischen A, Ripoll C, Benabou E, Badel A, Ronan A et al. BDNF and DYRK1A are variable and inversely correlated in lymphoblastoid cell lines from Down syndrome patients. Mol Neurobiol 2012;46: 297–303.
13 Jenne DE, Lowin B, Peitsch MC, Bottcher A, Schmitz G, Tschopp J. Clusterin (complement lysis inhibitor) forms a high density lipoprotein complex with apolipoprotein A-I in human plasma. J Biol Chem 1991;266: 11030–11036. 14 Fotaki V, Dierssen M, Alcantara S, Martinez S, Marti E, Casas C et al. Dyrk1A
haploinsufficiency affects viability and causes developmental delay and abnormal brain morphology in mice. Mol Cell Biol 2002;22: 6636–6647.
Figure 5. Relative DYRK1A protein levels in LCLs from control (CTRL) and Alzheimer’s disease (AD) patients. White dots: controls; black dots, AD patients. Graph bars indicate mean± s.e.m.; *Po0.05.
DYRK1A a novel plasma biomarker for AD N Janel et al
6
15 Sarazin M, Berr C, De Rotrou J, Fabrigoule C, Pasquier F, Legrain S et al. Amnestic syndrome of the medial temporal type identifies prodromal AD: a longitudinal study. Neurology 2007;69: 1859–1867.
16 Visser PJ, Verhey F, Knol DL, Scheltens P, Wahlund LO, Freund-Levi Y et al. Prevalence and prognostic value of CSF markers of Alzheimer's disease pathology in patients with subjective cognitive impairment or mild cognitive impairment in the DESCRIPA study: a prospective cohort study. Lancet Neurol 2009; 8: 619–627.
17 de Souza LC, Corlier F, Habert MO, Uspenskaya O, Maroy R, Lamari F et al. Similar amyloid-beta burden in posterior cortical atrophy and Alzheimer's disease. Brain 2011;134: 2036–2043.
18 de Souza LC, Lamari F, Belliard S, Jardel C, Houillier C, De Paz R et al. Cerebrospinal fluid biomarkers in the differential diagnosis of Alzheimer's disease from other cortical dementias. J Neurol Neurosurg Psychiatry 2011;82: 240–246.
19 Deng X, Ewton DZ, Pawlikowski B, Maimone M, Friedman E. Mirk/dyrk1B is a Rho-induced kinase active in skeletal muscle differentiation. J Biol Chem 2003;278: 41347–41354.
20 Ferrer I, Barrachina M, Puig B, Martinez de Lagran M, Marti E, Avila J et al. Constitutive Dyrk1A is abnormally expressed in Alzheimer disease, Down syn-drome, Pick disease, and related transgenic models. Neurobiol Dis 2005;20: 392–400.
21 Ryoo SR, Cho HJ, Lee HW, Jeong HK, Radnaabazar C, Kim YS et al. Dual-specificity tyrosine(Y)-phosphorylation regulated kinase 1A-mediated phosphorylation of amyloid precursor protein: evidence for a functional link between Down syn-drome and Alzheimer's disease. J Neurochem 2008;104: 1333–1344.
22 Friedman E. Mirk/Dyrk1B in cancer. J Cell Biochem 2007;102: 274–279. 23 Liu X, Valentine SJ, Plasencia MD, Trimpin S, Naylor S, Clemmer DE. Mapping the
human plasma proteome by SCX-LC-IMS-MS. J Am Soc Mass Spectrom 2007;18: 1249–1264.
24 Qian W, Jin N, Shi J, Yin X, Jin X, Wang S et al. Dual-specificity tyrosine phosphorylation-regulated kinase 1A (Dyrk1A) enhances tau expression. J Alz-heimers Dis 2013;37: 529–538.
25 Rachdi L, Kariyawasam D, Guez F, Aiello V, Arbones ML, Janel N et al. Dyrk1a haploinsufficiency induces diabetes in mice through decreased pancreatic beta cell mass. Diabetologia 2014;57: 960–969.
26 Hamelet J, Couty JP, Crain AM, Noll C, Postic C, Paul JL et al. Calpain activation is required for homocysteine-mediated hepatic degradation of inhibitor I kappa B alpha. Mol Genet Metab 2009;97: 114–120.
27 Noll C, Tlili A, Ripoll C, Mallet L, Paul JL, Delabar JM et al. Dyrk1a activates anti-oxidant NQO1 expression through an ERK1/2-Nrf2 dependent mechanism. Mol Genet Metab 2012;105: 484–488.
28 Tlili A, Jacobs F, Koning LD, Mohamed S, Bui LC, Dairou J et al. Hepatocyte-specific Dyrk1a gene transfer rescues plasma apolipoprotein A-I levels and aortic Akt/ GSK3 pathways in hyperhomocysteinemic mice. Biochim Biophys Acta 2013;1832: 718–728.
29 Xiang Z, Haroutunian V, Ho L, Purohit D, Pasinetti GM. Microglia activation in the brain as inflammatory biomarker of Alzheimer's disease neuropathology and clinical dementia. Dis Markers 2006;22: 95–102.
This work is licensed under a Creative Commons Attribution-NonCommercial-NoDerivs 3.0 Unported License. The images or other third party material in this article are included in the article’s Creative Commons license, unless indicated otherwise in the credit line; if the material is not included under the Creative Commons license, users will need to obtain permission from the license holder to reproduce the material. To view a copy of this license, visit http://creativecommons.org/licenses/by-nc-nd/3.0/
DYRK1A a novel plasma biomarker for AD N Janel et al