HAL Id: halshs-00931541
https://halshs.archives-ouvertes.fr/halshs-00931541
Submitted on 15 Jan 2014HAL is a multi-disciplinary open access archive for the deposit and dissemination of sci-entific research documents, whether they are pub-lished or not. The documents may come from teaching and research institutions in France or abroad, or from public or private research centers.
L’archive ouverte pluridisciplinaire HAL, est destinée au dépôt et à la diffusion de documents scientifiques de niveau recherche, publiés ou non, émanant des établissements d’enseignement et de recherche français ou étrangers, des laboratoires publics ou privés.
Regional Learning Dynamics and Systems of Education
and Training
Edward Lorenz
To cite this version:
Edward Lorenz. Regional Learning Dynamics and Systems of Education and Training. Journal of the Knowledge Economy, Springer, 2011, 2 (4), pp.481-506. �halshs-00931541�
Regional Learning Dynamics and Systems of Education and Training:
A European Comparison
Edward Lorenz1
edward.lorenz@gredegt.cnrs.fr
Abstract
This paper investigates regional differences in the relation between styles of employee learning within public and private sector establishments and the characteristics of regional education and training systems. The paper starts by developing a measure of creativity at work for a sample of 81 regions across 18 European nations. Using multi-level regression, the paper shows how differences in the level of development of a region‟s tertiary education system, and differences in the provision of formal and informal types of lifelong learning, impact on the development of creative forms of learning at work. The results show not only that well-developed regional systems of lifelong learning have a positive impact on the likelihood that employees on average will be involved in creative forms of work organisation, but also that systems of lifelong learning increase the relative chances that employees with only a secondary-level education will have access to creative work environments. This implies lifelong that learning policies can serve an important remedial purpose by helping to reduce inequalities in access to high quality work environments for employees with different levels of initial education.
Keywords: regional innovation system; creativity; systems of education and training; multi-level analysis
Regional Learning Dynamics and Systems of Education and Training:
A European Comparison
2Edward Lorenz University of Nice – CNRS
1. Introduction
The importance of systems of education and training for the innovative performance of regionally clustered enterprises has been a key theme in the literature of regional innovative systems (RIS). The early work on regional innovative systems (Asheim, 1996; Cooke, 1992; Cooke et al. 1998) drew inspiration from seminal contributions to the research on national innovation systems, in particular work by Freeman (1987) and Lundvall (1992). A central idea was that of two subsystems engaged in processes of interactive learning, one composed of private enterprises, often tightly clustered, and the other composed of the regional supportive infrastructure, composed of a variety of organisations responsible for processes of knowledge generation and transmission, including public research institutions, universities, and vocational training providers.
A central issue addressed in this literature has been the relation between geographic distance and knowledge transmission. One strand of literature has focused on the role of knowledge spillovers in the performance of high technology sectors. It has provided evidence that the formal R&D activities of private-sector enterprises benefit from their location in regions that are well endowed with university research or other public sector research institutions. Proximity favours the transfer scientific and technical knowledge both though the recruitment of university-trained scientists and through formal R&D collaboration (Jaffe, 1989; Acs, et al. 1999; Link and Rees, 1990) At the same time, there has been an appreciation that the knowledge upon which the innovative performance of regionally clustered enterprises depends is not solely the result of formal R&D activity, but also the result of informal processes of learning by doing and learning by interacting (Lawson and Lorenz 1999; Lundvall and Johnson, 1995; Maskell, 1998; Storper and Scott, 1995). This emphasis on informal experience-based learning in turn has generated an interest in the regional foundations for the
2 Forthcoming in the Journal of the Knowledge Economy. A preliminary version of this paper was presented at The
5th International Seminar on Regional Innovation Policies 14-15 October 2010, Grimstad, Norway. I would like to thank the participants for their useful comments. The paper also benefited from the comments of one anonymous referee.
development of „learning organizations‟, with a focus on the way the regional institutional structure can support processes of interactive learning within the firm (Asheim, 2011; Asheim and Coenen, 2006; Qvale, 2011).
This paper contributes to this research agenda by drawing on survey data in order investigate the links between styles of employee learning, the innovative performance of enterprises and the characteristics of regional education and training systems. One of the central contributions of the paper is to develop a measure of creative employee learning on the job and to compare differences in its frequency across a sample of 81 regions in 18 European nations. Using this measure, a multi-level regression analysis is undertaken in order to explore the relation between differences in the development of regional education and training systems and the characteristics of employee learning on the job. The analysis addresses the issue of how differences in the level of development of the region‟s tertiary education system, and differences in the provision of various forms of formal and informal lifelong learning, impact on the development of creative forms of learning at work at the regional level. By exploring the links between regional context conditions and individual-level characteristics and behaviour, the paper addresses important policy issues, such as whether robust systems of further education and lifelong learning can compensate for relatively low levels of initial formal education in promoting dynamic learning at the workplace.
.
The paper builds on a methodology for addressing these issues at the national level, as developed in a series of co-authored papers. In Lorenz and Valeyre (2005) the basic methodology for developing a taxonomy of forms of work organisation and employee learning for the EU-15 is developed. Arundel et al. (2007) build on this analysis and presents evidence for the EU-15 showing that in nations where work is organised to support high levels of discretion in solving complex problems firms tend to be more active in terms of innovations developed, at least to some degree, through their creative in house efforts. In countries where learning and problem-solving on the job are more constrained, and little discretion is left to the employee, firms tend to engage in a supplier-dominated innovation strategy. Their technological renewal depends more on the absorption of innovations developed elsewhere.
In Holm et al. (2010) the framework is extended through the use of multi-level regression analysis to explore the relation between forms of work organisation and institutional context for the EU-27 and Norway. The results point to systemic relations between differences in labour
market mobility and regulation on the one hand, and the adoption of different forms work organisation on the other. National systems combing high levels of labour market mobility with high levels of expenditure on both unemployment protection and active labour market policies designed to move the unemployed into employment are associated with the adoption of forms of work organisation characterised by high levels of autonomy and learning on the job.
This paper builds on the approach developed in these papers in order to explore the relation between employee learning, innovation performance and systems of education and training at the regional level using the regional breakdown of data according to the European Union‟s NUTS nomenclature available in Fourth European Survey on Working Conditions (EWCS) carried out in 2005. The paper is structured in the following way. Section 2 describes the employee-level measures derived from the results of the 2005 EWCS that are used to characterise different forms of employee learning at the regional level, and presents differences across nations and regions. Certain limitations of the employee-level data entail limiting the analysis to 81 regions in 18 European nations. Section 3 examines the relation between the frequency of the different forms of learning and measures of enterprise innovative performance at both the national and regional levels. Section 4 presents the results of a multi-level regression analysis used to explore the impact of the development of the regional education and training system on the likelihood of the different forms of learning. Section 5 concludes by drawing out some of the policy implications.
2. Measuring employee learning dynamics
Although the 2005 EWCS was carried out in Norway and all 27 EU member nations, due to limitations with the data the analysis here is limited to the regions of 18 European nations. Firstly, eight of the 27 EU member nations have been excluded from the study for the simple reason that a NUTS breakdown of their regions is not available, or was not available in 2005. These include Cyprus, Denmark, Estonia, Lithuania, Luxembourg, Latvia, Malta and Slovenia. Second, the EWCS was designed to conduct national-level comparisons and while the sampling design involved stratification according to region and urbanisation level and the sample is representative of persons in employment,3 the size of the sample is relatively small, with
3 The sampling design had the following stages: stratification of primary sampling units (PSUs) according to
region and urbanisation level; random selection of starting addresses within each PSU; and a „random walk‟ procedure for the selection of the household. For details, see Parent-Thirion, et.al., 2007, p. 94.
approximately 1000 observations per nation. The small sample size has entailed excluding two of the more populous nations from the study, the UK and Germany, since their administrative breakdown into 12 and 16 regions at the NUTS-1 level respectively means that even at this level the number of observations per region is in many cases too small to make reliable point estimates.
For the majority of the remaining 18 nations included in the study, the small sample size has dictated carrying out the analysis at the NUT-1 level in order to be assured of having a sufficient number of observations per region for making reliable estimates. The exceptions to this are the Czech Republic, Slovakia, Finland, Ireland, Norway and Portugal, countries with relatively small populations, where the NUTS-1 level corresponds to the entire nation. For these six countries the analysis is done at the NUT-2 level.4 The resulting sample on which the analysis is based is 81 regions located in 18 nations.5
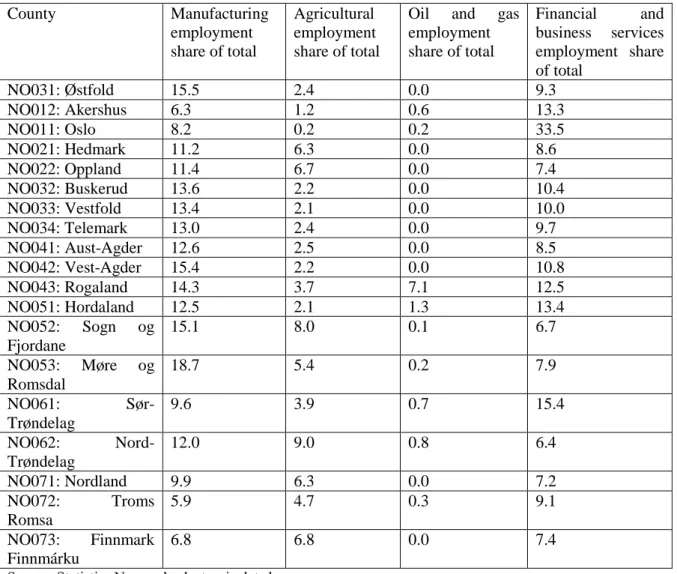
According to Eurostat, while different criteria may be used in subdividing national territory into regions, for practical reasons to do with data availability and the implementation of regional policies, the NUTS nomenclature is based primarily on the institutional divisions currently in force in the Member States. Be this as it may, it is clear that even at the NUTS-2 level one can find considerable intra-regional heterogeneity in terms of structural characteristics. This can be illustrated by considering the case of Norway. Table 2 presents figures on the distribution of employment by broad industrial sector at the county or NUT-3 level. The figures point to significant differences in industrial structure within the Agder-Rogaland region and in particular to the importance of oil and gas production in Rogaland. More generally, intra-regional differences at the NUTS-2 can be observed elsewhere in Norway. For example in the Vestlandet region manufacturing employment in relatively important in Møre og Romsdal, and in the Trøndelag region business services are relatively important in Sør-Trøndelag. The impact
4
The Acores and Madeira islands of Portugal, each classified as separate NUT2 regions, have been excluded due to the number of observations being too small for reliable estimates.
5 In order to enhance the representativeness of the results of the EWCS three types of weights are applied: a
selection probability weighting which corrects for the tendency of the „random walk‟ to give greater probability of selection to individuals in smaller households; a post-stratification weight which adjusts the results of the survey to the results of the Labour Force Survey for the variables sex, age, region, occupation and sectors; and a cross-regional weighting which adjust for the proportion that each region represents in the total employed population for the 81 regions. The cross-regional weighting is used for the regional estimates of forms of employee learning presented in Table 7 and in Table A in the Appendix. For the aggregate frequencies presented in Tables 2 – 6 cross national weightings are used.
of such intra-regional differences in industrial structure at the NUTS-2 level is necessarily glossed over in the analysis of work organisation and learning that follows.
Table 1: Structural Indicators: Norway 2007
County Manufacturing employment share of total Agricultural employment share of total
Oil and gas employment share of total Financial and business services employment share of total NO031: Østfold 15.5 2.4 0.0 9.3 NO012: Akershus 6.3 1.2 0.6 13.3 NO011: Oslo 8.2 0.2 0.2 33.5 NO021: Hedmark 11.2 6.3 0.0 8.6 NO022: Oppland 11.4 6.7 0.0 7.4 NO032: Buskerud 13.6 2.2 0.0 10.4 NO033: Vestfold 13.4 2.1 0.0 10.0 NO034: Telemark 13.0 2.4 0.0 9.7 NO041: Aust-Agder 12.6 2.5 0.0 8.5 NO042: Vest-Agder 15.4 2.2 0.0 10.8 NO043: Rogaland 14.3 3.7 7.1 12.5 NO051: Hordaland 12.5 2.1 1.3 13.4 NO052: Sogn og Fjordane 15.1 8.0 0.1 6.7 NO053: Møre og Romsdal 18.7 5.4 0.2 7.9 NO061: Sør-Trøndelag 9.6 3.9 0.7 15.4 NO062: Nord-Trøndelag 12.0 9.0 0.8 6.4 NO071: Nordland 9.9 6.3 0.0 7.2 NO072: Troms Romsa 5.9 4.7 0.3 9.1 NO073: Finnmark Finnmárku 6.8 6.8 0.0 7.4
Source: Statistics Norway‟s electronic data base
2.1 Learning at the national and regional levels
The analysis in Lorenz and (2005) drew on a part of the entire sample of the EWCS and was restricted to salaried employees working in private sector establishments employing 10 or more persons. To restrict the population studied in this manner for the analysis of regions would aggravate the problems linked to the small size of the sample I discussed above, and the analysis presented here is based on the responses of all salaried employees including those working in establishments employing less that 10 employees in both the private and public sector establishments. This in turn implied making some changes to the choice of variables used in Lorenz and Valeyre (2005) to identify different forms of work organisation, since
indicators of the use of job rotation schemes or the use of autonomous team organisation have little or no relevance to micro-enterprises. The seven indicators used in the analysis are presented in Table 2 below. The variables were chosen to capture differences in the importance of creative learning and problem-solving activity at work.
Table 2: Variables for types of learning Percent of salaried employees affected
Problem solving activities 81.0
Learning new things in work 69.1
Using one‟s own ideas in work 58.2
Undertaking complex tasks 55.5
Discretion in fixing work methods 64.5
Discretion in setting work pace 68.6
Repetitiveness of tasks 36.9
N 17,412
Source: Fourth Working Conditions survey, European Foundation for the Improvement of Living and Working Conditions
Based on a factor analysis and cluster analysis, three distinct groups are identified corresponding to different styles or forms of learning within establishments. Table 3 presents the results, showing the percent of the persons grouped in each cluster that are characterised by each of the seven work organisations features. The first cluster, which I refer to as the “creative learning” group, is characterised by relatively high level of learning, use of one‟s own ideas, problem-solving and discretion in work. Complexity is above the population average while repetitiveness is below average. This cluster accounts for 54.2 percent of the total population. The second cluster, accounting for 22.9 percent of the total population, is referred to as the “constrained learning” group since while learning and problem-solving are as high, or almost as high, as in the first cluster, employees exercise below average levels of discretion and they make very little use of their own ideas. As in Lorenz and Valeyre (2005), this points to two different forms of learning at work, one in which the employee enjoys considerable autonomy and scope for exploring novel solutions to problems encountered, and one in which learning is relatively constrained and monitored. The third cluster is a “low learning” cluster and presumably groups both taylorised forms of work organisation and traditional forms of work organisation found especially in smaller establishments. It accounts for 23.9 percent of the population.
Table 3: Learning Clusters: 18 European Nations (percent of salaried employees by learning cluster)
Variable
Creative learning
Constrained learning
Low learning Average
Problem solving activities 95.5 88.6 40.5 81.0
Learning new things in work 85.4 86.8 15.2 69.1
Complexity of tasks 68.2 76.9 5.9 58.2
Using one‟s own ideas 81.3 35.9 26.1 55.5
Discretion in fixing work methods
96.3 19.9 33.5 64.5
Discretion in setting work rate 95.0 30.1 44.4 68.6
Repetitiveness of tasks 30.5 50.0 39.3 36.9
Total share of employees 54.2 22.9 23.9 100.0
Source: Fourth Working Conditions survey, European Foundation for the Improvement of Living and Working Conditions
Table 4 presents a breakdown of the different forms of learning by broad industrial sector. The creative learning forms are overrepresented in business and financial services, in pubic administration, in education and health and in personal and community services. They are under-represented in manufacturing and in related and other services. Interestingly, agriculture, forestry and fishing, while accounting for a very small share of the total population, appear to be a relatively learning intensive sector. The constrained learning forms are over-represented in manufacturing, construction and utilities, while the low learning forms are most frequent in retail and other services.
Table 5 gives the occupational breakdown. As expected, the creative learning forms are relatively high for managers, senior officials, professionals and technicians. They are at about average levels for clerks and the craft trades, and they are underrepresented amongst those occupied in sales and service jobs, plant and machine operator jobs and elementary jobs. Thez constrained learning forms are relatively present amongst machine operators and the skilled trades, while the low learning forms are overrepresented amongst machine operators and the elementary occupations.
Table 4: Types of Learning by Sector of Activity: 18 European nations
Source: Fourth Working Condition survey. European Foundation for the Improvement of Living and Working Conditions
Table 5: Types of Learning by Occupation: 18 European nations Percent of salaried employees by occupation and type
of learning Creative learning Constrained learning Low learning Total
Managers and senior officials 75.7 12.3 12.0 100
Professionals 76.5 16.1 7.4 100
Technicians 64.7 25.2 10.1 100
Clerks 51.0 25.4 23.6 100
Sales and service 51.3 22.3 25.4 100
Craft and related trades 50.7 24.2 25.1 100
Plant and machine operators 28.0 28.9 43.1 100
Elementary occupations 34.8 21.4 43.8 100
Average 54.2 22.9 23.9 100
Source: Fourth Working Condition survey. European Foundation for the Improvement of Living and Working Conditions
Percent of salaried employees by sector of activity and type of learning
Creative learning Constrained learning Low learning Total
Agriculture, forestry, fishing 61.0 12.2 26.8 100
Manufacturing, construction and utilities
46.0 27.0 27.0 100
Retail and other services 48.5 21.9 39.6 100
Business and financial services 65.1 19.6 15.3 100 Public administration, education,
and health and social work
62.8 21.9 15.3 100
Community, social and personal services
59.7 17.8 22.5 100
Table 6 presents the breakdown for nations. The figures show that the creative learning forms are most widely adopted in the Scandinavian nations, the Netherlands, Belgium and Italy, while and the constrained learning forms are most present in Czech Republic, Bulgaria, Austria and Finland. The low learning forms tend to be more frequent in the southern and new member nations and they are most present in Spain, Bulgaria and Romania.
Table 6: Differences between countries in types of learning: 2005
(percent of salaried employees by learning cluster)
Creative learning Constrained learning
Low learning Total
Belgium 62.12 18.05 19.84 100 Czech Republic 43.59 30.24 26.16 100 Greece 48.14 23.79 28.07 100 Spain 40.32 24.67 35.01 100 France 58.22 21.58 20.20 100 Ireland 59.02 17.22 23.76 100 Italy 60.91 14.54 24.54 100 Hungary 57.67 20.69 21.64 100 Netherlands 64.50 24.24 11.26 100 Austria 54.36 28.09 17.55 100 Poland 50.69 24.54 24.77 100 Portugal 49.66 24.70 25.64 100 Slovakia 46.62 24.19 29.19 100 Finland 58.45 30.70 10.84 100 Sweden 71.08 21.52 7.40 100 Bulgaria 43.08 26.78 30.15 100 Romania 46.29 23.69 30.02 100 Norway 71.71 18.01 10.28 100 Average for 18 nations 54.2 22.9 23.9 100
Source: Fourth Working Condition survey. European Foundation for the Improvement of Living and Working Conditions
Table 7 identifies regions which rank high in terms of the importance of creative learning, constrained learning and low learning. Table A in the Appendix presents the frequencies of the forms of learning for all 81 regions. As regards regions with high levels of creative learning, what stands out is the dominance of the Scandinavian nations with all 3 of Sweden‟s NUT-1
regions figuring amongst the top 10 regions for the 18 European nations, and 5 of the7 NUTS-2 Norwegian regions figuring amongst the top 10. The Sud-Ouest of France stands out for its high frequency of creative learning in a nation where the level of creative learning overall is about average.
Table 7: Types of Learning by Region
Percent of salaried employees by region and type of learning Creative learning Constrained learning Low learning Total
10 regions with the highest frequency of creative learning
Trøndelag, Norway 75.05 22.66 2.29 100
Norra Sverige, Sweden 73.91 19 7.09 100
Oslo og Akershus, Norway 73.58 16.33 10.1 100
Vestlandet, Norway 73.55 17.24 9.21 100
Sud-Ouest, France 73.1 18.1 8.8 100
Agder og Rogaland, Norway 72.46 18.83 8.71 100
Nord-Norge, Norway 72.13 12.46 15.41 100
Östra Sverige, Sweden 72 22.13 5.86 100
Oost-Nederland, Netherlands 69.73 18.47 11.81 100
Södra Sverige, Sweden 69.45 22.49 8.06 100
10 regions with the highest frequency of constrained learning
Lisboa, Portugal 32.63 41.93 25.43 100
Jihozápad, Czech Republic 40.84 39.87 19.29 100
Alentejo, Portugal 32.54 39.79 27.67 100
Canarias, Spain 51.72 35.86 12.42 100
Praha, Czech republic 51.28 35.38 13.34 100
Ostösterreich, Austria 50.49 35.18 14.33 100
Severovýchod, Czech Republic 32.24 34.97 32.8 100
Sur, Spain 35.43 32.99 31.58 100
Itä Suomi, Finland 58.69 32.46 8.85 100
Pohjois-Suomi, Finland 55.91 32.43 11.66 100
10 regions with the highest frequency of low learning
Centro, Spain 29.98 20.2 49.83 100
Noroeste, Spain 44.6 13.7 41.71 100
Este, Spain 39.59 22.25 38.16 100
Macroregiunea doi, Romania 39 23.09 37.91 100
Norte, Portugal 41.55 23.72 34.73 100
StrednÌ Cechy, Czech Republic 38.49 26.83 34.68 100
Centralny, Poland 41.05 24.62 34.33 100
Macroregiunea trei, Romania 46.33 20.83 32.84 100
Severovýchod, Czech Republic 32.24 34.97 32.8 100
Severoz·pad, Czech Republic 39.77 27.69 32.54 100
Source: Fourth Working Condition survey. European Foundation for the Improvement of Living and Working Conditions
With respect to high levels of constrained learning, regions within the Czech Republic, Portugal, Spain and Finland account for most of the top 10. The Itä Suomi and Pohjois-Suomi regions in Finland stand out for combining above average levels of constrained learning with some of the lowest reported levels of low learning. Most of the regions with the highest frequencies of the low learning forms are located in Spain, Portugal, Romania and the Czech Republic.
3. Links between employee learning and innovation
In Arundel et al. (2007) we explored the relation between work organisation and innovation style at the national level using a typology of innovators at the firm level developed by Arundel and Hollanders (2005), in collaboration with Paul Crowley of Eurostat. Based on the results of the Third Community Innovation Survey (CIS-3) carried out in 2000/2001, the typology classifies all innovative respondent firms into three mutually exclusive innovation modes, according to the level of in-house creative effort. Although our data could only show correlations rather than causality, and were aggregated at the national level, they supported the view that how firms innovate is linked to the way work is organised to promote learning and problem-solving.
While this typology is not available for the Fifth Community Innovation Survey (CIS-5) carried out in 2006, the exercise can be repeated to a certain extent by using an indicator of the share of all enterprises that have innovated products (goods and services) that are not only new-to-the firm but also new-to-the market.6 Figures 1-3 present the correlations between our aggregate measures of the national frequency of learning forms for the 18 EU nations and the share of firms having introduced new-to-the market products. The results show a positive and statistically significant relation between the frequency of such innovators and the importance of the creative learning forms, and a clear negative relation between their frequency and the
6 The CIS estimates of the percentage of firms that have introduced products that are new-to-the firm is a very
broad measure of innovation ranging from intensive in-house R&D to develop a new-to-market products to minimal effort to market a new product developed by an outside firm or organisation. This broad all-encompassing definition of an innovative firm is both misleading in international comparisons and fails to provide a clear picture of the structure of innovation capabilities within individual countries. In order to more accurately differentiate nations in terms of firms‟ innovative capabilities, I focus here on the percentage of firms that have introduced products that are new-to-the market.
importance of the low learning forms. There is no discernable relation between the frequency of new-to-the market innovators and the importance of the constrained forms of learning.
Figures 1 – 3: Correlations between new-to-market product innovators and forms of learning at the national level: 18 European nations
AT BE BG CZ ES FI FR GR HU IE IT NL NO PL PT RO SE SK 5 10 15 20 25 % New t o m a rk e t p ro d u c t in n o v a to rs 40 50 60 70 % Creative learning R-squared = .28
% Creative learning by new to market innovators
AT BE BG CZ ES FI FR GR HU IE IT NL NO PL PT RO SE SK 5 10 15 20 25 % New t o m a rk e t p ro d u c t in n o v a to rs 15 20 25 30 % Constrained learners R-squared = .00
% Constrained learning by new to market innovators
AT BE BG CZ ES FI FR GR HU IE IT NL NO PL PT RO SE SK 5 10 15 20 25 % New t o m a rk e t p ro d u c t in n o v a to rs 0 10 20 30 40 % Low learning R-squared = .43
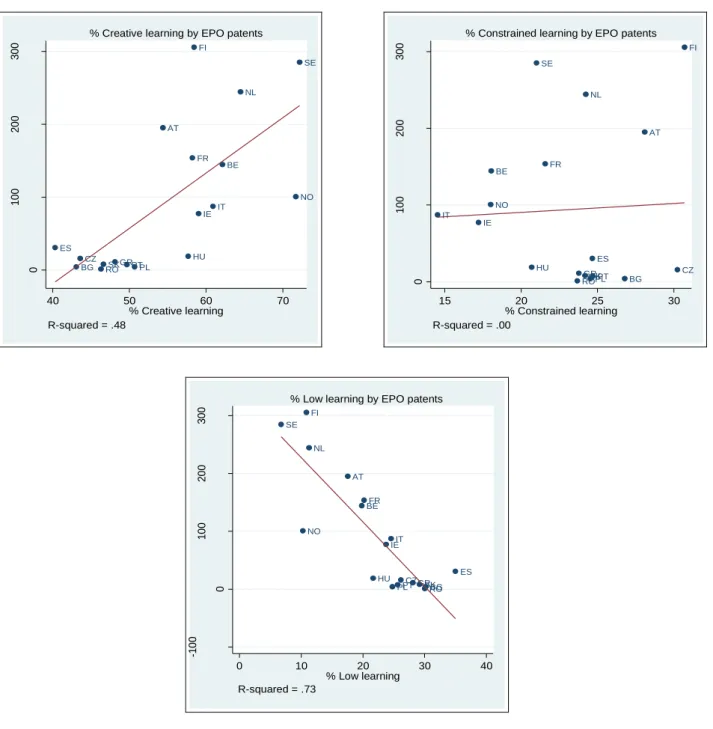
Figures 4 through 6 extend the exercise using another indicator of innovativeness, EPO patent applications per million inhabitants. An advantage in using patents as an indicator of innovation is that patents are granted for innovative technologies that both have commercial promise and that make a non-obvious advance in the state of the art.
Figure 4 – 6: Correlations between EOP patents per million inhabitants and forms of learning at the national level: 18 European nations
Well-know disadvantages of this measure are that not all innovations are patented and that the use of patenting varies across industrial sectors. While the correlations presented above do not
AT BE BG CZ ES FI FR GR HU IE IT NL NO PLPT RO SE SK 0 1 0 0 2 0 0 3 0 0 EP O p a te n ts p e r m ill io n p o p u la ti o n 15 20 25 30 % Constrained learning R-squared = .00
% Constrained learning by EPO patents
AT BE BG CZ ES FI FR GR HU IE IT NL NO PL PT RO SE SK 0 1 0 0 2 0 0 3 0 0 EO P p a te n ts p e r m ill io n p o p u la ti o n 40 50 60 70 % Creative learning R-squared = .48
% Creative learning by EPO patents
AT BE BG CZ ES FI FR GR HU IEIT NL NO PLPT RO SE SK -1 0 0 0 1 0 0 2 0 0 3 0 0 EP O p a te n ts p e r m ill io n p o p u la ti o n 0 10 20 30 40 % Low learning R-squared = .73
adjust for differences national industrial structure, they nonetheless provide further support for the view firms are more innovative in nations where work activity is characterised by high level of creativity.7
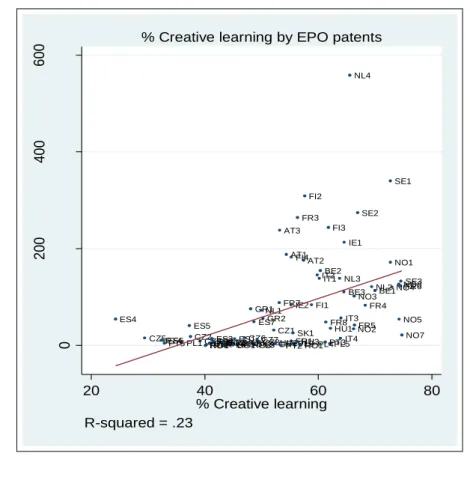
Unfortunately only the second part of this exercise can be repeated at the regional level, since a regional breakdown of CIS-5 data is not available. Using patent statistics a case can still be made for the relation between forms of learning and innovativeness at the regional level. The results presented in figures 7-9 show a positive and statistically significant relation between patenting at the regional level and the importance the creative forms of learning, and a negative and statistically significant relation between patenting and the importance of the low forms of learning. There is a very small negative and non-statistically significant relation between patenting and the constrained forms of learning. The Zuid region of the Netherlands, with an exceptionally high rate of patenting, stands out as an outlier.
Figure 7 - 9: Correlations between EOP patents per million inhabitants and forms of learning at the regional level: 81 regions I 18 European nations
7
There is a strong positive and statistically significant correlation of .73 between the frequency of new-to-market product innovations and the number of EPO patent applications per million population.
BE1 BE2 BE3 CZ1 CZ2CZ3 CZ4 CZ5 CZ6CZ7CZ8 GR1 GR2 GR3ES1 GR4 ES2 ES3 ES4 ES5 ES6 ES7 FR1 FR2 FR3 FR4 FR5 FR6 FR7 FR8 IE1 IE2 IT1 IT2 IT3 IT4 HU1 HU2 HU3 NL1 NL2 NL3 NL4 AT1 AT2 AT3 PL1 PT1PL6 PL3 PT2PL2PL4PL5PT3 PT4PT5 SK1 SK2 SK4SK3 FI1 FI2 FI3 FI4 SE1 SE2 SE3 BG1 BG2 RO1 RO2 RO3 RO4 NO1 NO2 NO3 NO4 NO5 NO6 NO7 0 200 400 600 E P O pat ent s per m ill ion popul at ion 20 40 60 80 % Creative learning R-squared = .23
BE1 BE2 BE3 CZ1 CZ2 CZ3 CZ4 CZ6 CZ7 CZ5 CZ8 GR1 GR2 GR3GR4
ES1 ES3 ES2
ES4 ES5 ES6 ES7 FR1 FR2 FR3 FR4 FR5 FR6 FR7 FR8 IE1 IE2 IT1 IT2 IT3 IT4 HU1 HU2 HU3 NL1 NL2 NL3 NL4 AT1 AT2 AT3 PL1 PL2 PL3 PL4 PL5 PT3 PT1 PT2PL6 PT5 PT4 SK1 SK2 SK3 SK4 FI1 FI2 FI3 FI4 SE1 SE2 SE3 BG1BG2 RO1 RO2 RO3 RO4 NO1 NO2 NO3 NO4 NO5 NO6 NO7 0 200 400 600 E P O pat ent s per m ill ion popul at ion 10 20 30 40 50 % Constrained learning R-squared = .01
% Constrained learning by EPO patents
BE1 BE2 BE3 CZ1 CZ2 CZ3CZ6 CZ5CZ4 CZ7 CZ8 GR1 GR2 GR3
GR4 ES2 ES3 ES1
ES4 ES5 ES6 ES7 FR1 FR2 FR3 FR4 FR5 FR6 FR7 FR8 IE1 IE2 IT1 IT2 IT3 IT4 HU1 HU2HU3 NL1 NL2 NL3 NL4 AT1AT2 AT3 PL1 PL2PL3 PL4 PL5PL6 PT1 PT2 PT3PT4SK1 PT5SK4SK3SK2 FI1 FI2 FI3 FI4 SE1 SE2 SE3 BG1BG2 RO1 RO4 RO3RO2 NO1 NO2 NO3 NO4 NO5 NO6 NO7 -200 0 200 400 600 E P O pat net s per m ill ion popul at ion 0 10 20 30 40 50 % Low learning R-squared = .27
4. A multi-level analysis of employee learning and regional education and training systems
In this section I explore the impact of differences in regional education and training systems on the likelihood of the different forms of learning. To do this I use multi-level logistic regression analysis which is a technique that allows one to separate the part of the total residual variance in the population attributable to differences in individual characteristics from the part due to differences in the regional context in which they work. Multi-level modelling responds to the criticism often made of single-level models that too much emphasis is placed on the individual‟s characteristics to the neglect of the social or institutional context. By simultaneously modelling at multiple levels it is possible to determine where and how effects are occurring including possible interaction effects between individual attributes and the institutional context. (Rasbash, et al. 2005). Here the technique is used for two purposes: firstly, to determine whether differences in the development of regional education and training systems over the 81 European regions have a direct and statistically significant impact on the likelihood that employees in general in the region are engaged in the different forms of learning at work; and second, by examining interaction effects, to determine whether the effect of the level of an employee‟s initial formal education on his or her likelihood of being engaged in the different forms of learning at work varies across regions as a function of the level of development of the regional education and training system.
4.1 Employee-level variables
In what follows a very simple model specification is developed at the level-1, or employee-level, with the likelihood of an employee being engaged in the different forms of learning being determined by the level of his or her initial formal education and the number of years of working experience. This perspective draws inspiration from behavioural psychology literature which focuses on the importance of domain specific expertise for creativity (Csikszentmihlyi, 1996; Sternberg, 2000). Expertise is seen as being based on the mastery of a body of codified knowledge as well as tacit knowledge based on experience. A variety of empirical evidence has been mustered to demonstrate that creativity it is preceded by a number of years of working experience in the field possibly accompanied by formal education and training (Weisberg, 1988; 1993). Although much of the anecdotal evidence focuses on eminent individuals characterised by exceptional creativity (Simonton, 1985), the importance of expert thinking has also been supported by research focussing on everyday or „local‟ creativity such as that
displayed by group facilitators or teaching assistants in academic settings (Craft, 1998; Reilly, 2008).
In order to capture the acquisition of formal knowledge of the sort codified in academic texts and manuals, a three level categorical variable is defined measuring the level of a person‟s initial formal education. EDUC1 indicates that a person has at most a lower secondary education, EDUC2 that the person has a upper secondary or post-secondary education but not tertiary, and EDUC3 that the person as a tertiary education. The reference case for the regressions is EDUC1, having a lower secondary, primary or no education. Unlike codified knowledge acquired through formal education, the acquisition of informal experience-based knowledge cannot be captured on the basis of enrolments or degrees awarded. As a proxy for the importance of experience-based knowledge, I use a four-level categorical variable indicating the number of years of working experience a person has had since completing formal education. EXPRC1 refers to less than 5 years of experience, EXPRC2 to between 5 and 10 years of experience, EXPRC3 to between 10 and 25 years, and EXPRC4 to over 25 years of experience. The reference case for the estimations is EXPRC1, having less than 5 years of working experience. The regressions include controls for broad industrial sector and occupation.
4.1 Regional level context variables
At level-2, or the regional level, differences in the development of regional systems of education and training are captured with two kinds of indicators that are available on Eurostat‟s electronic database: the importance of life-long learning (LLL) at the regional level measured by the percentage of adults aged 25-64 involved in some form of further training or education during the four weeks prior to the survey8; and the percentage of the population aged 25-64 having completed tertiary education (TERT). Life-long learning is broadly defined to include formal, non-formal and informal or self-learning. Formal life-long learning is defined as that provided by the degree conferring institutions of the formal educational system and contributes to the up-grading of formal scientific and technical knowledge. Non-formal education and training refers to all forms of taught learning, including that provided by employers, that occurs outside the formal degree-conferring educational system. This captures the on-going
8 For a presentation of the of the survey methodology, see the Quality report for the 2003 version:
http://circa.europa.eu/irc/dsis/employment/info/data/eu_lfs/LFS_MAIN/Adhoc_modules/2003/ExplanatoryNotes/ Final_Report_Ahm2003_EN.pdf
acquisition of both industry and firm-specific knowledge. Informal learning refers to self-taught learning including the use of printed materials and on-line computer based learning.
Table 8: Regional Institutional Indicators
LLL TERT
High LLL regions High TERT regions
Etelä-Suomi, Finland 24.2% Oslo og Akershus, Norway: 44.9 Pohjois-Suomi, Finland: 23.6 Brussels Hoofdstedlijk Gwest, Belgium: 41.5 Länsi-Suomi, Finland : 22.2 Ile de France, France: 38.7 Oslo og Akershus, Norway: 20.0 Etelä-Suomi, Finland: 37.6 Itä-Suomi, Finland: 19.8 Comunidad de Madrid, Spain : 36.6 Vestlandet, Norway : 19.8 Noreste, Spain : 36.5 Trondelag, Norway : 19 .5 West-Nederland, Netherlands : 33.2 Södra Svierge, Sweden : 19.3 Ostra Svierge, Sweden : 32.9 Nord-Norge, Norway : 18.4 Trøndelag : Norway : 32.8 Östra Svierge, Sweden : 18.3 Länsi-Suomi, Finland : 32.6
Low LLL Regions Low TERT regions
Severna I iztochna, Bulgaria: 0.1% Macroregiunea doi, Romania: 6.5% Macroregiunea doi, Romania: 1.1 Macroregiunea uno: Romania: 7.0 Nisia Aigaiou, Kriti, Greece 1.1 Severozápad, Czech Republic: 7.5 Noreste, Spain: 1.2 Macroregiunea patru, Romania: 7.9 Macroregiunea patru, Romania: 1.4 Alentejo, Portugal : 9.8 Macroregiunea uno: Romania: 1.4 Notre, Portugal: 9.9 Macroregiunea tre: Romania 1.5 Centro, Portugal: 10.2 Východné Slovensko, Slovakia: 1.8 Střední Čechy, Czech Republic: 10.5 Attiki, Greece: 1.8 Moravskoslezsko, Czech Republic: 10.6 Yugozapadna i yuzhna
centralna Bulgaria: 1.8 Severovýchod, Czech Republic: 10.7
Source: Eurostat‟s regional data set
Table 8 identifies high and low LLL regions and high and low TERT regions. The highest LLL regions are located in Finland, Norway and in Sweden, while the lowest are located in Spain, Greece, Bulgaria and Romania. The highest TERT regions include the Brussels region, the Madrid and Noreste regions of Spain, Ile de France, Oslo region in Norway and the Itä-Suomi region in Finland. The lowest TERT regions are located in Portugal, Romania and the Czech Republic. For the 81 regions there is a moderately high positive correlation between TERT and LLL of 0.68.
Table 9 below shows the results for the basic model including both random intercepts and random coefficients for the variables measuring the employee‟s level of formal education and years of working experience. The level-1 fixed effects show the impact of the employee-level variables on the likelihood of the different forms of learning much as in a standard logistic regression.
With respect to the variables measuring the level of an employee‟s initial education and years of working experience, the results are quite straight forward. Relative to persons having at most a lower secondary education, they show a positive impact of having a tertiary-level education on the likelihood of the creative learning forms and a smaller positive effect of having a upper secondary or post secondary, non-teriary education. The results show that there is a positive relation between the number of years of working experience and the likelihood of creative work activity. For constrained learning, there is a positive impact of having a secondary or post secondary education while the impact of having between 10 and 25 or over 25 years of
experience is negative and significant. The likelihood of the low learning forms is decreasing in the level of education and years of experience and the coefficients are all statistically
significant.
With respect to the occupational and sector controls, while most of the results are also straight forward there are a few surprises. As might be anticipated, managers, senior officials,
professionals and technicians are more likely to be involved in creative learning relative to skilled workers and they less likely to be involved in low learning at work. Service and sales workers, operators and the elementary occupations are less likely than the skilled to be involved in creative learning and more likely to be involved in low learning. The results are mixed for these occupations in the case of constrained learning, with service workers and the elementary occupations being less likely than the skilled to be engaged in these forms, while operators are more likely. The latter result is somewhat surprising and implies that the amount of problem-solving, admittedly of a constrained sort, undertaken machine handlers and
Table 9: Multi-level logistic models with
random intercepts and coefficients at the regional level Creative learners Constrained learners Low learners Fixed: Level 1 Constant -.57*** -.91*** -.67*** EDUC2 .29*** .22*** -.56*** EDUC3 .96*** -.12 -1.42*** EXPRC2 .20*** -.12* -.15** EXPRC3 .37*** -.19*** -.31*** EXPRC4 .48*** -.28*** -.38***
MANAGERS, SENIOR OFFICIALS .68*** -.63*** -.42***
PROFESSIONALS .47*** -.29*** -.60***
TECHNICANS .25*** .02 -.62***
CLERKS -.20*** .08 .20**
SERVICE WORKERS -.23*** -.11 .41***
SKILLED TRADES
PLANT, MACHINE OPERATORS -.72*** .22*** .62***
ELEMENTARY -.57*** -.27*** .90***
AGRICULTURE, FORESTRY, FISHING
.62*** -.76*** -.16*
MNFCT, CNSTRCT & UTIL
RETAIL, OTHER SERVICES .15*** -.22*** .03
BUSINESS, FINANCIAL SERVICES .23*** -.10 -.25***
PUBLIC ADMN, EDUC, HEALTH .12** -.09 -.07
COMMUNITY, PERSONAL SERVICES .19*** -.33*** .11 Random Intercept .123 (.027) .044 (.014) .232 (.049) Coefficient EDU2 .030 (.009) .010 (.015) .057 (.029) Coefficient EDU3 .083 (.035) .045 (.030) .123 (.042) Coefficient EXPRC2 .00 (.00) .00 (.00) .007 (.037) Coefficient EXPRC3 .00 (.00) .011 (.017) .012 (.024) Coefficient EXPRC4 .030 (..024) .00 (.00) .047 (.035) N 17412 17412 17412
LR test vs Logisitic regression: chi2(6) = 335.1 Prob > chi2 = 0.000 chi2(6) = 76.78 Prob > chi2 = 0.000 chi2(6) = 407.43 Prob > chi2 = 0.000
The sector control variables show, relative to manufacturing construction and utilities, that creative learning is more likely in agriculture forestry and fishing, in the public sector and in community and personal services. Somewhat surprisingly, the sector for which the difference is most pronounced is agriculture, forestry and fishing, suggesting that the amount of learning required of employees in what is usually classified as a traditional industry is considerably underestimated. The constrained learning forms are especially characteristics of manufacturing, construction and utilities. Relative to manufacturing, low learning is less likely in business and financial services, in public administration, in education and health, and in community and personal services but not in retail and other services.
The results for the random part of the models shown in Table 9 provide estimates of the variance across regions in both the intercept term and in the coefficients for the variables capturing the level of initial education and years of working experience. These variance
estimates capture different aspects of variability in the impact of regional context conditions on employee-level outcomes across the 81 regions. For example, in the case of the model
predicting the likelihood of creative work, statistically significant variance in the intercept term means that in regions where the value of the intercept term is greater than the average value for the 81 regions, the likelihood that employees in general in the region are engaged in creative work will be above the average for the population as a whole. Statistically significant variance in the estimated coefficients on the variables capturing the level of initial education, or years of working experience, means that the size of the positive impact of having a higher level of initial education, or of having more years of working experience, on the likelihood of being engaged in creative work activity will vary across the 81 regions.9
The results presented in the first row for the random part of the model indicate that the estimated variance in the intercept for the model predicting creative work is 0.123. The estimated variance for the model predicting low learning is about twice that (0.232), while in the case of the model predicting constrained learning the estimated variance in the intercept term is considerably smaller (0.044). In general the estimated variance in the coefficients of the variables measuring an employee‟s level of education and his or her years of working
9
Since the value of the variance is by definition greater than 0, standard tests of whether the estimated variance parameters are statistically different from 0 are inappropriate. The likelihood ratio (LR) test reported at the bottom of the table compares the multilevel model with the single-level model where the variances in the intercept and coefficients are constrained to be 0. The results show that there is statistically significant variation between regions.
experience are lower than the estimated variance in the intercept terms. The results presented in rows 2 through 6 of the random part of the model show that there is very little difference across regions in the positive impact of having more years of experience on the likelihood of the different forms of learning at work, while there is more variability across regions in the impact of having more years of formal education on the likelihood of the different forms of learning at work.
In Table 10 below the results of the extended model including level-2 fixed effects are shown. The level-2 fixed effects provide estimates of the direct impact of differences in the level of lifelong learning and in the percentage of the adult population having completed a third-level education on the likelihood that employees on average in a region will be engaged in the different forms of learning at work. To the extent that these level-2 regional context conditions have a statistically significant impact on the likelihood of the different forms of learning at work, their inclusion in the models will help to account for some of the unexplained variance in the intercept term shown in Table 9. The results presented in the first row of the random part of the model in Table 10 show that the estimated variance in intercept for the model predicting creative work is reduced from .123 to .084, implying that differences in the level of
development of the regional education and training system account for about one third of the unexplained variance in the intercept term shown in Table 9. There is little change in the estimated variance of the intercept for the model predicting constrained learning, while the estimated variance in the intercept for the model predicting low learning is reduced by about 50 percent, from .232 to .118.
From the point of view of regional policy the most important result shown in Table 10 concerns the different direct impacts of the two regional educational system variables on the likelihood of the creative and low learning forms of work organisation. The column one results show a
positive and statistically significant impact of the level of adult participation in life-long learning on the likelihood of creative learning, and the column three results show an even stronger
negative impact of life-long learning on the likelihood of the low learning forms. In sharp contrast to this, the results show that there is no significant impact of the share of the adult population having completed tertiary education on the likelihood of either the creative or low learning forms.
Table 10: Multi-level logistic models with regional contextual effects1 Creative learners Constrained learners Low learners Fixed: Level 1 Constant -.90*** -.93 -.31*** EDUC2 .29*** .20*** -.57*** EDUC3 .96*** -.20*** -1.59*** EXPRC2 .20*** .34 -.16** EXPRC3 .37*** -.12* -.31*** EXPRC4 .48*** -.28*** -.37*** Fixed Level 2 LLL .03*** .01 -.06*** TERT .00 -.01 .00 Random Intercept .084 (.019) .040 (.014) .118 (.029) Coefficient EDU2 .013 (.014) .012 (.015) .038 (.023) Coefficient EDU3 .110 (.038) .043 (.030) .170 (.073) Coefficient EXPRC2 .000 (.000) .000 (.000) .014 (.039) Coefficient EXPRC3 .00 (.00) .012 (.017) .027 (.027) Coefficient EXPRC4 .034 (.019) .000 (.000) .033 (.031) N 17412 17412 17412
LR test vs Logisitic regression: chi2(6) =
252.80 Prob > chi2 = 0.000 chi2(6) = 67.22 Prob > chi2 = 0.000 chi2(6) = 199.84 Prob > chi2 = 0.000
*** = sig. at .01 level, ** = sig. at .05 level, * = sig. at .10 level 1. Includes controls for sector and occupation.
These contrasting results for the effects the impact of the level of participation in life-long learning and the share of the adult population with a third-level education at the regional level may seem paradoxical, given that at the individual-level there is a strong positive relation between having completed a third-level education and the likelihood of being involved in the creative learning forms. However, what needs to be appreciated here is that employee-level effects and regional-level context effects need not move in the same direction. Thus, it is quite possible that the completion of a tertiary education will increase one‟s chances everywhere of getting access to work involving high levels of learning and autonomy, while an increase in the overall regional stock of adults with a third-level education will not increase the likelihood of
employees in general being involved in creative work activity. The regression analysis presented here does not provide the basis for explaining this outcome. However, a possible explanation that is consistent with the results is that increasing the adult population‟s access to further education and training contributes to the acquisition and renewal of practical and work-related skills that are highly complementary to the more theoretical knowledge and general skills acquired through formal initial education. Broad access to life-long learning may thus serve to boost the level of expertise in general, regardless of one‟s level of initial education, and in this manner it increases the overall level of creativity in the region. By contrast, an increase in the level of investment in third-level education may well prove disappointing, since increasing the stock of persons coming onto the market with higher-level academic training cannot compensate for the failure to make investments in the forms of further education and training that serve to renew and further develop the more practical and work-related skills needed for solving the organisational and technical problems employees confront in work.
While the above analysis focuses on the direct impact of differences in the level of development of the regional education and training system on the level of creative work activity in general, it leaves unaddressed the question of how regional policies may interact with and effect differently persons with different individual-level characteristics. In what follows I focus on possible
interaction effects between the indicators of the regional education and training system and differences in an individual‟s level of initial education. This can be justified by the importance attached to educational attainment levels at the secondary and tertiary levels in policy
discussions, not least at the EU level.10
Table 11 below show the results for models including interaction terms between the level of initial formal education and the level of development of the regional education and training system. The results show a positive and statistically significant interaction effect between the level of development of the regional system of lifelong learning in the case of persons with an upper secondary or post secondary but not tertiary education (EDU2), and a negative interaction effect in the case or persons with a tertiary education (EDU3). There are no significant
interaction effects between the percentage of the persons in a region having completed a third-level education and the third-level of a person‟s initial formal education.
10 One of the 5 headline targets in the EU 2020 is strategy is to, “Reduce the share of early school leavers to 10%
from the current 15% and increase the share of the population aged 30-34 having completed tertiary education from 31% to at least 40%”. See European Council 17 June, 2010 Conclusions, Brussels.
Table 11: Multilevel logistic models with interaction effects1 Creative learners Creative learners Fixed: Level 1 Constant -.85*** -.97*** EDUC2 .23** .29*** EDUC3 .96*** 1.44*** EXPRC2 .20*** .21*** EXPRC3 .37*** .37*** EXPRC4 .48*** .48*** Fixed Level 2 LLL .02** .04*** TERT .00 .00 LLL x EUD2 .02** TERT x EDU2 .00 LLL x EDU3 -.04*** TERT x EDU3 -.01 Random Intercept .082 (.019) .089 (.027) Coefficient EDU2 .009 (.013) .010 (.013) Coefficient EDU3 .081 (.035) .026 (.024) Coefficient EXPRC2 .000 (.000) .000 (.000) Coefficient EXPRC3 .000 (.000) .000 (.000) Coefficient EXPRC4 .034 (.024) .035 (.024) N 17412 17412
LR test vs Logisitic regression: chi2(6) = 222.61 Prob > chi2 = 0.000
chi2(6) = 226.86 Prob > chi2 =
0.000
*** = sig. at .01 level, ** = sig. at .05 level, * = sig. at .10 level 1. Includes controls for sector and occupation.
In interpreting these results it needs to be emphasized that the direction of the sign on the interaction term does not change the basic direction of the level-1 fixed effects for EDU2 and EDU3. Rather the positive sign for LLL x EUD2 should be interpreted as meaning that the positive effect of having a secondary education on the likelihood of being involved in creative work activity is relatively higher in nations with well developed systems of life-long learning,
while the negative sign on LLL x EUD3 means that the positive effect of having a tertiary education is relatively lower in such nations. This result has policy implications from a social standpoint. It suggests that whatever disadvantages having only an upper secondary education may imply for a person in terms of getting access to opportunities for creative learning in work, these disadvantages can to some extent be compensated for by gaining access to further
education and training later on in life. In short, well developed policies of life long learning can serve a remedial purpose and can contribute to reducing inequalities in access to high quality work environments for employees with different educational backgrounds.
5. Conclusion
This paper has focused on regional differences in the relation between employee learning within public and private sector establishments and the characteristics of regional education and training systems. The descriptive statistics have identified considerable variation in the frequency of the different forms of learning across a sample of 81 European regions, and a prima facie case has been made for the positive relation between the development of the creative forms of learning and regional innovative performance. This raises the issue of policies to promote creative learning at work and the multi-level regression analysis has focussed on the impact of the
development of opportunities for life-long learning and increasing the stock of employees with a tertiary education. A significant implication of the analysis is that the educational bottleneck to increasing the learning capabilities of organisations is not at the level of investments in tertiary education. To be effective such investments in higher-level education have to be accompanied by a strong commitment to further education and training in order assure the continual renewal and upgrading of the skills of mid-career employees. Further, the results suggest that well-developed systems of life-long learning may have an important equalising effect by improving the relative access of persons with only an upper secondary education to creative work environments.
These conclusions need to be qualified in important respects. First, there are the limitations in the regional data available on Eurostat‟s electronic data-base. The problems with using patent
statistics as a proxy for innovativeness are well known and it can be hoped that future rounds of the Community Innovation Survey will include a regional breakdown. Second, the analysis has been restricted to the impact of measures of the regional education and training system. While this is clearly an important dimension of the regional innovation system, the multi-level analysis has shown that it only accounts for part of the unexplained variance in creative work activity
across regions. Future studies could usefully extend the approach developed here to focus on other institutional dimensions and in particular to address the way labour market mobility and systems of employment and unemployment protection impact on the processes of knowledge generation transmission that support creative learning at the workplace.
References
Acs, Z., Audretch, D. and M. Feldman, 1991, „Real effects of academic research: comment‟,
American Economic Review, 82, pp. 363-367.
Arundel, A. and H. Hollanders., 2005, EXIS: An exploratory approach to innovation
scoreboards. http://trendchart.cordis.lu/scoreboards/scoreboard2004/pdf/EXIS.pdf, March. Arundel, A., E. Lorenz, B-A Lundvall and A. Valeyre, 2008, „The organisation of work and
innovative performance: a comparison of the EU-15‟, Industrial and Corporate Change. Asheim, B. 1996. „Industrial districts as 'learning regions': A condition for prosperity‟,
European Planning Studies, Volume 4, Issue 4, pp. 379-400.
Asheim, B. 2001, „Learning regions as development coalitions‟, partnership as governance in European workfare states?‟, Concepts and Transformation, Vol 6, No 1, pp. 73-101. Asheim, B., 2011, „Learning, innovation and participation: Nordic experiences in a global
context with a focus innovations systems and organisation of work‟ in Ekmann, Gustavsen, Asheim and Palshaugen (eds.), Learning Regional Innovation, Palgrave, Macmillan, pp. 15-50.
Asheim, B and Coenen, L., 2006, „Contextualising regional innovation systems in a globalising learning economy: on knowledge bases and institutional frameworks‟, The Journal of
Technology Transfer, Vol 31, No 1, pp. 163-73.
Cooke, P. 1992, „Regional innovation systems: competitive regulation in the new Europe‟, Geoforum, Vol 23, pp. 945-974.
Cooke, P. Uranga, M. and Etxebarria, G. 1998, „Regionl systems of innovaton: an evolutionary perspective‟, Environment and Planning, A(30), pp. 1563-584.
Craft, A. 2005, Creativity in Schools: Tensions and Dilemmas, Oxford, Routledge Press. Csikszentmihalyi, M. 1988. ‟Society, culture, and person: A systems view of creativity‟ in
Sternberg, R. (ed.), The Nature of Creativity: Contemporary Psychological Perspectives, Cambridge, Cambridge University Press.
Freeman, C. 1987, Technology policy and economic performance: lessons from Japan, Pinter, London.
Holm, R., E. Lorenz, B.-A. Lundvall, A.Valeyre, 2010, „ I
Jaffe, A. 1989, „Real effects of academic research‟, American Economic review, 79, pp. 984-1001.
Lawson, C. and E. Lorenz, 1999, „Collective learning, tacit knowledge and regional innovative capacity‟ Regional Studies, Vol. 33. No. 4 pp. 305- 317.
Link, A. and J. Rees, 1990, Firm size, university based research and the returns to R&D‟, Small
Lundvall, B.A. 1992, National systems of innovation, Pinter, London.
Lundvall, B.A and B. Johnson, The Learning Economy, Journal of Industry Studies, 1, pp. 23-42.1994,
Maskell, P. 1998, Competitiveness, localised learning and regional development, Routledge, London.
Lorenz, E and A. Valeyre, 2005, „Organisational Innovation, Human Resource Management and Labour Market Structure: A Comparison of the EU‐15‟ The Journal of Industrial
Relations, Vol; 47, No. 4, pp 424-42
Parent-Thirion A., Fernandez Macias E., Hurley J., Vermeylen G., Fourth European Working
Conditions Survey, European Foundation for the Improvement of Living and Working
Conditions, Luxembourg, Office for Official publications of the European Communities, 2007.
Qvqle, T., 2011, Participative democracy and the diffusion of organisational innovations: the long, winding road from a plant level „field experiment‟ to regional economic
development‟, in Ekmann, Gustavsen, Asheim and Palshaugen (eds.), Learning Regional
Innovation, Palgrave, Macmillan, pp. 187-205.
Rasbash, J., F. Steele, W. Browne, and B. Prosser, 2005, A User's Guide to MLwiN, Centre for Multilevel Modelling, University of Bristol.
Reilly, R. 2008, „Is expertise a necessary precondition for creativity? A case of four novice learning group facilitators‟, Thinking Skills and Creativity, 3: 59-76.
Simonton, D. K. (1985). „Quality, quantity, and age: The careers of 10 distinguished
psychologists. International Journal of Aging and Human Development, Vol. 21, pp. 241-254.
Sternberg, R. (ed.), 1988. The Nature of Creativity: Contemporary Psychological Perspectives, Cambridge, Cambridge University Press.
Storper, M. and A. Scott, 1995, The Wealth of Regions, Futures, Vol 27, No 5, pp. 505-26 Weisberg, R. 1993, Creativity: beyond the myth of genius, New York: W.H. Freeman.
Annex
Table A: Forms of learning by Nuts Region
(percent of salaried employees)
Code Region Creative learning Constrained
learning Low learning Belgium (NUTS1) BE1 Brussels Hoofdstedelijk Gewest 69.32 16.37 14.32
BE2 Vlaams Gewest 60.80 19.31 19.90
BE3 Région Wallonne 62.87 15.75 21.39
Czech Republic (NUTS2)
CZ1 Praha 51.28 35.38 13.34 CZ2 Střední Čechy 38.49 26.83 34.68 CZ3 Jihozápad 40.84 39.87 19.29 CZ4 Severozápad 39.77 27.69 32.54 CZ5 Severovýchod 32.24 34.97 32.80 CZ6 Jihovýchod 47.12 25.95 26.93 CZ7 Střední Morava 50.93 30.04 19.03 CZ8 Moravskoslezsko 49.10 19.92 30.98 Greece (NUTS1) GR1 Voreia Ellada 48.91 18.74 32.36 GR2 Kentriki Ellada 50.19 25.66 24.15 GR3 Attiki 43.79 26.14 30.07
GR4 Nisia Aigaiou, Kriti 57.85 26.47 15.69
Spain (NUTS1) ES1 Noroeste 44.60 13.70 41.71 ES2 Noreste 40.87 31.48 27.65 ES3 Comunidad de Madrid 49.07 21.57 29.35 ES4 Centro 29.98 20.20 49.83 ES5 Este 39.59 22.25 38.16
ES6 Sur 35.43 32.99 31.58 ES7 Canarias 51.72 35.86 12.42 France (NUTS1) FR1 Ile de France 55.36 17.55 27.10 FR2 Bassin Parisien 46.94 28.79 24.27 FR3 Nord - Pas-de-Calais 55.31 27.79 16.90 FR4 Est 63.56 20.50 15.94 FR5 Ouest 64.02 21.25 14.73 FR6 Sud-Ouest 73.10 18.10 8.80 FR7 Centre-Est 53.79 24.26 21.95 FR8 MÈéditerranée 60.28 15.64 24.08 Ireland (NUTS2)
IE1 Border, Midlands
and Western 64.84 12.35 22.81
IE2 Southern and
Eastern 56.96 18.95 24.09
Italy (NUTS1)
IT1 Nord Ovest 61.80 14.91 23.29
IT2 Nord Est 56.46 13.62 29.92
IT3 Centro 65.31 11.54 23.15 IT4 Sud 61.33 18.77 19.90 Hungary (NUTS1) HU1 Közép-Magyarország 63.07 17.25 19.69 HU2 Dunántúl 54.02 24.29 21.69
HU3 Észak és Alföld 56.12 20.69 23.19
Netherlands (NUTS1) NL1 Noord-Nederland 54.87 29.76 15.37 NL2 Oost-Nederland 69.73 18.47 11.81 NL3 West-Nederland 63.65 25.63 10.72 NL4 Zuid-Nederland 65.60 24.28 10.12 Austria (NUTS1)
AT1 Ostösterreich 50.49 35.18 14.33 AT2 Südösterreich 60.21 26.89 12.90 AT3 Westösterreich 53.82 26.15 20.03 Poland (NUTS1) PL1 Centralny 41.05 24.62 34.33 PL2 Poludniowy 49.22 25.19 25.59 PL3 Wschodni 48.24 28.07 23.69 PL4 Pólnocno-Zachodni 60.01 19.19 20.80 PL5 Poludniowo-Zachodni 62.35 17.37 20.27 PL6 Pólnocny 45.44 28.06 26.50 Portugal (NUTS2) PT1 Norte 41.55 23.72 34.73 PT2 Algarve 55.92 27.24 16.84 PT3 Centro 62.14 16.64 21.22 PT4 Lisboa 32.63 41.93 25.43 PT5 Alentejo 32.54 39.79 27.67 Slovakia (NUTS2) SK1 Bratislavský kraj 55.12 21.95 22.93 SK2 Západné Slovensko 41.56 26.14 32.30 SK3 Stredné Slovensko 49.56 19.96 30.49 SK4 Východné Slovensko 46.61 26.48 26.90 Finland (NUTS2)
FI1 Itä Suomi 58.69 32.46 8.85
FI2 Etelä Suomi 57.96 30.12 11.92
FI3 Länsi Suomi 60.65 30.23 9.12
FI4 Pohjois-Suomi 55.91 32.43 11.66
Sweden (NUTS1)
SE1 Östra Sverige 72.00 22.13 5.86
SE3 Norra Sverige 73.91 19.00 7.09 Bulgaria (NUTS1) BG1 Severna i iztochna Bulgaria 44.32 24.43 31.24 BG2 Yugozapadna i yuzhna centralna Bulgaria 42.38 28.08 29.54 Romania (NUTS1)
RO1 Macroregiunea unu 56.37 21.66 21.97
RO2 Macroregiunea doi 39.00 23.09 37.91
RO3 Macroregiunea trei 46.33 20.83 32.84
RO4 Macroregiunea
patru 40.46 30.07 29.46
Norway (NUTS2)
NO1 Oslo og Akershus 73.58 16.33 10.10
NO2 Hedmark og
Oppland 66.01 21.24 12.75
NO3 Sør-Østlandet 67.29 19.41 13.30
NO4 Agder og Rogaland 72.46 18.83 8.71
NO5 Vestlandet 73.55 17.24 9.21
NO6 Trøndelag 75.05 22.66 2.29