1
Journal of Biogeography
SUPPORTING INFORMATION
Using species richness and functional traits predictions to constrain assemblage predictions from stacked species distribution models
Manuela D’Amen, Anne Dubuis, Rui F. Fernandes, Freitag Julien Pottier, Loïc Pellissier and Antoine Guisan
Appendix S1 Assemblage evaluation metrics and supplementary results.
Table S1 Confusion matrix used to compute the assemblage evaluation metrics.
observed p red ict ed 0 1 0 TN FN 1 FP TP
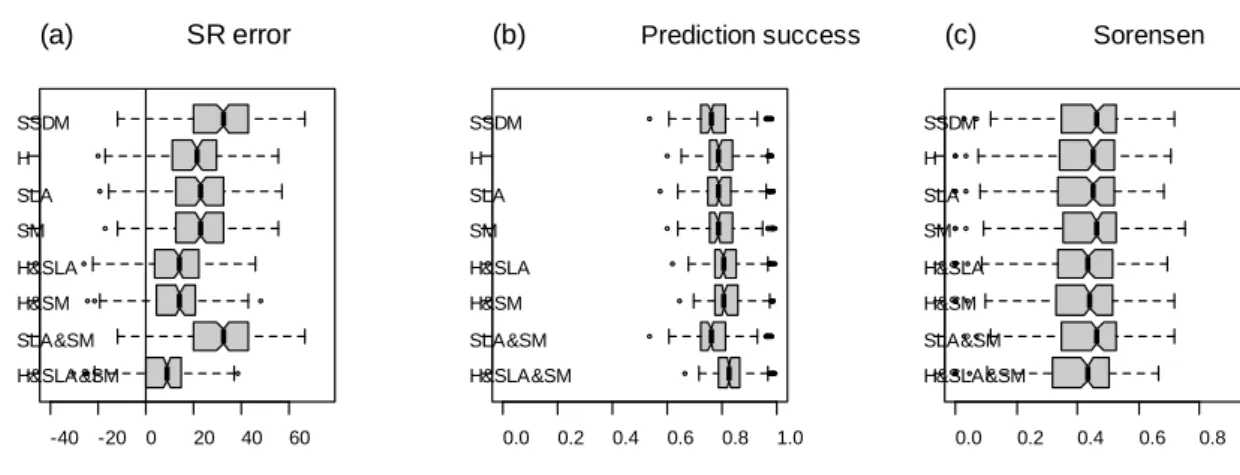
Figure S1 Results from true skill statistic (TSS) thresholding criterion: the boxplots compare results from the ‘trait range’ rule test for single traits and all their combinations when using TSS to binarize the SDM predictions. The metrics utilized in the comparison are: (a) species richness error, i.e. predicted SR – observed SR (first column), (b) prediction success, i.e. sum of correctly predicted presences and absences divided by the total species number (second column), and (c) Sørensen index, i.e. a statistic used to compare the similarity of two samples (third column). Abbreviations: H, height; SLA, specific leaf area of the community; SM, seed mass.
H&SLA&SM SLA&SM H&SM H&SLA SM SLA H SSDM -40 -20 0 20 40 60 H&SLA&SM SLA&SM H&SM H&SLA SM SLA H SSDM 0.0 0.2 0.4 0.6 0.8 1.0 H&SLA&SM SLA&SM H&SM H&SLA SM SLA H SSDM 0.0 0.2 0.4 0.6 0.8
2
Appendix S2 Evaluation results for SDMs and MEMs.
Table S2 Summary of the SDMs evaluation results.
GAM GBM GLM
AUC mean 0.803 0.783 0.799 AUC stdev 0.078 0.081 0.077 TSS mean 0.541 0.507 0.537 TSS stdev 0.142 0.137 0.142
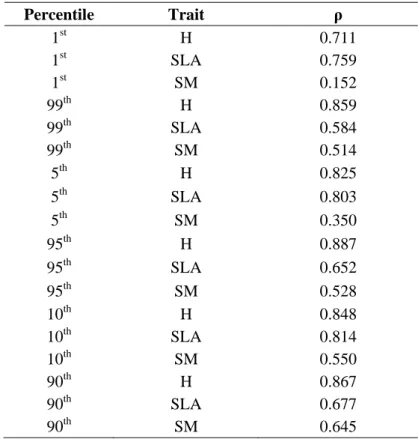
Table S3 Values of Spearman correlation test between observed and predicted values of trait percentiles. Percentile Trait ρ 1st H 0.711 1st SLA 0.759 1st SM 0.152 99th H 0.859 99th SLA 0.584 99th SM 0.514 5th H 0.825 5th SLA 0.803 5th SM 0.350 95th H 0.887 95th SLA 0.652 95th SM 0.528 10th H 0.848 10th SLA 0.814 10th SM 0.550 90th H 0.867 90th SLA 0.677 90th SM 0.645
3
Appendix S3 Comparison of the assemblage predictions coming from the application of the
trait range rule with three pairs of percentiles. Abbreviations: SSDM, sum of binary SDMs; H,
height; SLA, specific leaf area of the community; SM, seed mass.1st–99th
5th–95th