Department of Physics University of Fribourg (Switzerland)
High energy resolution off-resonant X-ray spectroscopy
THESIS
presented to the Faculty of Science of the University of Fribourg (Switzerland) in consideration for the award of the academic grade of Doctor rerum naturalium
by
Wojciech Błachucki
fromPoland
Thesis No: 1932 Editor: UniPrint 2015Contents
Page Abstract. . . III Résumé . . . VII Streszczenie . . . XI
I Introduction to X-ray spectroscopy . . . . 1
I.1 Introduction . . . . 1
I.2 X-ray emission spectroscopy (XES) . . . . 7
I.3 X-ray absorption spectroscopy (XAS) . . . . 9
I.4 Instrumentation. . . 12
I.4.1 Production of X-rays . . . 12
I.4.2 Detection of X-rays . . . 15
II High energy resolution off-resonant spectroscopy (HEROS) . . . 21
II.1 Introduction . . . 21
II.2 Theoretical background . . . 22
II.3 Resonant X-ray emission spectroscopy (RXES) . . . 26
II.4 Development of HEROS . . . 29
II.5 Examples of applications of HEROS . . . 31
III Self-absorption-free HEROS. . . 39
III.1 Introduction . . . 39
III.2 Self-absorption in X-ray spectroscopy . . . 39
III.3 Experimental . . . 43
III.3.1 Experimental setup . . . 43
Contents
III.4 Results and discussion . . . 47
III.5 Conclusion . . . 53
IV Time-resolved chemical speciation with HEROS . . . 55
IV.1 Introduction . . . 55
IV.2 Experimental . . . 56
IV.2.1 Experimental setup . . . 56
IV.2.2 Data analysis . . . 57
IV.3 Calculation of XAS spectra with FEFF . . . 60
IV.4 Results and discussion . . . 63
IV.5 Conclusion . . . 68
V HEROS at X-ray free-electron laser facilities . . . 69
V.1 Introduction . . . 69
V.2 X-ray free-electron lasers . . . 69
V.3 Experimental . . . 73
V.3.1 CXI instrument at LCLS . . . 73
V.3.2 Experimental setup . . . 75
V.3.3 Data acquisition . . . 77
V.3.4 Data analysis . . . 78
V.4 Results and discussion . . . 84
V.5 Conclusion . . . 88
List of figures. . . 91
List of tables . . . 95
References. . . 97
Appendices . . . 107
A Reconstruction algorithms with Mathematica. . . 109
B The lcls.py module . . . 113
Acknowledgements. . . 121
Curriculum vitae . . . 123
List of publications . . . 125
Abstract
This work treats of the high energy resolution off-resonant X-ray spectroscopy (HEROS) method of determining the density of unoccupied electronic states in the vicinity of the absorption edge. HEROS is an alternative to the existing X-ray absorption spec-troscopy (XAS) methods and opens the way for new studies not achievable before.
HEROS makes use of high energy resolution X-ray emission spectroscopy (XES) to study spectra of inelastically scattered photons in off-resonant conditions, i.e., for incident photon energies below the atomic core level binding energy of interest. It has been shown that spectra of the off-resonantly inelastically scattered X-rays carry infor-mation on the occupancy of the discrete valence electronic states as well as the states above the ionization threshold (in the continuum). Provided that the incident photon beam energy bandwidth is less than the initial state lifetime broadening and a high resolution wavelength-dispersive detection system is used, HEROS allows to probe the density of unoccupied states with high energy resolution. This is possible because in the off-resonant inelastic X-ray scattering process the scattered photons’ spectra are not broadened by the studied absorption edge core hole lifetime. Further, in HEROS the studied material is irradiated with a monochromatic X-ray beam of energy fixed below the given ionization threshold and the spectrometer (in the geometry of von Hámos or Johansson) equipped with position sensitive detector allows recording emission spectra in one shot with typically tens of electronvolts-coverage. This scanning-free arrange-ment thus allows to probe the density of unoccupied states with time resolution limited only by the experimental setup’s efficiency. The swift way of probing the electronic structure of matter, provided by HEROS, is highly desirable in time-resolved spectro-scopic studies on dynamically changing chemical systems. This also makes HEROS a method of choice in case of extremely bright pulsed X-ray sources (such as X-ray free-electron lasers, XFELs) where the target is damaged after every pulse and the in-tensity variations severely limit the usability of XAS methods. Moreover, the HEROS spectral profiles are not modified by the self-absorption effect.
Abstract
Chapter I is a short introduction to X-ray spectroscopy. A brief description of the main physical phenomena and quantities involved in the XES and XAS studies is presented, and the experimental methods as well as the instrumentation used in XES and XAS are highlighted.
Chapter II is focused on the principles of high resolution resonant and off-resonant X-ray spectroscopy. The theoretical background of resonant X-ray scattering is pre-sented, and the new method HEROS is introduced. Examples of HEROS applications in different fields are also mentioned.
Chapter III is dedicated to a study showing that HEROS can be used to measure absorption spectra unaffected by the self-absorption effect. In the fluorescence mode XAS, the fluorescence yield is measured at the incident beam energy varying across the studied absorption edge. The self-absorption effect arises from the strong varia-tion of the photoabsorpvaria-tion coefficient in the resonant regime, and is enhanced by the sample thickness and concentration. In HEROS, an emission spectrum is measured for a single incident beam energy fixed below the ionization threshold of interest. As a consequence, the self-absorption effect is reduced to only the probability of reabsorp-tion of the produced fluorescence radiareabsorp-tion escaping from the target which is typically nearly constant in the measured emission energy range. The emission spectrum mea-sured with HEROS can be further used to calculate an absorption spectrum using the Kramers-Heisenberg formalism. This approach is supported by the presented Ta L3 edge absorption spectra obtained with the HEROS technique at the SuperXAS beam-line of the Swiss Light Source of the Paul Scherrer Institute, Switzerland. The Ta Lα1 HEROS spectra were recorded for nine Ta samples of different thicknesses, and the Ta L3 edge absorption spectra were reconstructed. The shapes of both the measured emission spectra and the reconstructed absorption spectra were found to be indepen-dent of the sample thicknesses and thus of the self-absorption effect. This work was published in Physical Review Letters [1].
In Chapter IV a time-resolved in situ HEROS study is described in which chemical speciation of a silica supported Ta catalyst under reaction conditions was attained at the Swiss Light Source of the Paul Scherrer Institute, Switzerland. HEROS is a power-ful tool to follow chemical reactions not only due to its high speed in probing the density of unoccupied states, but also because it needs no correction for the self-absorption ef-fect which varies with the substrates’ concentration changes during reaction. Analysis of the HEROS spectra measured one by one with 40 s-acquisition time during oxidation of both the inactive starting Ta complex and the one activated in hydrogen delivered
Abstract
several interesting findings. These include e.g., formation of dimeric Ta species caused by reaction with oxygen and a step-wise character of the transition of the inactive Ta catalyst to its oxidized form. The data presented in this work was published in the
Physical Chemistry Chemical Physics journal [2].
The results presented in Chapter V demonstrate that HEROS is applicable at X-ray free-electron laser facilities. In this work the HEROS technique was applied to the investigation of the electronic structure of copper in different oxidation states at the Linac Coherent Light Source (Menlo Park, California, USA) operated in the self-seeding mode. The experimental HEROS spectra for Cu1+ were compared to the ones for Cu0 and Cu2+ reported in Ref. [3], and to calculations based on theoretical XAS spectra retrieved from FEFF 9.6 program and on reference XAS spectra. It was shown that HEROS provides detailed electronic and structural information with high intensity femtosecond pulsed sources as well. Furthermore, it was shown that HEROS allows measuring single-shot spectra for each XFEL pulse separately, which makes it a method of choice for XFELs where the appreciable pulse-to-pulse intensity variations influence only the overall HEROS signal yield and leaves the shape of the measured spectra unaffected.
Résumé
Ce travail de thèse est consacré à la méthode HEROS (spectroscopie X hors-résonance en haute résolution), une méthode permettant d’étudier les niveaux électroniques inoc-cupés dans le voisinage des bords d’absorption. La méthode HEROS qui représente une alternative aux méthodes d’absorption XAS traditionnelles ouvre la voie à de nouvelles investigations irréalisables auparavant.
La méthode HEROS tire profit des avantages de la spectroscopie d’émission X en haute résolution (XES) pour étudier les spectres de photons ayant subi une diffusion inélastique hors-résonance, c.à.d. à des énergies incidentes juste en-dessous des énergies de liaison des niveaux atomiques profonds d’intérêt. Il a été démontré que les spectres de rayons X diffusés inélastiquement à des énergies hors-résonance contiennent des in-formations sur le taux d’occupation des niveaux atomiques discrets de valence et des niveaux du continu au-dessus du seuil d’ionisation. Si la résolution en énergie du fais-ceau de photons incidents est plus petite que la largeur naturelle de l’état atomique initial et si les mesures sont effectuées avec un instrument ayant un grand pouvoir de résolution comme par exemple un spectromètre à cristal, la méthode HEROS permet de déterminer en haute-résolution la densité des niveaux atomiques inoccupés. Ceci est possible parce que dans la diffusion inélastique hors-résonance les raies spectrales des photons diffusés ne sont pas élargies par les durées de vie moyenne des lacunes de cœur associées aux bords d’absorption étudiés. De surcroît, dans la méthode HEROS, l’échantillon analysé est irradié avec un faisceau de rayons X monochromatiques dont l’énergie est fixée au-dessous du seuil d’absorption. Par ailleurs, l’emploi de spectro-mètres à cristal de type von Hámos ou Johansson équipés de détecteurs sensibles à la position permet de mesurer le spectre des photons diffusés sur un domaine d’éner-gie s’étalant sur plusieurs dizaines d’électronvolts sans qu’aucun réglage du faisceau incident ou du spectromètre ne soit nécessaire. Ce montage ne nécessitant aucun ajus-tement permet donc de déterminer la densité d’états électroniques inoccupés avec une résolution temporelle limitée uniquement par l’efficacité du spectromètre. L’analyse
Résumé
rapide de la structure électronique d’échantillons par la méthode HEROS est donc par-ticulièrement bien adaptée à des mesures spectroscopiques nécessitant une résolution temporelle comme par exemple l’étude de la dynamique de réactions chimiques. La tech-nique HEROS représente aussi la méthode de prédilection dans le cas où l’échantillon doit être irradié avec des faisceaux de rayons X pulsés extrêmement intenses comme ceux produits par les sources XFELs (lasers X à électrons libres) parce que dans ce cas l’échantillon est endommagé après chaque impulsion de faisceau et les variations importantes d’intensité entre les différentes impulsions ne permettent pas l’emploi des méthodes d’absorption XAS traditionnelles. De surcroît, les spectres HEROS ne sont pas affectés par l’effet d’auto-absorption.
Le chapitre I est une courte introduction à la spectroscopie des rayons X. Il contient une brève présentation des phénomènes physiques essentiels et des grandeurs principales intervenant dans les études XES et XAS. Les méthodes expérimentales et l’instrumen-tation utilisée en spectroscopie XES et XAS sont également décrites.
Le chapitre II est concentré sur les principes de la spectroscopie X en haute-résolution dans le cas d’excitations résonantes et hors-résonance. Les fondements théo-riques de la diffusion élastique résonante de photons ainsi que la nouvelle méthode HEROS y sont présentés. Plusieurs exemples d’application de la méthode HEROS dans différents domaines sont également discutés.
Le chapitre III concerne plus spécifiquement une étude montrant que la méthode HEROS peut être utilisée pour mesurer des spectres d’absorption, lesquels sont dans ce cas insensibles à l’effet d’auto-absorption. Dans la méthode XAS en mode fluorescence, l’intensité des photons de fluorescence est mesurée en variant l’énergie du faisceau pho-tonique incident à travers le bord d’absorption étudié. L’effet d’auto-absorption est dû au fait que le rayonnement de fluorescence de l’échantillon analysé varie rapidement dans le voisinage du bord à cause de la brusque augmentation du coefficient d’absorp-tion à la résonance. Les correcd’absorp-tions à apporter à l’intensité de fluorescence mesurée augmentent avec l’épaisseur et la densité de l’échantillon. Dans la méthode HEROS, l’échantillon est irradié avec un faisceau d’énergie constante fixée au-dessous du seuil d’ionisation d’intérêt. En conséquence, l’effet d’auto-absorption est limité à la proba-bilité de réabsorption du rayonnement de fluorescence émis par l’échantillon, laquelle est quasi-constante pour l’intervalle d’énergie correspondant au spectre d’émission me-suré. Les spectres d’émission collectés au moyen de la méthode HEROS peuvent être ensuite transformés en spectres d’absorption en utilisant le formalisme mathématique de Kramers-Heisenberg. La validité de la méthode HEROS et son indépendance de
Résumé
fet d’auto-absorption sont démontrées à l’aide du spectre d’absorption correspondant au bord L3 du Ta. Les mesures ont été réalisées auprès de la ligne de faisceau SuperXAS de la Source suisse de lumière (SLS) de l’Institut Paul Scherrer (PSI), à Villigen, Suisse. Les spectres HEROS Lα1 ont été mesurés pour neuf feuilles métalliques de Ta d’épais-seur différente. A partir de chaque spectre HEROS, le spectre d’absorption L3 a été reconstruit hors-faisceau. Il est démontré que la forme des spectres d’émission et des spectres d’absorption reconstruits est indépendante de l’épaisseur des échantillons et donc de l’effet d’auto-absorption. Ces résultats ont été publiés dans la revue Physical
Review Letters [1].
Le chapitre IV présente un exemple d’application in situ de la méthode HEROS pour l’étude de la dynamique de réactions chimiques impliquant un catalyseur de Ta sur un support de silice. L’expérience a été réalisée à SLS. Grâce à ses propriétés de ré-solution temporelle, HEROS représente un outil efficace pour l’étude de la dynamique de réactions chimiques non seulement parce que cette méthode permet de sonder la densité d’états inoccupés dans des temps très courts mais aussi parce qu’elle ne néces-site pas de correction des spectres pour l’effet d’auto-absorption, lequel dépend de la densité de l’échantillon et peut donc varier durant la réaction. L’analyse des spectres HEROS mesurés successivement, chacun durant 40 s, pendant la phase d’oxydation des échantillons (complexe de Ta initialement inactif et complexe de Ta activé en atmo-sphère d’hydrogène) a fourni des résultats très intéressants, comprenant par exemple la formation de dimères de Ta produits par réaction avec l’oxygène et la nature progres-sive, par étape, de la transition du catalyseur de Ta inactif vers sa forme oxydée. Cette étude a été publiée dans la revue scientifique Physical Chemistry Chemical Physics [2]. Les résultats présentés dans le chapitre V prouvent que la méthode HEROS peut être utilisée pour des mesures utilisant des faisceaux de photons produits par des lasers X à électrons libres. Dans ce travail, la technique HEROS a été appliquée à l’étude de la structure électronique du cuivre dans différents états d’oxydation. L’expérience a été réalisée à LCLS (LINAC Coherent Light Source,) à Menlo Park, Californie, USA avec un faisceau de photons quasi-monochromatiques obtenu en opérant l’accélérateur dans le mode self-seeding. Les spectres HEROS du Cu1+ obtenus ont été comparés aux spectres d’absorption du Cu0 et Cu2+ présentés dans la Réf. [3] ainsi qu’aux spectres HEROS calculés à partir de spectres XAS de référence et de spectres XAS théoriques reconstruits avec le programme FEFF 9.6. Les résultats montrent que la méthode HEROS permet d’obtenir des informations détaillées sur la structure électronique des échantillons aussi dans le cas de sources de rayons X pulsées de très forte intensité
Résumé
et de très courte durée (femto-seconde). De plus, cette expérience a démontré que la méthode HEROS permet de mesurer un spectre pour chaque impulsion de faisceau, ce qui en fait la méthode de prédilection pour des mesures auprès de sources XFEL car les variations importantes d’intensité entre les différentes impulsions ne touchent que l’intensité globale des spectres HEROS mais pas leur forme spectrale.
Streszczenie
Niniejsza praca doktorska traktuje o metodzie poza-rezonansowej spektroskopii rentge-nowskiej wysokiej rozdzielczości (ang. high energy resolution off-resonant X-ray
spec-troscopy, HEROS), pozwalającej na badanie gęstości stanów nieobsadzonych w pobliżu
progu absorpcji. Metoda HEROS jest alternatywą do istniejących metod rentgenow-skiej spektroskopii absorpcyjnej (ang. X-ray absorption spectroscopy, XAS) i otwiera drogę do dotychczas nieosiągalnych badań.
Metoda HEROS wykorzystuje rentgenowską spektroskopię emisyjną (ang. X-ray
emission spectroscopy, XES) do badania widm fotonów rozproszonych niesprężyście w
warunkach poza-rezonansowych, tzn. gdy energia fotonów rozpraszanych jest niewiele mniejsza od danego poziomu energetycznego atomu. Wykazano, że widma fotonów rozproszonych niesprężyście w warunkach poza-rezonansowych zawierają informację o gęstości nieobsadzonych dyskretnych stanów walencyjnych, jak i nieobsadzonych sta-nów formujących continuum stasta-nów. Pod warunkiem, że rozdzielczość energetyczna wiązki padającej jest mniejsza od naturalnej szerokości energetycznej stanu początko-wego atomu, oraz że pomiar jest wykonany z użyciem spektrometru o wysokiej roz-dzielczości (jak np. spektrometr krystaliczny), metoda HEROS pozwala na określenie gęstości stanów nieobsadzonych z wysoką precyzją. Jest to możliwe, gdyż w proce-sie poza-rezonansowego niesprężystego rozpraszania promieniowania rentgenowskiego struktury widmowe rozproszonych fotonów nie są poszerzone przez czas życia dziury na badanym poziomie energetycznym atomu. W dodatku, w metodzie HEROS badany materiał jest naświetlony monochromatyczną wiązką fotonów o energii poniżej ener-gii danego poziomu energetycznego, a użyty spektrometr, w geometrii von Hámos’a lub Johansson’a i wyposażony w detektor pozycjo-czuły (ang. position sensitive
de-tector), umożliwia mierzenie widm emisyjnych w około
kilkudziesięcioelektronowolto-wym zakresie na raz, bez konieczności jakichkolwiek zmian ustawień wiązki lub układu detekcyjnego. Stąd, rozwiązanie doświadczalne użyte w metodzie HEROS – nie wy-magające zmian położeń elementów optycznych – pozwala na pomiar gęstości stanów
Streszczenie
nieobsadzonych z rozdzielczością czasową ograniczoną jedynie przez wydajność spek-trometru. Analiza struktury elektronowej materiałów z dużą szybkością, umożliwiona przez metodę HEROS, jest wysoce pożądana w badaniach spektroskopowych w cza-sie rzeczywistym, np. w badaniach nad przebiegiem reakcji chemicznych. Ma ona także istotne znaczenie w przypadkach zastosowania impulsowych źródeł promieniowa-nia rentgenowskiego o bardzo wysokiej jasności, takich jak lasery rentgenowskie (ang.
X-ray free-electron lasers, XFELs), w których to przypadkach próbka jest uszkodzona
po każdym pulsie, a duże wahania intensywności pomiędzy pulsami znacząco ograni-czają stosowalność metod XAS. Ponadto, widma zmierzone metodą HEROS nie są dotknięte efektem samoabsorpcji.
Rozdział I jest krótkim wprowadzeniem do spektroskopii rentgenowskiej. Zawiera on zwięzły opis podstawowych zjawisk i wielkości fizycznych związanych z badaniami w spektroskopii emisyjnej i w spektroskopii absorpcyjnej. Opisano w nim również metody doświadczalne oraz aparaturę pomiarową używane w spektroskopiach XES i XAS.
Rozdział II koncentruje się na rezonansowej i poza-rezonansowej spektroskopii rent-genowskiej wysokiej rozdzielczości. Opisano w nim podstawy teoretyczne rezonanso-wego rozpraszania promieniowania rentgenowskiego oraz nową metodę HEROS. Przed-stawiono także przykłady zastosowań metody HEROS w różnych dziedzinach.
Rozdział III jest poświęcony doświadczeniu pokazującemu, że metodę HEROS można użyć do pomiaru widm absorpcyjnych niedotkniętych efektem samoabsorpcji. W spektroskopii XAS w trybie fluorescencji, widmo promieniowania fluorescencyjnego jest mierzone dla energii wiązki padającej o różnych wartościach w zasięgu badanego progu absorpcji. Efekt samoabsorpcji wynika z dużej zmienności współczynnika ab-sorpcji w obszarze rezonansu i nasila się z rosnącymi grubością i gęstością próbki. W metodzie HEROS, widmo emisyjne jest mierzone dla pojedynczej energii wiązki pada-jącej o wartości poniżej danej krawędzi absorpcji. W konsekwencji, efekt samoabsorpcji jest zredukowany do jedynie prawdopodobieństwa reabsorpcji wyemitowanego promie-niowania fluorescencyjnego opuszczającego próbkę, które to prawdopodobieństwo jest zazwyczaj prawie stałe w zakresie mierzonych wartości energii emisji. Widmo emisyjne zmierzone metodą HEROS można następnie użyć do obliczenia widma absorpcyjnego, korzystając z formalizmu matematycznego Kramers’a-Heisenberg’a. Niewrażliwość me-tody HEROS na efekt samoabsorpcji jest pokazana na przykładzie zmierzonych nią widm absorpcyjnych progu L3 tantalu (Ta). Pomiary wykonano na linii SuperXAS synchrotronu Swiss Light Source (SLS) w Paul Scherrer Institute (PSI) w Villigen (Szwajcaria). Za pomocą metody HEROS zmierzono widma emisyjne w obszarze
Streszczenie
gii emisji Lα1 Ta dla dziewięciu próbek tantalowych o różnych grubościach. Otrzymane widma następnie użyto do zrekonstruowania widm absorpcyjnych krawędzi L3 Ta. Za-obserwowano, że kształty krzywych widmowych w widmach zarówno emisyjnych, jak i absorpcyjnych, są niezależne od grubości poszczególnych próbek i zatem od efektu samoabsorpcji. Otrzymane wyniki opublikowano w czasopiśmie Physical Review
Let-ters [1].
W Rozdziale IV opisano przykład zastosowania metody HEROS w doświadczeniu
in situ, mającym na celu zbadanie przebieg reakcji chemicznej z udziałem katalizatora
tantalowego na nośniku krzemionkowym. Doświadczenie przeprowadzono w synchro-tronie SLS. Użyteczność metody HEROS w badaniach nad przebiegiem reakcji che-micznych w czasie rzeczywistym wynika nie tylko z dużej szybkości pomiaru gęstości stanów nieobsadzonych, jaką ta metoda umożliwia. Dużą zaletą metody HEROS jest również jej niewrażliwość na efekt samoabsorpcji, który zależy od stężeń substratów, mogących zmieniać się podczas reakcji. Analiza mierzonych kolejno metodą HEROS widm, każde z czasem akwizycji 40 s, podczas utleniania badanych próbek (nieak-tywny związek Ta oraz związek Ta aktywowany w atmosferze wodoru), dostarczyła kilka ciekawych wyników. Są to np. formowanie się dimerów tantalu oraz etapowy charakter przejścia nieaktywnego katalizatora tantalowego w swoją utlenioną formę. Doświadczenie to opublikowano w czasopiśmie naukowym Physical Chemistry
Chemi-cal Physics [2].
Praca opisana w Rozdziale V pokazuje, że metoda HEROS jest stosowalna w po-miarach z użyciem wiązki fotonowej lasera rentgenowskiego. W pracy tej użyto metodę HEROS do zbadania struktury elektronowej atomów miedzi w różnych stopniach utle-nienia. Pomiary przeprowadzono w ośrodku LCLS (LINAC Coherent Light Source) w Menlo Park (Kalifornia, USA), z wiązką lasera rentgenowskiego pracującego w trybie self-seeding. Widma emisyjne zmierzone metodą HEROS dla Cu1+ porównano z wid-mami otrzymanymi tą samą metodą dla Cu0 i Cu2+ opublikowanymi w Ref. [3] oraz z obliczeniami przeprowadzonymi na podstawie referencyjnych widm absorpcyjnych jak i na podstawie widm absorpcyjnych obliczonych za pomocą programu FEFF 9.6. Pokazano, że metoda HEROS dostarcza szczegółowych informacji o strukturze elektro-nowej badanego materiału również w przypadku użycia bardzo jasnych, impulsowych źródeł promieniowania rentgenowskiego o bardzo krótkim czasie trwania pulsów (fem-tosekundy). W dodatku, przeprowadzone doświadczenie pokazało, że metoda HEROS umożliwia pomiar widm osobno dla każdego pulsu promieniowania z lasera rentgenow-skiego, co czyni ją bardzo atrakcyjną w zastosowaniach ze źródłami XFEL, ze względu
Streszczenie
na znaczne fluktuacje intensywności promieniowania pomiędzy pulsami, które mają wpływ jedynie na całkowitą intensywność mierzonych widm, pozostawiając kształt krzywych widmowych niezmienionym.
Chapter I
Introduction to X-ray spectroscopy
I.1
Introduction
In this chapter a brief introduction to X-ray spectroscopy is presented. X-ray spec-troscopy has a long history and nowadays lively progress in this scientific field is still being made. Books and review articles treating of this subject are published every year. To obtain a profound introduction to the field of X-ray spectroscopy one may wish to refer to e.g. X-ray fluorescence spectrometry (R. Jenkins, 1999) [4] or to X-ray
and inner-shell processes (edited by R. L. Johnson, H. Schmidt-Böcking and B. F.
Sonntag, 1997) [5].
Development of knowledge on the structure of atom at the beginning of 20thcentury was tightly bound with the evolving understanding of the electromagnetic radiation’s nature [6]. Despite the fact that before Wilhelm Röntgen X-rays were already observed, it was he who did a systematic research on X-ray radiation (also referred to as Röntgen
radiation) and inspired new studies at the end of 19th century. Together with Max
Planck’s suggestion in 1900 that electromagnetic radiation is quantized (it comes in discrete amounts) started evolution of quantum mechanics which soon was to break classical understanding (or rather ununderstanding) of the structure of atom. In 1913 Niels Bohr, inspired by Planck’s suggestion and Ernest Rutherford’s nuclear picture of atom from 1911, introduced the planetary model of atom which predicted one quan-tum number. In the same year, in 1913, William Henry Bragg and his son William Lawrence Bragg studied diffraction of X-rays on crystals and Henry Moseley noticed regularities in characteristic X-ray radiation. Two years later Arnold Sommerfeld de-veloped Bohr’s model by additional quantum numbers. Albert Einstein’s work Zur
Quantentheorie der Strahlungfrom 1916 presented quantum mechanical description of
Chapter I: Introduction to X-ray spectroscopy
spatial quantization of atomic electrons’ magnetic momenta. The Compton effect dis-covered in 1922 confirmed that electromagnetic radiation consists of quanta (the term
photonwas introduced by Gilbert Lewis in 1926). The intense development of quantum
theory in the years 1923 – 1928 was crowned by establishing Paul Dirac’s equation. Quantum mechanics around 1930 was already a theory well describing atomic electrons and its further development was focused on nuclear and particle physics.
According to the current state of knowledge, atom is a bound system of nucleus and electrons. Almost whole atom’s mass is concentrated in the nucleus which is composed of neutrons and protons. The atomic number Z, which is equal to the number of nu-clear protons, determines spatial configuration of states around the nucleus occupiable by electrons. This configuration is described by the Schrödinger equation and is not continuous but allows electrons to move around the nucleus only on certain surfaces, on so called orbitals. Electron associated to a given orbital has constant negative en-ergy whereas energies associated to different orbitals, called binding energies or orbital
energies or energy levels, are not the same. Orbitals which are more distant from the
nucleus have lower energies and are more densely located. In materials, such as solids, Coulombic potentials of neighboring atoms’ nuclei overlap forming a continuous band of states allowing electrons to travel freely in the material’s structure. The energy threshold separating the atomic orbitals’ energies from those of the continuum states is called Fermi level. The number of electronic states available on different orbitals and in continuum is usually described with a continuous energy-dependent function called
density of states (DOS).
Motion of atomic electrons is quantized and is described by three parameters: principal n, angular l and magnetic m quantum numbers. The allowed values of n are positive integers, angular quantum numbers l can have values 0, 1, ..., n − 1 and quantum numbers m: −l, −l + 1, .., 0, ..., l − 1, l. Quantum numbers define different orbitals and their energies. Group of orbitals of the same n is called shell and group of the same n and l is termed subshell. If the spin-orbit interaction is considered, the subshells are described by the quantum numbers n, l and j, where j = l +− 1
2. Most common notations used when referring to different orbitals are given by the so called
atomic notation and the notation introduced by the International Union of Pure and
Applied Chemistry (IUPAC) [7] (see Tab. I.1).
Each neutral atom of atomic number Z has Z electrons. Since electrons are fermions, at most two electrons can have the same energy and thus at most two elec-trons can be associated to one orbital. The way the elecelec-trons are distributed among the
Chapter I: Introduction to X-ray spectroscopy
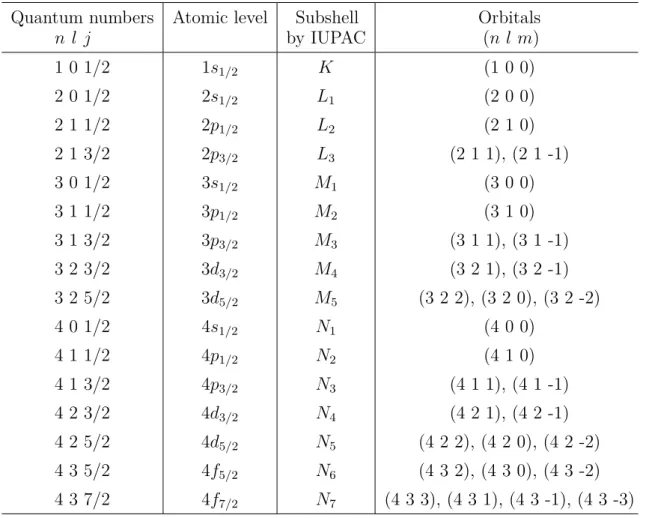
Table I.1: Correspondence between atomic levels, IUPAC subshell notations and associated orbitals.
Quantum numbers
n l j
Atomic level Subshell
by IUPAC Orbitals(n l m) 1 0 1/2 1s1/2 K (1 0 0) 2 0 1/2 2s1/2 L1 (2 0 0) 2 1 1/2 2p1/2 L2 (2 1 0) 2 1 3/2 2p3/2 L3 (2 1 1), (2 1 -1) 3 0 1/2 3s1/2 M1 (3 0 0) 3 1 1/2 3p1/2 M2 (3 1 0) 3 1 3/2 3p3/2 M3 (3 1 1), (3 1 -1) 3 2 3/2 3d3/2 M4 (3 2 1), (3 2 -1) 3 2 5/2 3d5/2 M5 (3 2 2), (3 2 0), (3 2 -2) 4 0 1/2 4s1/2 N1 (4 0 0) 4 1 1/2 4p1/2 N2 (4 1 0) 4 1 3/2 4p3/2 N3 (4 1 1), (4 1 -1) 4 2 3/2 4d3/2 N4 (4 2 1), (4 2 -1) 4 2 5/2 4d5/2 N5 (4 2 2), (4 2 0), (4 2 -2) 4 3 5/2 4f5/2 N6 (4 3 2), (4 3 0), (4 3 -2) 4 3 7/2 4f7/2 N7 (4 3 3), (4 3 1), (4 3 -1), (4 3 -3)
available states is described by the so called Aufbau principle. In a simplified picture, the orbitals’ occupancy is arranged in such a way that the whole system’s potential energy is minimal, which results in fully occupied inner (core) orbitals with usually unoccupied outer (valence) orbitals.
An excited or singly ionized atom with a vacancy in a core level may decay ra-diatively: an outer shell electron fills the inner shell vacancy and a photon is emitted. The energy of the photon is given by the difference of the binding energies of the two atomic levels involved in the transition. If there is a single vacancy in the initial and final state, the transition is named diagram transition. The most probable diagram transitions are E1 transitions, i.e., transitions which satisfy the electric dipole selection rules (∆l = +−1, ∆j = 0, +−1, parity change between the initial and final state wave function ∆π = yes). Different notations are used in the literature for radiative or X-ray transitions. The clearest one consists to define the transition by the subshells where the vacancy is located in the initial and final state, using for the subshells the IUPAC
Chapter I: Introduction to X-ray spectroscopy
notation, e.g. K-L3, or the atomic notation, e.g. 1s-2p3/2. An alternative consists to use the terminology introduced by Siegbahn, e.g. Kα1 instead of K-L3. The most intense K, L and M E1 diagram transitions are presented graphically in Fig. I.1 with their corresponding Siegbahn notation. If there is more than one vacancy in the initial and final state, the X-ray is emitted with a slightly higher energy than the parent dia-gram line. Such X-rays are called satellite X-ray lines, while the additional holes which are not directly involved in the transition are named spectator vacancies. In general, the shift in energy increases with the principal quantum number of the subshell where the transition electron comes from and decreases with the principal quantum number of the spectator vacancy.
Figure I.1: Most intense K, L and M X-ray transitions. The arrows show
electron transition paths (the transitions of the vacancies occur in the opposite directions). The transitions are labeled with their corresponding Siegbahn nota-tion. The vertical axis corresponds to the electrons’ binding energy. The energy spacing of the atomic levels is not at scale.
Atoms can interact with electromagnetic radiation through different processes whose cross sections are predominantly dependent on the radiation energy and atomic
Chapter I: Introduction to X-ray spectroscopy
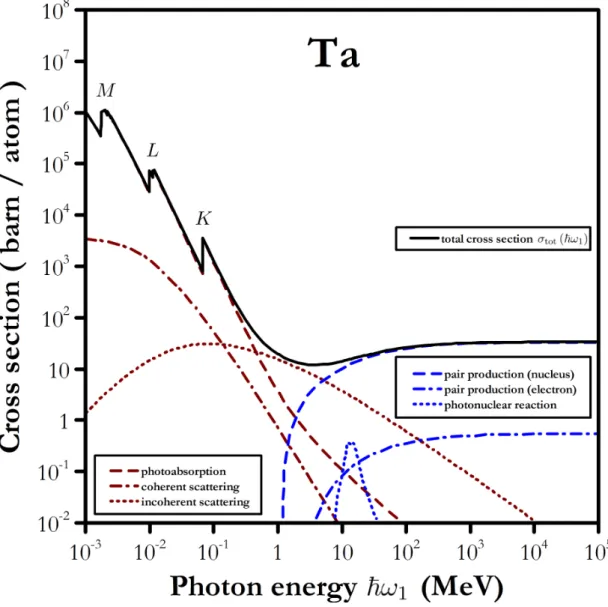
ber Z of the interacting atoms. Cross sections of the possible photon-atom interaction processes are plotted for Ta (Z = 73) as a function of the incident photon energy in Fig. I.2. In photoabsorption, an electron located on an orbital i of energy Ei absorbs the energy ~ω1 of the electromagnetic radiation which results either in its promotion to an unoccupied state located on a higher unoccupied orbital (photoexcitation), or, if the absorbed energy is high enough, i.e. if ~ω1 > |Ei|, the electron (named in this case
Figure I.2: Total cross section σtot for interaction of photons with Ta atoms
(Z = 73) plotted as a function of the incident photon energy ~ω1. Also shown
are the contributions from different processes. The values of the cross section for the photonuclear reaction were taken from Ref. [8] and cross sections for all the remaining interaction processes come from Ref. [9]. Local discontinuities in the σtot(~ω1) dependence, observed for incident beam energy crossing binding
energies of subsequent Ta K-, L-, and M-shell orbitals, are called absorption edges.
Chapter I: Introduction to X-ray spectroscopy
photoelectron) is ejected from the atom (photoionization or photoeffect). The minimum
energy needed to remove an electron on the level i, here denoted by |Ei|, out of an atom is referred to as ionization threshold. Removal of an electron from an orbital leads to the creation of a so called vacancy (or hole) in this orbital, which results into an atom’s excited or ionized state. Photons can be also scattered on atomic electrons through
coherent scattering or incoherent scattering. Coherent (also referred to as elastic or classical) scattering is an elastic collision of photons with inner shell electrons (it is
then described as Rayleigh scattering) or with electrons located on valence orbitals or in the continuum (Thomson scattering). Coherent scattering leaves the atom in its ground state. In incoherent scattering (also known as inelastic scattering or Compton
scattering), a photon scatters on an atomic electron and provides it with a part of
its energy. The scattered photon has different energy than that of the incident pho-ton and propagates along another direction. Incoherent scattering occurs mostly on electrons from valence orbitals and depends smoothly on Z. In the pair production process, the interaction of a photon with the strong electric field of the nucleus or of the electrons causes that photon energy is converted into an electron-positron pair. Due to the energy conservation, pair production can occur only if the photon energy is higher than twice the electron’s rest mass energy (i.e. if ~ω1 > 1.022 MeV). In
photonuclear reaction (also called nuclear photoelectric effect or photodisintegration) a
photon is absorbed by the nucleus which is left in an excited state before decaying via the emission of a γ-ray or internal conversion process.
Interaction of an atom with electromagnetic radiation (or with charged particles) may lead to its ionization. The ion (i.e. the atom with one or more vacancies) deexcites to its ground state through fluorescence or through Auger decay. In fluorescence an electron from a higher level f fills the vacancy with the emission of a photon whose energy ~ω2 is equal to |Ei| − |Ef|. Such a transition leads to the creation of a vacancy in the level f, which is next filled by another electron and so on until all core holes are filled. Fluorescence is thus a spontaneous cascade of radiative atomic deexcitations. In Auger decay the electron transition from the level f to the level i is accompanied by the ejection of another atomic electron (this process is also called radiationless decay). The Auger decay is an autoionizing process since it increases the ionization degree of the atom by one unit. If one of the two vacancies in the final state is in the same shell as the vacancy in the initial state, the Auger transition is named Coster-Kronig (CK ) transition. For instance, if the initial hole in the subshell L1 is filled by a L3 electron with the simultaneous emission of a M5 electron, the transition L1-L3M5 is
Chapter I: Introduction to X-ray spectroscopy
a CK transition. Note that CK transitions are energetically allowed only for certain regions of the periodic table.
I.2
X-ray emission spectroscopy (XES)
X-ray radiation is an electromagnetic radiation of energy in the order of 0.1 – 100 keV (i.e., of wavelengths in the range 10 – 0.01 nm), covering thus the energy range between the ultraviolet and the gamma rays. X-ray spectrometry is the ensemble of methods used to measure X-ray spectra. Depending on their energy, X-rays are usually divided into three categories, namely soft X-rays (below 2 keV), tender X-rays (between 2 keV and ∼ 8 keV) and hard X-rays (above ∼ 8 keV). Application of X-ray spectrometry to study the X-ray radiation emitted from matter through different atomic processes is the scope of the discipline called X-ray emission spectroscopy (XES) [10, 11]. The spectra measured in XES are called X-ray emission spectra or XES spectra.
As mentioned in Section I.1, the creation of a vacancy in any atomic level leads to a cascade of spontaneous electronic deexcitations (fluorescence) governed by the selec-tion rules. The photons emitted in this process are essentially X-rays and XES is used to measure their spectral energy distribution. Creation of a vacancy can be achieved in two ways: by irradiating the investigated material with a beam of X-rays of energy high above the binding energy of a given absorption edge or by bombarding the target with charged particles (electrons, protons or highly charged ions). The latter case is not discussed in this work. XES applied to the detection of X-ray-induced fluorescence is referred to as non-resonant XES (NXES). In NXES studies the excitation photon beam does not need to be of a well defined energy as long as it provides X-rays of energy above the ionization threshold of interest. Fluorescence photons have energies strictly correlated with the energies of the electronic levels involved in the deexcita-tions. Furthermore, for valence-to-core level transitions the intensity of the fluorescent radiation is proportional to the occupancy of the valence orbitals. NXES provides thus an element-specific tool to determine not only the energy differences between the atomic levels but also the density of occupied states.
For illustration, the NXES Cu K X-ray emission spectrum from a CuO sample is depicted in Fig. I.3. Shown are the strong core-to-core Kα1, Kα2 and Kβ1,3 X-ray lines corresponding respectively to the L3-K, L2-K and M3,2-K electron transitions (see Fig. I.1), as well as the weak valence-to-core Kβ2,5 (N2,3-,M4,5-K) and Kβ′′X-ray lines. The intensity ratio of about 2 between the Kα1 and Kα2 lines originates from the number
Chapter I: Introduction to X-ray spectroscopy
of electrons in the 2p3/2 (4) and 2p1/2 (2) levels. The Kβ1,3 line is less intense than the Kα1,2 lines because the overlap between the 1s and 3p levels is smaller than that of the 1s and 2p wave functions, which leads to a smaller transition probability. The spin-orbit doublet Kβ1,3 is not resolved because for Cu the energy separation between the M3 and M2 subshells (2.2 eV) is smaller than the natural width (see below) of the two transitions (about 3.4 eV). The intensity of the valence-to-core X-ray lines is about 1000 times weaker than that of the Kα1,2 lines due to the nearly-vanishing overlap of the wave functions corresponding to the 1s and valence orbitals. Valence-to-core X-ray transitions are nevertheless of interest because valence orbitals are uniquely sensitive to spatial distribution of neighboring atoms. Depending on the chemical surrounding of the fluorescing atoms, the measured valence-to-core emission lines may have different intensities and can be shifted in energy. NXES grants therefore the access to the study of the chemical environment of the fluorescing atoms, in particular the ligand orbitals and bond distances (see e.g. Refs. [12–14]).
Figure I.3: High-resolution K X-ray emission spectrum of Cu from a CuO oxide
sample (taken from Ref. [15]). Transitions involving electrons from the 2p, 3p and valence levels are shown.
The width of a measured X-ray line results from the lifetime broadening of the corresponding transition and the energy resolution of the employed detector. The lifetime broadening is due to the finite lifetimes of the vacancy in the initial and final levels. These finite lifetimes τi and τf lead via the Heisenberg uncertainty principle to some uncertainty ~
τ on the energy of the two levels. As a consequence the energy of the transition will be affected by the uncertainty ∆E = ~
τi +
~
τf. Actually, it can be
Chapter I: Introduction to X-ray spectroscopy
shown that for a given X-ray transition, the energy distribution of the emitted photons corresponds to a Lorentzian function whose width is equal to the uncertainty ∆E. This width is called the natural width of the transition (Γnat). On the other hand, the instrumental response of the detector can be well reproduced in most cases by a Gaussian function. The energy resolution of the detector Γinstr is then given by the full width at half maximum (FWHM) of the Gaussian, i.e., by Γinstr ∼= 2.35 × σinstr, where
σinstr is the standard deviation of the Gaussian. As the convolution of a Lorentzian with a Gaussian results in a so-called Voigt function, the shapes of measured X-ray lines correspond to Voigt profiles. Thus, to extract the natural width of a measured X-ray line, the latter should be deconvolved, using the known instrumental broadening. However, reliable results can only be obtained if the energy resolution of the detector is comparable to the natural linewidth of the transition, which requires the use of high energy resolution instruments such as crystal spectrometers (see Section I.4.2).
X-ray emission has unique properties when the incident photon energy is around a given absorption edge. In this case (resonant regime), X-ray emission can occur via fluorescence or via a coherent absorption-emission process. XES applied in the resonant regime is called resonant XES (RXES) and it is discussed in Section II.3.
I.3
X-ray absorption spectroscopy (XAS)
X-ray absorption spectroscopy (XAS) [16,17] corresponds to an ensemble of
experimen-tal techniques aiming at measuring the absorption of X-ray radiation in materials for changing radiation energy. X-ray absorption spectra (or XAS spectra) represent there-fore the variation of the absorption of the incoming X-ray radiation by the irradiated sample as a function of the radiation energy. The absorption of an X-ray beam of intensity I0 perpendicular to the sample is defined by: Iabs(z) = I0(1 − e−µtotz), where
z stands for the penetration depth of the radiation into the sample and µtot represents the total linear absorption coefficient. The latter depends on the energy of the radiation and on the absorbing material. If the sample thickness or the distance z is expressed in
g
cm2, the total mass absorption coefficient µtotρ , where ρ is the sample density, is
prefer-ably used. For a collimated X-ray beam of energy ~ω1, the total linear absorption coefficient is given by: µtot(~ω1) = σph(~ω1) + σcoh(~ω1) + σincoh(~ω1), where σph,
σcoh and σincoh represent the cross sections for the photoelectric effect and the elastic and inelastic scattering processes, respectively. For the energy range corresponding to X-rays, the cross sections σcoh and σincoh are much smaller than σph and they vary
Chapter I: Introduction to X-ray spectroscopy
only smoothly with ~ω1 so that the overall shape of the absorption spectrum and the characteristic features of the latter originate mainly from the photoeffect process. If the incoming energy ~ω1 is bigger than the electron binding energy of a given subshell, the photoeffect becomes energetically possible, which leads to an abrupt increase of
µtot at this energy. These step-like increases of µtot or Iabs in XAS spectra are called
absorption edges (see Fig. I.2). If the energy ~ω1 of the incoming X-rays is smaller but close to the absorption edge, the photoelectron is no longer removed from the atom but it can be promoted into an unfilled or unoccupied outer level. This so-called
pho-toexcitation gives rise to fine structures that are observed around the absorption edge.
The photoexcitation cross section depends mainly on the occupancy of the valence and interatomic orbitals. As a result, while XES spectra provide information on the den-sity of occupied electronic states, XAS spectra reflect the denden-sity of unoccupied states around and above the Fermi level. In both the photoionization and photoexcitation, the whole photon energy is given to the photoelectron and the photon disappears. For this reason, the term photoabsorption has relevance for photoionization as well as for photoexcitation.
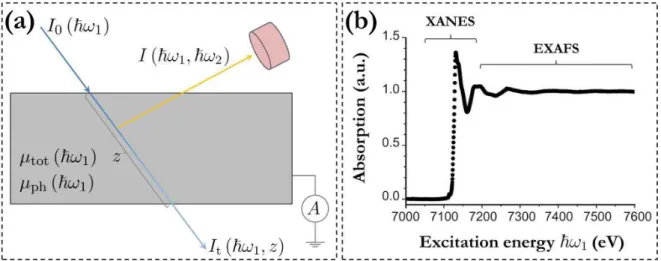
The methods used in XAS are: transmission mode, fluorescence mode (or fluo-rescence yield) and electron yield [19, 20]. Their basic concepts are depicted in Fig. I.4(a). In the transmission mode the studied material is irradiated with an X-ray beam of energy ~ω1 and the intensities of the incident beam I0 and of the transmitted beam
It are measured. Depending on the attenuation length z (which depends on the sam-ple thickness and irradiation angle), the total linear attenuation coefficient µtot can be calculated using the Bouguer-Lambert-Beer law It(~ω1, z) = I0(~ω1) − Iabs(~ω1, z) =
I0(~ω1) e−µtot(~ω1)z. Fluorescence mode XAS makes use of the XES methods, which al-lows to study how the fluorescence intensity I (~ω2) changes with the incident photon energy ~ω1. It has been observed that the fluorescence yield F Y (~ω1, ~ω2) = I(~ωI0(~ω1,~ω1)2) depends on the photoabsorption coefficient µph ∼ σph and its variation in ~ω1 provides the same information as the absorption spectra measured in the transmission mode XAS [19]. The fluorescence mode XAS spectrum can be obtained using either the total fluorescence yield (TFY) or the partial fluorescence yield (PFY). In TFY the fluorescence yield F Y is integrated over a broad emission energy range ~ω2, while in PFY it is integrated over a selected emission energy range. In particular, F Y inte-grated over an energy band centered at a given fluorescence line and narrower than the natural linewidth of the latter is referred to as high resolution XAS (HR-XAS) or high-energy resolution fluorescence detected XAS (HERFD-XAS) [21, 22]. HR-XAS
Chapter I: Introduction to X-ray spectroscopy
Figure I.4: (a) An outline of the XAS methods’ experimental setups. The gray
rectangle symbolizes the studied sample which is made of material characterized by total linear attenuation coefficient µtot and linear photoabsorption coefficient
µph. The blue lines show path of the incident and the transmitted X-ray beams. The orange line marks the exit path of the fluorescence radiation and the detecting system is marked with the pink cylinder. See text for explanation. (b) The K edge XAS spectrum of Fe atoms in a celadon ceramic measured in the fluorescence mode [18]. The region of the absorption spectral curve in a close vicinity of the ionization threshold is termed X-ray absorption near edge structure (XANES) and the one starting from tens of electronvolts above the edge is called extended X-ray absorption fine structure (EXAFS). The most prominent feature in XANES is called white line. The plot in (b) was reproduced from Ref. [18].
spectra provide more detailed information on the µph(~ω1) dependence and is widely used for chemical speciation (see e.g. Refs. [23–26]). The fluorescence lines chosen in HR-XAS measurements are typically the ones induced by the core-to-core electron deexcitations. They are characterized by a much higher intensity as compared to the fluorescence originating from valence-to-core electronic transitions and by a much bet-ter separation in the emission energy scale. In XAS studies done in electron yield (EY) mode, the studied sample is irradiated with an X-ray beam and the electric current in the sample is measured. Interaction with radiation leads indeed to an increase of the number of free electrons in the material, with the main contribution of photoelec-trons and Auger elecphotoelec-trons ejected from the atoms as a result of photoabsorption. The electron yield can be therefore used as a probe of the photoabsorption coefficient and it has been demonstrated that it provides the same information as compared to other XAS methods [20, 27].
Chapter I: Introduction to X-ray spectroscopy
of the X-ray energy (0.1 – 100 keV) has in general a downward trend. Locally absorption grows by jumps as the photon energy crosses subsequent ionization thresholds enabling electrons from consecutive orbitals to undergo photoionization into the continuum. The dependence of the photoabsorption cross section on the incident photon energy (i.e. excitation energy) in the vicinity of an ionization threshold is illustrated in Fig. I.4(b) for the K edge absorption spectrum of iron. As shown, the absorption spectrum is characterized mainly by a sudden jump-like increase of the absorption as the X-ray energy crosses the absorption edge. Furthermore, there are subtle features which arise from a changing density of unoccupied discrete states localized around the Fermi level and above. The fragment of the absorption spectral curve in a close vicinity of the ionization threshold is termed X-ray absorption near edge structure (XANES) or near
edge X-ray absorption fine structure (NEXAFS) or X-ray absorption fine structure
(XAFS). The region extending from tens of electronvolts above the edge is called
extended X-ray absorption fine structure (EXAFS). The XANES features reflect the
density of empty valence states [28]. Analysis of the EXAFS oscillations, which arise from photoexcitation to unoccupied states localized in interatomic orbitals, provides information on the local geometric structure around the absorbing atom [29].
I.4
Instrumentation
I.4.1
Production of X-rays
Production of X-rays that can be used in XES and XAS experiments can be realized in different ways. Commonly employed methods are based on irradiating a given material with charged particles (typically electrons or protons) which induce Bremsstrahlung and fluorescence. In less common approaches a secondary fluorescer is inserted in the primary X-ray beam, which provides a characteristic X-ray radiation of a better defined spectral energy distribution, however, at the cost of the intensity. γ rays from radionuclides (such as 241Am, 109Cd, 153Gd, 155Eu, 145Sm) are also used, both directly and in the secondary fluorescer mode. In this section only production of X-rays with X-ray tubes and synchrotrons is discussed.
An X-ray tube consists mainly of two electrodes placed in a high vacuum and con-nected to a very stable high-voltage generator able to provide voltages of typically 40 – 100 kV. When the generator is on, electrons are emitted by the cathode (which is typi-cally a coil of tungsten wire), accelerated in the electric field between the electrodes and
Chapter I: Introduction to X-ray spectroscopy
impinge the anode, which leads to the emission of Bremsstrahlung and characteristic X-rays whose energy depends on the element the anode is made of. The emitted radi-ation escapes the tube through a sealing window (typically made of beryllium) which absorbs low-energy X-rays. The intensity of the produced photon beam is bigger for higher atomic number Z of the anode material, for higher electric currents and higher voltages. Depending on the experimental conditions, low-power and high-power X-ray tubes are used, capable of working with powers of 0.5 – 1 kW and 2 – 4 kW, respectively. Very low-power compact X-ray tubes are also available (∼ 10 W); in these devices the cathode may be irradiated with a laser beam which leads to the emission of electrons through the photoelectric effect. In the low-power and the high-power X-ray tubes the anode (typically made of Sc, Cr, Cu, Mo, Rh, Ag, W or Au) heats up strongly. To maintain a low and stable temperature the anode element is plated or cemented on a block of copper connected to a water cooling system. The X-ray beam escaping from an X-ray tube is polychromatic, as presented in Fig. I.5(a). Its spectrum contains the continuous distribution of Bremsstrahlung photons (determined by the tube’s voltage) and the discrete emission lines from the anode’s material fluorescence. X-ray tubes are compact and relatively bright X-ray sources and are mainly applied in laboratory setups.
Synchrotrons are highly specialized facilities dedicated to the production of a very bright and monochromatic electromagnetic radiation of energy ranging from tens of eV to hundreds of keV. In synchrotrons an electron beam (in which the electrons are grouped in bunches) is accelerated to GeV-energies and is kept circulating along a storage ring by means of bending magnets. Relativistic electrons pass through mag-netic fields generated by bending magnets and so called insertion devices (wigglers and undulators) installed in the storage ring. Interaction of electrons with the magnetic fields causes change of the electron propagation direction which leads to the emission of electromagnetic radiation. The electromagnetic beam produced at synchrotrons has a pulsed structure with pulse durations ranging typically from picoseconds to nanoseconds. At bending magnets and insertion devices, experimental stations (so called beamlines) are built and equipped with specialized optics used for collimation, monochromatization and focusing of the photon beam. Depending on the photon beam characteristics and equipment installed, different beamlines allow for studies in many specialized scientific fields, such as XAS, X-ray scattering, X-ray diffraction and X-ray imaging to mention a few of them.
Chapter I: Introduction to X-ray spectroscopy
Figure I.5: (a) Spectrum of an X-ray beam produced with an X-ray tube with Cu anode operated at a voltage of 20 kV [30]. The spectrum contains continuous contribution from the Bremsstrahlung photons ending at 20 keV and the discrete Cu Kα1,2 and Kβ1,3 fluorescence lines. The cutoff seen below 3.5 keV is an
effect of absorption of the low-energy X-rays in the tube’s window. The plot was reproduced from Ref. [30]. (b) Comparison of spectral brilliances of different X-ray sources. Below the orange dashed line: X-ray tubes with different anode materials; above: synchrotron’s bending magnets (Bends) and insertion devices. The synchrotron’s spectral brilliances are given for two electron beam energies. The plot was reproduced from Ref. [31].
number of produced photons per unit time, per source size (in the plane transverse to the observation direction) and per unit divergence of the produced photon beam. In case of synchrotrons the observation direction lies in the storage ring’s plane and in the same plane is defined the beam’s divergence. Brilliance is higher for higher rates of the photon production, for smaller photon source sizes and smaller photon beam’s divergences. The spectral brilliance is the brilliance per 0.1 % bandwidth (BW ), i.e., the brilliance divided by 0.1 % of the energy of the produced photons. The spectral brilliance thus grows with increasing monochromaticity of the produced photon beam. From among all the insertion devices used at synchrotrons, undulators have the highest spectral brilliances and, as shown in Fig. I.5(b), the reachable values are in the order of 109 higher than the ones achievable with X-ray tubes. Synchrotrons are 3rd generation X-ray sources while 4th generation sources, the so called X-ray free-electron lasers (XFELs), operate since 2009. XFEL is described more in detail in Section V.2.
Chapter I: Introduction to X-ray spectroscopy
I.4.2
Detection of X-rays
Introduction
Depending on the type of employed detectors, X-ray spectrometry is usually divided into two categories, namely the energy-dispersive and wavelength-dispersive X-ray spec-trometry (EDS and WDS, respectively). In this section a brief description of the in-strumentation used in EDS and WDS is presented. An exhaustive introduction to X-ray spectrometry methods can be found in, e.g., Refs. [32–34].
Energy-dispersive X-ray spectrometry (EDS)
In EDS detectors such as gas counters, scintillators and solid state detectors, the X-ray energy E is converted into a voltage pulse of height V [32, 33]. Such detectors are characterized by the following parameters: quantum counting efficiency, linearity,
pro-portionalityand resolution. Quantum counting efficiency is the ratio of the intensity of
the beam absorbed in the detector to the intensity of the beam incident on it. It reflects therefore the detector’s efficiency. Linearity refers to whether the number of electronic pulses produced by the device is in linear dependence with the incident photon beam intensity. If so, the detector is said to be linear. The detector is proportional if the heights of the produced voltage pulses are linearly dependent on the X-ray energies. Finally, the resolution of the detector is a measure of the scatter ∆V of the output voltage pulses’ heights V induced by the absorption of monoenergetic photons. The rel-ative energy resolution is given by ∆E
E = ∆V
V so that the (absolute) energy resolution of an EDS detector is ∆E = ∆V
V E. The distribution in energy of monoenergetic photons measured with an EDS detector corresponds in most cases to a Gauss function. The energy resolution of the detector is then just equal to the full width at half maximum (FWHM) of this Gaussian. High resolution is important to separate close-lying X-ray lines.
The lowest resolution among commonly used X-ray detectors have scintillation detectors. These devices are composed of two parts: a scintillation material optically coupled to a photomultiplier. The scintillator is typically a sodium iodide crystal doped with thallium. The interaction of X-rays with the scintillator causes the emission of visible light. The photomultiplier converts the pulses of visible light into electronic sig-nals which are next amplified and registered by the connected electronics. Scintillation detectors are proportional and can be used to detect tender and hard X-rays.
Chapter I: Introduction to X-ray spectroscopy
They consist of a cylindrical tube (with few cm-diameter) and a thin wire (with thick-ness of tens of µm) placed inside the tube along its radial axis. The tube is filled with inert gas (typically Ar) mixed with a quench gas (typically methane) and closed on one side by a very thin foil (entrance window) made of an X-ray poorly absorbing material. To compensate the possible loss of gas through the thin window, the gas pressure is kept constant in the chamber by a gas circulation system. An electric po-tential difference of about 1400 – 1800 V is applied between the tube and the wire. An X-ray passing through the gas medium ionizes it and the produced electric charges are separated in the tube by the applied electric field. The separated charges are col-lected on the electrodes, which leads to a short voltage variation that is detected by the connected electronics. Gas flow proportional detectors are mainly used for the de-tection of soft and tender X-rays. Gas detectors provide a few times higher resolution than scintillation detectors. Gas scintillation detectors, combining principles of both scintillators and gas detectors, are also met. These devices consist of a gas tube and a photomultiplier. Recombination of inert gas’ ions created by ionizing radiation causes emission of ultraviolet photons which are next registered by a photomultiplier.
The best resolution in EDS is achieved with solid state detectors. The main part of these devices is a semiconductor diode, made of Si or Ge, to which a reverse bias voltage of about 1000 V is applied, which removes remaining charge carriers. Incoming X-rays ionize the diode’s medium and create hole-electron pairs whose numbers depend on the energies of the absorbed photons. The free electrons are swept from the diode by the reverse bias voltage and collected on the electrodes which build with the semiconductor a small capacitor. The electric charge accommodated on the capacitor is released at a certain frequency and an output voltage pulse is formed whose height depends on the charge collected and thus on the X-ray energy. Solid state detectors are therefore proportional. To keep the dark noise at small values, i.e., to preserve the resolution, solid state detectors must be operated at low temperature. Small size detectors are cooled down using Peltier elements, detectors with bigger volumes (up to some tens of cm3) with liquid nitrogen.
Wavelength-dispersive X-ray spectrometry (WDS)
Detection of X-ray radiation in WDS is done with X-ray spectrometers [34]. X-ray spectrometers are detecting systems composed of a crystal (also called analyzer), which spatially disperses X-rays of different energies through the Bragg diffraction, and a de-tector, which registers the Bragg-diffracted photons. In contrast to EDS, where the
Chapter I: Introduction to X-ray spectroscopy
detectors act as both counters and analyzers, in WDS the measured X-rays are ana-lyzed by the crystal and the detector’s role is reduced to count the spatially dispersed photons. As a result, the spectrometer’s energy resolution depends only on the diver-gence of the incident beam, the crystal’s Darwin width and the diffraction angle. The obtained relative energy resolution ∆E
E is typically of the order of 10
−4, i.e., more than 100 times better than the one of common EDS detectors.
According to the Bragg’s law, photons of energy E will be diffracted by a crystal at a Bragg angle θ meeting the relation E (θ) = h c
2 dhkl
n
sin θ, where h stands for the Planck’s constant, c for the speed of light in vacuum, n (n=1,2,3...) for the diffraction order and dhkl for the spacing of the crystal’s diffraction planes defined by the Miller’s indices (hkl). The Bragg angle θ is the angle between the diffraction planes and the direction of propagation of the incident (or the diffracted) photon beam. Depending on the cut of the crystal, diffraction planes can be parallel to the irradiated surface of the crystal plate or perpendicular to it. In the first case (Bragg case) the WDS is named reflection- or Bragg-type crystal spectrometer, in the second case (Laue case)
transmission- or Laue-type crystal spectrometer.
In Laue-type spectrometers the analyzed X-ray beam has to pass through the crystal’s bulk before it reaches the detector. Since absorption grows drastically with decreasing X-ray energy, transmission-type spectrometers are usually not used for de-tection of photons of energy below about 15 keV. On the other hand, design of the Bragg-type spectrometers restricts the range of usable reflection angles to above 20◦, which corresponds to photon energies below 7 – 12 keV (note that E (θ) ∼ sin−1θ).
The crystals used in X-ray spectrometers are plane or curved and single- or multiple-crystal arrangements can be employed. Plane-multiple-crystal spectrometers provide the best resolution but are extremely inefficient because of the tiny diffracting area of the crystal which can cover only very small solid angles with respect to the X-ray source. With curved crystal spectrometers the diffracting area is much bigger but the correspond-ing increase of the solid angle is attenuated by the larger distance between the X-ray source and the crystal. This distance is indeed in the same order of magnitude as the radius of curvature and the latter cannot be too small (typically 20 cm – 300 cm) to preserve a curvature of good enough quality. In addition the limited crystal’s reflectiv-ity and, in the Laue case, the absorption in the crystal of the incoming and diffracted radiation contribute to further diminish the spectrometer’s efficiency. Curved-crystal spectrometers have a slightly worse resolution as compared to plane-crystal setups.
Chapter I: Introduction to X-ray spectroscopy
are distinguished, depending on whether the crystals used are bent in the dispersive or nondispersive plane. In the former case, a Johann [35] or Johansson geometry [36] can be used, whereas the latter case corresponds to the von Hámos geometry [37]. In the geometries of Johann and Johansson, since the analyzing crystal is bent in the dispersive plane, the focusing on the detector (in these geometries the detector serves only to count the diffracted photons) is realized only if the X-ray source, the crystal and the detector are placed on the so-called Rowland circle whose radius is half the one of the crystal’s curvature. In these point-to-point focusing geometries photons of only one energy can be focused for a given Bragg angle so that an X-ray spectrum has to be scanned by varying the angle of both the crystal and detector step by step. As a result, measurements of X-ray spectra with spectrometers in the standard Johann’s or Johansson’s geometry are time consuming. This problem is not encountered with the von Hámos spectrometer equipped with a position sensitive detector (PSD). In this case, X-ray spectra covering energy ranges of typically tens of eV can be recorded in one shot. It can be noted here that Johann and Johansson spectrometers equipped with a PSD and operated with a defocused source can also collect photons within a certain energy range at once [38].
Comparison between EDS and WDS
The relative resolutions and useful energy ranges of different energy-dispersive X-ray de-tectors are presented in Tab. I.2. The resolution of a Bragg-type wavelength-dispersive spectrometer equipped with different crystals is also given for comparison. Because of their poor resolution, scintillation and gas detectors are usually used as counters, i.e., for measurements of X-ray beam intensities. In particular, gas detectors are commonly used for monitoring the intensity of synchrotron radiation beams, in transmission mode XAS measurements and in wavelength-dispersive spectrometers with a point-to-point focusing geometry. Solid state X-ray detectors are characterized by a broad energy range detection (few to tens of keV) and have a much better resolution as compared to scintillators and gas detectors. They allow the simultaneous measurement of many fluorescence lines within a short collecting time and are frequently used to determine the chemical composition of complex samples.
WDS instruments are not as flexible as EDS detectors in terms of covered energy ranges (in general different crystals are needed to cover different energy ranges). They are also less efficient and more complicated to operate but their energy resolution and their precision are far beyond those of EDS detectors.
Chapter I: Introduction to X-ray spectroscopy
Table I.2: Comparison of useful energy ranges and resolutions between different types of X-ray energy-dispersive detectors and a Bragg-type crystal spectrometer. The resolutions are given for the energy of the Kα fluorescence of Cu (8.04 keV). The useful energy ranges and resolutions of the EDS detectors were taken from Ref. [32]. The spectrometer’s resolutions were calculated with the XOP program [39]. Only the contribution of the Darwin’s width was considered. The useful energy range quoted for the crystal spectrometer requires the use of several different crystals.
Detector type Useful energy range (keV) Resolution ∆E E Energy-dispersive detectors
Scintillation 6 – 60 4 × 10⁻¹
Gas flow proportional 0.2 – 8 1 × 10⁻¹
Solid state (Si(Li)) 1.5 – 25 2 × 10⁻²
Wavelength-dispersive spectrometers (Bragg-type) 1 – 15 LiF(200) 8 × 10⁻⁵ LiF(220) 3 × 10⁻⁵ Si(111) 1 × 10⁻⁴ Si(333) 1 × 10⁻⁵ Si(444) 6 × 10⁻⁶ Ge(220) 2 × 10⁻⁴ Ge(440) 3 × 10⁻⁵
![Figure I.5: (a) Spectrum of an X-ray beam produced with an X-ray tube with Cu anode operated at a voltage of 20 kV [30]](https://thumb-eu.123doks.com/thumbv2/123doknet/14967190.670823/34.892.167.701.114.430/figure-spectrum-beam-produced-tube-anode-operated-voltage.webp)
![Figure II.5: Measurements on the CuO compound performed by Hayashi et al. [55]. (a) Emission spectra recorded in the Cu Kα 1 energy range for four different incident beam energies fixed below Cu K edge binding energy](https://thumb-eu.123doks.com/thumbv2/123doknet/14967190.670823/52.892.126.748.185.585/measurements-compound-performed-hayashi-emission-recorded-different-incident.webp)
![Figure II.6: Evolution of Pt Lα 1 HEROS spectra during decomposition in hydrogen of the platinum(II) acetylacetonate complex Pt(acac) 2 at a temperature of 150 ◦ C [60]](https://thumb-eu.123doks.com/thumbv2/123doknet/14967190.670823/53.892.162.757.646.891/figure-evolution-spectra-decomposition-hydrogen-platinum-acetylacetonate-temperature.webp)
![Figure II.8: Experimental spectroscopic data on gaseous xenon obtained with HEROS [61]](https://thumb-eu.123doks.com/thumbv2/123doknet/14967190.670823/55.892.189.722.765.943/figure-experimental-spectroscopic-data-gaseous-xenon-obtained-heros.webp)
![Figure III.2: (a) The Co L 3 -edge absorption spectrum measured with the elec- elec-tron yield and the fluorescence yield for two incident angles: 27 ◦ and 85 ◦ [80]](https://thumb-eu.123doks.com/thumbv2/123doknet/14967190.670823/62.892.126.742.114.448/figure-absorption-spectrum-measured-yield-fluorescence-incident-angles.webp)