HAL Id: hal-03154257
https://hal.archives-ouvertes.fr/hal-03154257
Submitted on 27 Feb 2021HAL is a multi-disciplinary open access
archive for the deposit and dissemination of sci-entific research documents, whether they are pub-lished or not. The documents may come from teaching and research institutions in France or abroad, or from public or private research centers.
L’archive ouverte pluridisciplinaire HAL, est destinée au dépôt et à la diffusion de documents scientifiques de niveau recherche, publiés ou non, émanant des établissements d’enseignement et de recherche français ou étrangers, des laboratoires publics ou privés.
Distributed under a Creative Commons Attribution| 4.0 International License
and Sediment Profile Image Characteristics in a
High-Energy Temperate Marine RiOMar: The West
Gironde Mud Patch
Bastien Lamarque, Bruno Deflandre, Adriana Galindo Dalto, Adriana Dalto,
Sabine Schmidt, Alicia Romero-Ramirez, Frédéric Garabetian, Nicolas
Dubosq, Mélanie Diaz, Florent Grasso, et al.
To cite this version:
Bastien Lamarque, Bruno Deflandre, Adriana Galindo Dalto, Adriana Dalto, Sabine Schmidt, et al.. Spatial Distributions of Surface Sedimentary Organics and Sediment Profile Image Characteristics in a High-Energy Temperate Marine RiOMar: The West Gironde Mud Patch. Journal of Marine Science and Engineering, MDPI, 2021, Journal of Marine Science and Engineering, 9 (3), pp.242. �10.3390/jmse9030242�. �hal-03154257�
J. Mar. Sci. Eng. 2021, 9, 242. https://doi.org/10.3390/jmse9030242 www.mdpi.com/journal/jmse
Article
Spatial Distributions of Surface Sedimentary Organics
and Sediment Profile Image Characteristics in a High-Energy
Temperate Marine RiOMar: The West Gironde Mud Patch
Bastien Lamarque 1,*, Bruno Deflandre 2, Adriana Galindo Dalto 3, Sabine Schmidt 2, Alicia Romero-Ramirez 1, Frédéric Garabetian 1, Nicolas Dubosq 2, Mélanie Diaz 2, Florent Grasso 4, Aldo Sottolichio 2, Guillaume Bernard 1, Hervé Gillet 2, Marie-Ange Cordier 2, Dominique Poirier 2, Pascal Lebleu 2,†, Hervé Derriennic 2, Martin Danilo 2, Márcio Murilo Barboza Tenório 3 and Antoine Grémare 1
1 UMR EPOC, Université de Bordeaux, CNRS, UMR 5805, Station Marine d’Arcachon,
2 rue du Professeur Jolyet, F33120 Arcachon, France; [email protected] (A.R.-R.); [email protected] (F.G.); [email protected] (G.B.);
[email protected] (A.G.)
2 UMR EPOC, Université de Bordeaux, CNRS, UMR 5805, Bâtiments B18/B18N, Allée Geoffroy Saint-Hilaire,
CEDEX, F33615 Pessac, France; [email protected] (B.D.); [email protected] (S.S.); [email protected] (N.D.); [email protected] (M.D.);
[email protected] (A.S.); [email protected] (H.G.);
[email protected] (M.-A.C.); [email protected] (D.P.); [email protected] (P.L.); [email protected] (H.D.);
[email protected] (M.D.)
3 Departamento de Biologia Marinha, Instituto de Biologia, Universidade Federal do Rio de Janeiro,
Rio de Janeiro CEP 21941-902, Brazil; [email protected] (A.G.D.); [email protected] (M.M.B.T.)
4 IFREMER Brest—DYNECO/DHYSED, Centre de Bretagne, CS 10070, 29280 Plouzane, France;
* Correspondence: [email protected]
† Deceased.
Abstract: The spatial distributions of (1) surface sediment characteristics (D0.5, Sediment Surface Area (SSA), Particulate Organic Carbon (POC), Chlorophyll-a (Chl-a), Phaeophytin-a (Phaeo-a), Total and Enzymatically Hydrolyzable Amino Acids (THAA, EHAA), δ13C) and (2) sediment profile image (apparent Redox Potential Discontinuity (aRPD), numbers and depths of biological traces) characteristics were quantified based on the sampling of 32 stations located within the West Gironde Mud Patch (Bay of Biscay, NE Atlantic) in view of (1) assessing the spatial structuration of a temperate river-dominated ocean margin located in a high-energy area, (2) disentangling the impacts of hydrodynamics and bottom trawling on this structuration, and (3) comparing the West Gironde Mud Patch with the Rhône River Prodelta (located in a low-energy area). Results support the subdivision of the West Gironde Mud Patch in a proximal and a distal part and show (1) the existence of depth gradients in surface sedimentary organics characteristics and bioturbation within the distal part; (2) no evidence for a significant effect of bottom trawling, as opposed to Bottom Shear Stress, on the West Gironde Mud Patch spatial structuration; and (3) major discrep-ancies between spatial structuration in the West Gironde Mud Patch and the Rhône River Prodelta, which were attributed to differences in tidal regimes, sedimentation processes, and local hydro-dynamics, which is in agreement with current river-dominated ocean margin typologies.
Keywords: RiOMar; surface sediment; spatial distribution; sedimentary organics; bioturbation
1. Introduction
Continental margins are the interface between land and the open ocean, where 50 to 80% of continental Particulate Organic Carbon (POC) inputs are mineralized [1–3]. Less
Citation: Lamarque, B.; Deflandre, B.; Dalto, A.G.; Schmidt, S.; Romero-Ramirez, A.; Garabetian, F.; Dubosq, N.; Diaz, M.; Grasso, F.; Sottolichio, A.; et al. Spatial Distributions of Surface Sedimentary Organics and Sediment Profile Image Characteristics in a High-Energy Temperate Marine RiOMar: The West Gironde Mud Patch. J. Mar. Sci. Eng. 2021, 9, 242. https://doi.org/10.3390/jmse9030242 Academic Editor: Antoni Calafat Received: 14 December 2020 Accepted: 2 February 2021 Published: 24 February 2021 Publisher’s Note: MDPI stays neutral with regard to jurisdictional claims in published maps and institutional affiliations.
Copyright: © 2021 by the authors. Licensee MDPI, Basel, Switzerland. This article is an open access article distributed under the terms and conditions of the Creative Commons Attribution (CC BY) license (http://creativecommons.org/licenses /by/4.0/).
than 5% of these inputs are transferred to the deep ocean [4], the remaining part being buried in continental margin sediments. River-dominated ocean margins (RiOMars), de-fined as margins impacted by major rivers freshwater and/or sediment discharges (e.g., plumes of Amazon, Yangtze or Mississippi Rivers), are the main marine primary depo-sitional areas of riverine particulate continental inputs [2,5]. They account for 40 to 50% of continental POC burial occurring in continental margins [2,3,6]. Burial is tightly cued by biogeochemical processes taking place at the water–sediment interface [3,5,7]. Therefore, assessments of the structuration and functioning of the benthic components of marine RiOMars are key issues to reach a comprehensive understanding of the marine contribu-tion to global biogeochemical cycles [1,3].
Benthic macrofauna plays a major role in the biogeochemistry of the top centimeters of the sediment column through bioturbation (i.e., sediment mixing and bioirrigation [8]). This includes both changes in the spatial distribution and the temporal dynamics of electron acceptors, which influence mineralization fluxes [9–11]. Mostly based on the analysis of macrofauna vertical distribution within the sediment column and X-rays ra-diographies, Rhoads et al. [12] first proposed a conceptual model describing the response of macrofauna and surface sediments to the inputs of major rivers. According to this model, macrofauna spatial distribution is mainly determined by (1) physical disturbance induced by intense continental inputs, and (2) reduction in Particulate Organic Matter (POM) availability due to the limitation of primary production in turbid river plumes. In proximal (i.e., the closest to the river mouth) parts of RiOMars, high and irregular sedi-mentation rates induce sedimentary instability, precluding the establishment of mature macrobenthic communities. Moreover, high turbidity limits primary production and results in mainly low (and refractory) POM concentrations in surface sediments. Ac-cordingly, RiOMar proximal areas are characterized by low bioturbation intensities and low mineralization fluxes. Conversely, in distal (i.e., deeper) parts, sedimentation is lower and primary production is higher, allowing for the establishment of mature mac-robenthic communities, high bioturbation intensities, and mineralization fluxes.
Several studies have compared RiOMars based on either the characteriza-tion/quantification of geomorphological [5] or biogeochemical [3] processes. Their results highlighted the major effect of energetic regimes on RiOMar morphologies [5] and POC mineralization/burial intensities [3]. This later study drew a clear distinction between (1) low-energy systems, with both significant sedimentation rates and carbon preservation (later referred as type 1), and (2) high-energy tidal and/or wave systems with both high sediment oxygenation and low carbon preservation rates (later referred as type 2). It ev-idenced that the spatial distributions of the benthic components of RiOMars are cued by both riverine inputs and marine hydrodynamics. This categorization was mostly based on tropical/subtropical systems, the Rhône River being the only major (type 1) considered temperate RiOMar. Moreover, both studies considered RiOMars and their continuity with fluvial systems in their entirety, even though McKee et al. [5] underlined the interest of differencing RIOMAR sub-environments and comparing RiOMar types. Thus, there is still a clear need to document the spatial structuration of a potential temperate type 2 RiOMar and to compare it with a temperate type 1 one.
Together with the bottom shear stress induced by both waves and bottom currents, bottom trawling is contributing to control sediment resuspension in coastal areas [13–20]. As such, it can deeply affect surface sediments, benthic macrofauna and bioturbation [13,21–24]. RiOMar mud fields are organically enriched as compared to surrounding sediments and often constitute preferential fishing areas [19,20]. Therefore, it is also im-portant to unravel the role of both hydrodynamics and bottom trawling in controlling the structuration of benthic ecosystems in RiOMars.
The present study is aiming at (1) improving current knowledge regarding the spa-tial structuration of a potenspa-tial temperate type 2 RiOMar, (2) disentangling the potenspa-tial effects of hydrodynamics and bottom trawling in controlling this structuration, and (3) comparing this spatial structuration with the one of a type 1 temperate RiOMar (i.e., the
Rhône River Prodelta [3]). It is based on the synoptic sampling of a large number of sta-tions and the quantitative analysis of (1) surface sediment characteristics and (2) Sedi-ment Profile Images (SPI).
2. Materials and Methods
2.1. The West Gironde Mud Patch
The West Gironde Mud Patch (WGMP) is a 420 km2 sedimentary body located in the
Bay of Biscay 40 km off the Mouth of the Gironde Estuary (Figure 1). This relict pale-ovalley/depression constitutes the primary depocenter (sedimentation rates between less than 1 and 5 mm·y−1 [25,26]) of fine particles originating from the Gironde Estuary, which
presents an annual mean water discharge of 944 m3·s−1 [27] and daily discharge up to 7500
m3.s−1 during wintertime [28]. The WGMP is located in a macro-tidal environment with a
tidal range from 1.5 to 5 m [26,29]. The continental shelf around the Mouth of the Gironde Estuary is dominated by strong swells/waves, which can reach maximal amplitudes of 15 m and time periods of 15 s during winter storms [30]. These hydrological conditions prevent the sedimentation of fine particles in the immediate vicinity of the Mouth of the Estuary. Therefore, the WGMP can a priori be considered as a potential temperate type 2 RiOMar [5]. The sedimentology of the WGMP has been extensively studied based on stratigraphic sequences, palynological data, X-rays radiographies, and radiochronogra-phies [25,26,31–38,39–43]. Sedimentological surveys have attributed a major role to hy-drodynamics in controlling the spatial structuration of the WGMP [25,26,35,38,42]. This paradigm was based on both (1) the segmentation between a proximal and a distal part with no modern persistent sedimentation in the former due to strong hydrodynamics, and (2) the decreasing frequency of occurrence of vertical erosional sequences within the sediment column with station depth. The occurrence of spatial zonation in the distal part has also been addressed [25,26,35,38,42] but without reaching a clear conclusion due to a limited number of sampled stations and to the lack of a fine quantitative assessment of bioturbation. Benthic macrofauna composition and associated biogeochemical processes have been largely neglected as well, with only two studies based on the sampling of a limited number of stations [44,45]. The WGMP is a preferential fishing area [46] where several benthic species are commercially exploited, including the Norway lobster (Nephrops norvegicus) and the common sole (Solea solea). Bottom trawls are commonly deployed in the area [46], and it has been suggested that their use may constitute a sig-nificant source of disturbance for benthic habitats [26,38,47]. Based on Vessel Monitoring System data, Mengual et al. [19,20] showed that the Benthic Trawling Effort (BTE) in the WGMP can be locally intense (up to 10 times trawled·y−1) and seems to increase with
Figure 1. Map showing the location of the West Gironde Mud Patch along the French Atlantic coast, the locations of the
32 sampled stations, and the depth gradient sampled for X-ray radiographies and amino acids. The delimitation of the West Gironde Mud Patch (WGMP) is based on the acoustic measurements achieved during the JERICOBENT-5-TH cruise [48] and the surface sediment granulometry assessed during the present study [49].
2.2. Sampling of Surface Sediment and Sediment Profile Images
This study is based on samples collected during the JERICOBENT-5 cruise [49], which took place in June 2018 on board of the R/V Côtes de la Manche. Thirty-two sta-tions located between 32.5 and 78 m depth, and allowing for a full coverage of the WGMP were sampled for both surface sediment characteristics and Sediment Profile Images (SPIs; Figure 1, Table A1). At each station, a sediment core (10 cm internal diameter) was collected using an Uwitec® (Mondsee, Austria) monotube-corer. The upper top
centime-ter (i.e., 0–1 cm depth layer) was carefully extruded and split in two subsamples imme-diately frozen (−20 °C) for further analyses of (1) grain size, Sediment Surface Area (SSA; [50]), Particulate Organic Carbon (POC), and OC isotopic ratio; and (2) chloropigments. Total and Enzymatically Hydrolyzable Amino Acids (THAA and EHAA) were assayed at 11 stations distributed along a depth gradient (see Figure 1). At these stations, a second core was collected for X-rays radiographies (SCOPIX system; [51]). EHAA were not as-sayed at station J due to a technical problem. At all stations, between 4 and 8 SPIs were taken (at stations PL and J, respectively) using a sediment profile imager (Ocean Imaging Systems®, Pocasset, USA) [52] fitted with a D7100 camera (Nikon®, Tokyo, Japan). 2.3. Analysis of Surface Sediment Characteristics
Grain size was measured on duplicated aliquots of each sediment sample using a Master Sizer laser microgranulometer (Malvern Panalytical®, Malvern, UK), which
al-lowed for the computation of median diameter (D0.5). SSAs were measured on
freeze-dried sediments, previously degassed overnight at 150 °C, using a Gemini VII 2390 Series Surface Area Analyzer (Micromeritics®, Norcross, USA) with the multi-point
USA) CS 200 analyzer, after 2M HCl overnight decarbonatation of previously freeze-dried sediments [53].
THAA and EHAA were analyzed on duplicates. THAA were extracted by acid hy-drolysis. EHAA were extracted following the biomimetic approach proposed by Mayer et al. [54]. THAA and EHAA were analyzed by derivation to form fluorescent amino compounds with the presence of the thiol 3-mercaptopropionic acid (MPA). Fluorescent derivatives were separated by reverse-phase High-Performance Liquid Chromatography (Agilent®, Santa Clara, USA; 1260 INFINITY model) on a Phenomenex® (Torrance, USA)
Kinetex 5 µm EVO C18 column using non-linear gradient of methanol–acetate buffer (pH = 7, 40 mM), and detected by fluorescence from 340 to 450 nm using an excitation wave-length of 338 nm. The EHAA/THAA ratio was used as a lability index of bulk sedimen-tary organics [55–57].
Chlorophyll-a (Chl-a) and Phaeophytin-a (Phaeo-a) were assayed on thawed frozen (−20 °C) sediment after overnight acetone extraction (90% final concentration) using a Perkin Elmer® LS-55 spectrofluorometer following Neveux and Lantoine [58]. Pigment
data are lacking for station BK due to sample loss. All organic concentrations were nor-malized for SSA (i.e., expressed in terms of mass per SSA). The Chl-a/(Chl-a + Phaeo-a) ratio was used as a lability index of vegetal biomass [55,56].
For the analysis of OC isotopic ratio, replicated freeze-dried sediment samples were decarbonated (1M HCl) and later analyzed using a Thermo Scientific® Delta V plus IRMS
coupled with a Thermo Scientific® (Waltham, USA) Flash 2000 EA. Raw measurements
were converted in usual δ13C units [59]. 2.4. Analysis of Sediment Profile Images
Individual SPI were analyzed for (1) apparent Redox Potential Discontinuity (aRPD) thickness, (2) numbers of biogenic structures (tubes, burrows, oxic voids, feeding pits), (3) numbers of epi- and infauna, and (4) maximal depths of oxic voids within the sedi-ment column. For the stations presenting a surface sandy layer, the upper limit for the computation of aRPD thickness was set below the transient top coarser sediment layer. Image analyses were achieved using the SpiArcBase software [60] and mean values and standard deviations were computed for each station. In addition, all SPIs were visually inspected for the presence of potential traces of bottom trawling. This included the presence of clasts and furrows [61,62], and of a surface puzzle fabric [63].
2.5. Spatial Distribution of Bottom Shear Stress and Trawling Effort
The spatial distribution of Bottom Shear Stress (BSS) was computed from a tridi-mensional numerical model deployed and validated over the study area [64]. This model, stretching from the Gironde Estuary to the continental shelf, is based on the MARS3D hydrodynamic model [65] and the WAVE WATCH III® wave model [66]. Its curvilinear
mesh resolution is approximately 0.5 × 0.5 km2 over the WGMP. The model integrates
realistic hydro-meteorological forcing (i.e., wind, tide, surge, and river flow). BSS was computed as the combination of current-induced and wave-induced components fol-lowing Soulsby’s formulation [67]. A more detailed description of the model can be found in Grasso et al. [68]. Simulations achieved during the present study provided hourly outputs over the whole year preceding the JERICOBENT-5 cruise. In order to ac-count for intense hydrodynamic events, 95th percentiles were used to characterize BSS intensities.
The spatial distribution of Bottom Trawling Effort (BTE), within and around the WGMP, was assessed based on vessel Automatic Identification System (AIS) data col-lected by Global Fishing Watch [69,70]. Raw (daily) BTE were available with a 1/100 de-gree (corresponding to 1.77 km2 cells) spatial resolution. For each cell, daily BTE were
summed over the whole year preceding the JERICOBENT-5 cruise. Summed BTE were expressed both in terms of h.km−2.y−1 and number of times trawled.y−1. The conversion
2.6. Analysis of WGMP Data
2.6.1. Sediment Characteristics and Sediment Profile Images
For both sediment (i.e., SSA, POC, Chl-a, Phaeo-a, Chl-a/(Chl-a + Phaeo-a) ratio and δ13C) and SPI (i.e., aRPD thickness; maximal oxic void depth; mean numbers of tubes,
burrows, oxic voids, feeding structures, epifauna and infauna) characteristics, hierar-chical clustering (Euclidean distance and average group linking) and Principal Compo-nents Analyses (PCAs) were used to define groups of stations and to assess relationships between variables. THAA, EHAA, and EHAA/THAA ratios were not included, since data were missing at some stations. Station depth, BSS, and BTE were introduced as supplementary variables in both PCAs. SIMilarity PROFile procedures (SIMPROF; [71]) were used to test for the statistical significance of differences between station groups re-sulting from hierarchical clustering. SIMilarity PERcentage analysis (SIMPER; [72]) was used to identify the SPI characteristics contributing the most to between-group differ-ences. All analyses were run on normalized data using the PRIMER® 6 software package
[73].
Multivariate analyses supported the distinction between a proximal and a distal part in the WGMP (see Section 4.1). Simple linear regression models were used to assess the significance of the relationships between station depth and both surface sediment and SPI characteristics in the whole WGMP and in the sole distal part to avoid confounding effects resulting from (1) the high between-station variability in the proximal part and (2) major differences in sediment and SPI characteristics between parts. The same approach was used to assess the significance of the relationships between station depths and their coordinates on the first component of both PCAs.
2.6.2. Bottom Shear Stress and Trawling Effort
BSS 95th percentiles and summed BTE were mapped using the ArcGIS Desktop®
10.6 software. The relationships between BSS 95th percentiles, summed BTE within cells containing sampled stations, and (1) station depth, (2) surface sediment characteristics, and (3) SPI characteristics were assessed using simple linear regression models at the scale of the whole WGMP and/or its sole distal part. Multiple linear regression models were used to test for additive effects of BSS and BTE.
2.7. Comparisons with the Rhône River Prodelta
The Rhône River Prodelta (RRP) is a ca 265 km2 [74] depositional system, located in
the Gulf of Lions (North Mediterranea Sea). It is supplied with particles from the Rhône River, which presents a mean annual water discharge of 1700 m·s−1 and massive flood
events (i.e., up to 11,000 m3·s−1; [75]). The RRP is located in an environment with
mi-cro-tidal conditions (i.e., maximal tidal range of 0.4–0.5 m) and wave mean heights of 1– 1.5 m [76]. During winter storms, wave heights can exceptionally reach 3–4 m, with pe-riods of about 6–7 s [77,78]. These conditions allow for the sedimentation of fine particles at the immediate vicinity of the river mouth. Sedimentation rates are about 40 cm·y−1 in
the proximal part (i.e., 5–30 m depth) of the RRP and between 1 and 10 cm·y−1 in its distal
part (30–100 m depth; [74,79,80]). According to the classifications established by McKee et al. [5] and Blair and Aller [3], the RRP therefore constitutes a low-energy (type 1) tem-perate RiOMar in direct continuity with the Rhône River.
WGMP results collected during the present study were compared with those origi-nating from the Chaccra cruise (April 2007), which took place in a comparable situation in terms of river flows [56] and during which the same parameters (i.e., D0.5, POC,
chlo-ropigments, THAA, EHAA, δ13C, and SPI characteristics) were measured at 7–10 stations
located in the RRP [56,81,82]. Since modern sedimentation was shown to be restricted to the distal part of the WGMP (see above), the comparison was achieved between the sole WGMP distal part and the whole RRP. All organic concentrations were expressed in terms of sediment DW (eventually standardized for D0.5), since no SSA data were
availa-ble for the RRP. For the same reason, we used mean instead of maximal oxic void depth. Mean values of WGMP and RRP characteristics were compared using one-way ANO-VAs.
3. Results
3.1. Surface Sediment Characteristics
Except for two stations (i.e., stations 0 and 10), all particle size distributions were unimodal. There were marked differences in surface median sediment grain size (D0.5)
among shallow stations (Figure 2A). D0.5 was minimal at station AV (13.5 µm) and
maximal at station 0 (64.6 µm). Conversely, deep stations featured a narrower range (i.e., between 14.9 and 24.8 µm at stations 7 and 2, respectively) of D0.5. Sediment Surface Area
(SSA) was also more dispersed at shallow stations (i.e., between 3.4 and 14.2 m2·gDW−1 at
stations AW and AV, respectively) (Figure 2B) than at deep stations (i.e., between 6.1 and 9.8 m2·gDW−1 at stations 2 and 4, respectively).
Figure 2. Relationships between station depth and: D0.5 (A); Sediment Surface Area (SSA; (B)). Gray areas represent the proximal part (z < 42.5 m) of the WGMP. Station codes are the same as in Figure 1 and Table A1. Statistical results refer to the sole WGMP distal part.
At the scale of the whole WGMP, SSA significantly decreased with increasing D0.5
following an exponential model (y = 4.268 + 51.982 × e - 0.134x; n = 32, R2 = 0.830, p < 0.001).
D0.5, all surface sediment organic concentrations and Chl-a/(Chl-a + Phaeo-a) ratio (Table
A1) correlated significantly with station depth, which was not the case for SSA and δ13C
(Table A2). When considering only the distal part (see Section 4.1 for the delimitation between the proximal and distal parts), the correlations between station depth, D0.5,
Chl-a, and Chl-a/(Chl-a + Phaeo-a) were not significant (Table A2).
Particulate Organic Carbon (POC) concentrations were between 0.50 and 2.06 mg.m-2 at stations AV and J, respectively. POC correlated positively with depth in the
distal part of the West Gironde Mud Patch (WGMP; Figure 3A, Table A2). Total Hydro-lyzable Amino Acid (THAA) concentrations were between 0.18 and 0.69 mg·m−2 at
sta-tions 10 and J respectively (Table A1). THAA correlated positively with station depth in both the whole WGMP and the distal part of the WGMP (Table A2). Enzymatically Hy-drolyzable Amino Acids (EHAA) concentrations also correlated significantly with station depth at the scale of the whole WGMP, with values ranging from 0.047 mg·m−2 (station
10) to 0.109 mg.m−2 (stations 8–4). However, this correlation was not significant in the sole
distal part. EHAA/THAA ratios ranged from 15.5 (station 8) to 26.6% (station 10) (Table A1). They did not significantly correlate with station depth when considering either the whole WGMP or its sole distal part (Table A2). Stations AN and 3_8 constituted clear outliers (i.e., featuring high ratios as regard to their depth) in the relationship linking station depth and Chl-a/(Chl-a + Phaeo-a) ratio (Figure 3B). When excluding these two stations, this relationship was significantly negative in the distal part of the WGMP
(Ta-ble A2). δ13C values presented a narrow variation range with values from −23.66‰ to
−22.20‰ at stations 1 and 6, respectively. Variability relative to station depth was more marked in the proximal than in the distal part of the WGMP, where all δ13C values were
around −23‰ (Figure 3C).
Figure 3. Relationships between station depth and main surface sediment characteristics:
Particu-late Organic Carbon concentration (POC; (A)); Chl-a/(Chl-a+Phaeo-a) ratio (B) and δ13C (C). Gray areas represent the proximal part (z < 42.5 m) of the WGMP. Station codes are the same as in Figure 1 and Table A1. The continuous line represents the linear regression linking station depth and POC concentration within the distal part of the WGMP, and the dotted line represents the linear regres-sion linking station depth and Chl-a/(Chl-a+Phaeo-a) ratio within the distal part of the WGMP (ex-cluding stations AN and 3_8).
The first two components of the Principal Component Analysis (PCA) based on surface sediment characteristics accounted for 64.5% (i.e., 40.2% and 24.3% for the first and the second principal component, respectively) of the total variance (Figure 4A). The
first component was defined by organic concentrations. The second component was mostly driven by the opposition between Chl-a/(Chl-a + Phaeo-a) ratio and δ13C on one
side, and SSA on the other side (Figure 4B). Hierarchical clustering and the associated SIMPROF procedure resulted in the identification of 5 groups and 3 “isolated” stations (Figure 4A). Stations of group I, together with stations 1, 6, and AV, were all shallow (i.e., from 32.5 to 42.5 m depth). Group II was mostly composed of stations from the median part of the WGMP (i.e., from 43.5 to 60.5 m depth) except for stations AE, 8, 8-4, and 4, which were deeper (i.e., 31, 64.5, 67.5, and 71.5 m, respectively). Group III was composed of deep stations (i.e., from 62 to 79 m depth) except for station AX (z = 47.0 m). Stations of group IV (i.e., FG and PL) constituted apparent outliers to this overall pattern mostly due to their low Chl-a/(Chl-a + Phaeo-a) ratios and δ13C values compared to other deep
sta-tions. Likewise, stations of group V (i.e., AN and 3-8) differed in Chl-a concentrations and Chl-a/(Chl-a + Phaeo-a) ratios. Overall, the coordinates of stations on the first axis of the PCA correlated significantly with station depth at the scale of both the whole WGMP and its sole distal part (n = 31, R2 = 0.561, p < 0.001; n = 24, R2 = 0.366, p = 0.002).
Figure 4. Principal component analysis based on normalized surface sediment characteristics
(Sediment Surface Area (SSA), POC, Chl-a, Phaeo-a, Chl-a/(Chl-a+Phaeo-a) ratio and δ13C). Projec-tion of staProjec-tions on the first plane of the Principal Components Analysis (PCA) (A) and correlaProjec-tions of the variables with the first two components (B). Station depth (d-St), Bottom Shear Stress (BSS) and Bottom Trawling Effort (BTE) were used as supplementary variables. Group identification was achieved through the coupling of hierarchical clustering with a SIMilarity PROFile (SIMPROF) procedure. Station codes are the same as in Figure 1 and Table A1.
Examples of X-rays radiographies are shown in Figure 5. Stations 0 and 10 showed the presence of a ca. 6–7 cm thick surface sandy layer. Station 10 also presented traces of biological mixing within this layer. Both stations showed laminae corresponding to the denser particles deposits in the sediment column (z ≈13; 16; 17; 19 cm at station 0 and z ≈8 cm at station 10). These structures were less numerous at deeper stations. Nevertheless, some larger structures were observable: (1) at station 2–3 where a coarse layer (z≈14/15 cm) was overlaid by a finer one (11 < z < 14 cm), and (2) at station 4 where two denser (centimeter scaled) layers surrounded a finer one (10 < z < 14.5 cm). Overall, X-rays ra-diographies clearly showed an increase in the thickness of the bioturbated layer between stations 10 and J, whereas station 0 presented only superficial biological reworking within the surface sandy layer.
Figure 5. Examples of X-rays radiographies (positives; scale in cm) collected at six stations located
along the sampled depth gradient (see Figure 1). Station codes are the same as in Figure 1 and Table A1.
3.3. Sediment Profile Images
Overall, 186 Sediment Profiles Images (SPI) were captured. Representative examples (Figure 6) show the increases in the mean values of: (1) aRPD thickness, (2) total number of biological traces (i.e., biogenic structures + epi + infauna), and (3) the thickness of the sediment layer containing biogenic structures with station depth. They also clearly show the presence of a top coarser sediment layer covering dark mud at station 0.
Figure 6. Examples of Sediment Profile Images (SPI) collected at six stations located along the
depth gradient sampled for X-rays radiographies (see Figure 1). Yellow lines represent sediment– water interfaces and blue lines represent apparent Redox Potential Discontinuity (aRPD) thick-nesses. Stations are the same as in Figure 5, and codes are the same as in Figure 1 and Table A1.
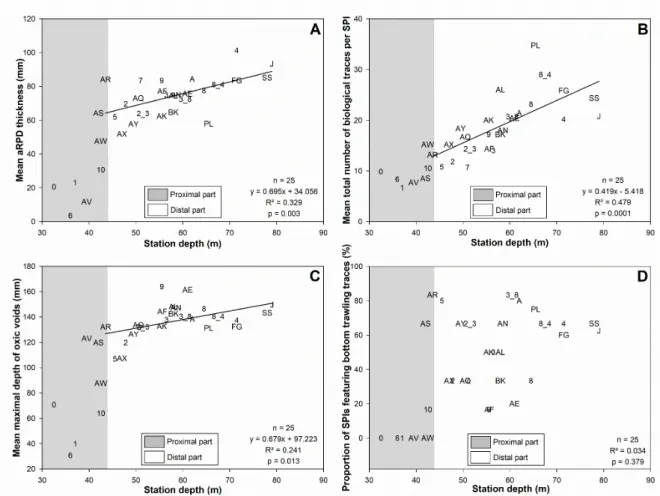
At the scale of the whole WGMP, all SPI characteristics correlated significantly with station depth except for the number of infauna (Table A2). All significant correlations were positive except for number of epifauna. Examples of such relationships are given in Figure 7 for mean (1) aRPD thickness, (2) total number of biological traces (i.e., biogenic structures + epi- and infauna), and (3) maximal depth of oxic voids. These three param-eters presented low values and, for some of them (i.e., aRPD thickness and maximum depth of oxic void), there was a high between-station variability in the proximal part. Within the distal part, they correlated significantly with station depth (Table A2), which was also the case of most other SPI characteristics (i.e., except for burrow and infauna numbers). All significant correlations were positive except for the number of epifauna. For both the whole WGMP and its sole distal part, the proportions of explained variance remained low (Table A2). They were higher for aRPD thickness, oxic void number and maximal depth, and tube number. This proportion was higher for the total number of biological traces than for any individual SPI characteristic.
Figure 7. Relationships between station depth and mean main SPI characteristics: aRPD thickness (A), total number of
biological traces per SPI (B), maximal depth of oxic voids (C), and proportion of SPIs featuring bottom trawling traces (D). Gray areas represent the proximal part (z < 42.5 m) of the WGMP. Station codes are the same as in Figure 1 and Table A1. Continuous lines represent the linear regressions linking station depth and mean SPI characteristics within the distal part of the WGMP.
The first two components of the PCA based on SPI characteristics explained 58.2% (i.e., 42.5% and 15.7% for the first and the second principal component, respectively) of the total variance (Figure 8A). The first component was mainly characterized by a set of co-correlated subsurface features (i.e., number and maximal depth of oxic voids, number of burrows and aRPD thickness). The second component was mostly driven by the number of feeding pits (Figure 8B). Hierarchical clustering and the associated SIMPROF procedure resulted in the identification of three groups of stations (Figure 8A), one of them including only a single station. Group I was composed of five of the seven shal-lowest stations (i.e., stations 0, 1, 6, 10, and AV), and group II was composed of all other stations except station AY due to a high number of epifauna. The SPI characteristics ac-counting most for differences between groups I and II were (1) aRPD thickness (22.3%), (2) oxic void maximal depth (22.0%), (3) burrow number (14.4%), and (4) oxic void number (13.5%). The coordinates of stations on the first axis of the PCA correlated sig-nificantly with station depth at the scale of both the whole WGMP and its sole distal part (n = 32, R2 = 0.757, p < 0.001; n = 25, R2 = 0.601, p < 0.001; respectively).
Figure 8. Principal component analysis based on normalized mean SPI characteristics (aRPD: aRPD
thickness; BU: number of burrows; OV and d-OV: number and maximal depth of oxic voids; FP: number of feeding pits; TB: tubes; EP: epifauna and IN: infauna). Projection of stations on the first plane of the PCA (A), and correlations of the variables with its first two components (B). Station depth (d-St), Bottom Shear Stress (BSS), and Bottom Trawling Effort (BTE) were used as supple-mentary variables. Group identification was achieved through the coupling of hierarchical clus-tering with a SIMPROF procedure. Station codes are the same as in Figure 1 and Table A1.
Mud clasts were observed in 80 out of 186 SPIs, whereas furrows were recorded on only two images and surface puzzle fabrics were never observed. SPIs from five of the shallowest stations did not show any of these traces at all (Figure 7D). There was other-wise high among-station variability in the proportion of SPI containing such features. The proportion of SPI featuring traces indicative of bottom trawling correlated signifi-cantly with station depth at the scale of the whole WGMP, but this correlation was not significant within the sole distal part (Table A2).
3.4. Bottom Shear Stress and Bottom Trawling Effort
BSS 95th percentiles significantly decreased with station depth at the scale of the whole WGMP and of its sole distal part (Figure 9A,B and Table A2). Their values within cells containing sampled stations were between 0.42 at station J and 1.10 N·m−2 at station
0 (Figure 9B and Table A1). In the distal part, POC, Phaeo-a, and THAA correlated nega-tively with BSS 95th percentiles. This was also the case for six (i.e., aRPD thickness; numbers of oxic voids, feeding pits, tubes; maximal depth of oxic voids; and total number of biological traces; Table A3) of the 10 SPI characteristics assessed during the present study. Moreover, at the scale of the sole WGMP distal part, the coordinates of stations on the first axis of the PCAs based on both surface sediment and SPI characteristics corre-lated significantly with BSS (n = 24, R2 = 0.348, p = 0.002; and n = 25, R2 = 0.547, p < 0.001;
Figure 9. Spatial mapping of 95th percentile of Bottom Shear Stress during the year preceding the JERICOBENT-5 cruise (A), relationship with station depth within cells including sampled stations (B), summed Bottom Trawling Effort during the year preceding the JERICOBENT-5 cruise (C), and relationship with station depth within cells including sampled stations (D). Gray areas represent the proximal part (z < 42.5 m) of the WGMP. Station codes are the same as in Figure 1 and Table A1.
Bottom Trawling Effort (BTE) tended to be higher in the WGMP than in adjacent areas (Figure 9C). It was low in the shallowest part (i.e., 35 < z < 50 m) of the WGMP. Deeper, BTE was highly heterogeneous with some cells being heavily trawled between 55 and 60 m depth (i.e., up to 39.6 h·km−2·y−1 and 12.9 times trawled·y−1; Figures 9C), while
some others were only lightly affected. BTE within cells containing sampled stations was between 0.48 and 19.4 h·km−2·y−1 (0.2 and 6.3 times trawled.y−1 for stations AN and 3-8,
respectively; Figure 9D and Table A1). Four sampled stations (3-8, BK, PL, and FG) were located in cells featuring a BTE higher than 10 h·km−2·y−1 (Figure 9D and Table A1). BTE
within cells containing sampled stations correlated positively with station depth at the scale of the whole WGMP, but this correlation was not significant in the sole distal part (Table A2). In the distal part, there was no significant correlation between BTE and any surface sediment or SPI individual characteristic (including the proportion of SPI fea-turing traces indicative of bottom trawling), except for (1) δ13C, (2) Chl-a/(Chl-a +
Phaeo-a), and (3) numbers of tube and total biological traces (which was largely affected by tube number; Table A3). Moreover, at the scale of the sole WGMP distal part, the co-ordinates of stations on the first axis of the PCAs based on both surface sediment and SPI characteristics did not correlate significantly with BTE (n = 24, R2 = 0.003, p = 0.813; and n =
3.5. Comparison with the Rhône River Prodelta
The relationships between station depth and D0.5, THAA, Chl-a/(Chl-a + Phaeo-a),
and δ13C in both the distal part of the WGMP and the Rhône River Prodelta (RRP) show
clear differences between the two systems (Figure 10). With the exception of the RRP shallowest station, surface sediments were significantly (p < 0.001) coarser in the distal part of the WGMP (mean D0.5 of 20.2 µm) than in the RRP (i.e., mean D0.5 of 12.0 µm;
Figure 10A). Mean THAA concentrations were significantly higher in the distal part of the WGMP than in the RRP (mean values and standard deviations of 4.20 ± 1.23 mg·gDW−1 and 2.75 ± 0.55 mg·gDW−1, respectively; p = 0.013). Moreover, changes in
THAA concentrations relative to station depth showed opposite patterns in the two sys-tems with increasing values with increasing depth in the distal part of the WGMP and decreasing values with increasing depth in the RRP (Figure 10B). The same result was found after standardization for D0.5. Similar discrepancies between systems were found
for POC and EHAA concentrations even though mean POC concentrations were signifi-cantly lower in the distal part of the WGMP (1.09 ± 0.24 vs. 1.39 ± 0.29%DW in the RRP; p = 0.021), and mean EHAA concentrations did not significantly differ between systems (0.76 ± 0.13 vs. 0.77 ± 0.19 mg·gDW−1, in the distal part of the WGMP and the RRP,
re-spectively; p = 0.846). Chl-a/(Chl-a + Phaeo-a) ratio significantly decreased with increasing station depth in both systems (Figure 10C) with no significant difference in their mean values (p = 0.105). EHAA/THAA ratios did not correlate significantly with station depth in either system (p = 0.202 and p = 0.950 in the distal part of the WGMP and the RRP, re-spectively). Their mean value was significantly lower in the distal part of the WGMP than in the RRP (19.8 ± 3.4% and 27.7 ± 1.5%, respectively; p < 0.001). The pattern of changes in δ13C relative to station depth clearly differed between systems with significantly
in-creasing values with inin-creasing station depth in the RRP (p = 0.005) and no significant change in the distal part of the WGMP. Their mean value was significantly (p < 0.001) less negative in the WGMP (−22.9‰) than in the RRP (−25.7‰).
Figure 10. Relationships between station depth and main surface sediment characteristics in the WGMP and the Rhône
River Prodelta (RRP): D0.5 (A), Total Hydrolyzable Amino Acids (THAA (B)), Chl-a/(Chl-a+Phaeo-a) ratio (C), and δ13C (D). Gray areas represent the proximal part of the WGMP (z < 42.5 m).
The relationships between station depth and (1) aRPD thickness, (2) total number of biological traces per SPI, and (3) depth of oxic voids in both the distal part of the WGMP and the RRP are shown in Figure 11. The two systems presented strong differences. aRPD thickness increased with station depth in both the distal part of the WGMP and in the RRP (p = 0.003 and p = 0.002, respectively; Figure 11A), but its mean was significantly higher in the distal part of the WGMP (74.8 ± 11.7 vs. 37.0 ± 18.1 mm in the RRP; p < 0.001). The mean total number of biological traces was also significantly higher in the distal part of the WGMP (Figure 11B; 19.1 ± 5.9 vs. 4.7 ± 2.2 per SPI in the RRP; p < 0.001). There were similar differences for the mean numbers of burrows, oxic voids, and tubes (p < 0.001 in all cases). Mean oxic void depth significantly increased with station depth in the RRP (p = 0.022) but not in the distal part of the WGMP (p = 0.745). Its mean value was also signifi-cantly higher, although to a lower extent, in the distal part of the WGMP (Figure 11C; 86.7 ± 15.0 vs. 68.5 ± 29.4 mm, in the RRP; p = 0.023).
Figure 11. Relationships between station depth and mean main SPI characteristics in the WGMP
and the RRP: aRPD thickness (A), total number of biological traces per SPI (B), and depth of oxic voids (C). Grey areas represent the proximal part of the WGMP (z < 42.5 m).
4. Discussion
4.1. Spatial Structuration
4.1.1. Subdivision between Proximal and Distal Parts
Up to now, only two studies have considered the spatial distribution of surface sediment grain size and organic contents in the West Gironde Mud Patch (WGMP; [44,45]). Both studies relied on the sampling of only three stations, and their results supported the original [26,34,40] distinction between a proximal and a distal part. Our sampling plan was based on 32 stations, which allowed showing a significant correlation between surface sediment characteristics (as summarized by the first component of the corresponding PCA) and station depth. Data analysis resulted in the identification of three main groups of stations presenting different surface sediment characteristics. Sta-tions of groups I (together with staSta-tions 1, 6, and AV) were all shallow (z < 42.5 m) and tended to present coarse surface sediments and low concentrations in Particular Organic Carbon (POC) and chloropigments. A high between-station variability in D0.5 and
Sedi-ment Surface Area (SSA) was nevertheless recorded in this group, most likely reflecting spatial differences in the transient deposition of coarse sediments [25,26,40] as observed during the present study on the Sediment Profile Images (SPIs) collected at station 0. Therefore, our results clearly support that the stations of group I, and associated isolated stations are constitutive of the proximal part of the WGMP as stated by Jouanneau et al. [35] and Lesueur et al. [26,34].
The spatial zonation of the WGMP has also been studied based on X-rays radiog-raphies of long sediment cores [26,34,35,40,43]. Lesueur and Tastet [43] computed a crude index of bioturbation (i.e., the proportion of reworked sediment volume) based on these radiographies. They proposed to subdivide the WGMP in three parts based on the values of this index, which increased with station depth. The shallowest part could be consid-ered as mostly representative of the proximal and the two others of the distal part (Les-ueur and Tastet [43]). However, this conclusion clearly suffered from (1) the inability of X-rays radiographies to precisely assess bioturbation and (2) the use of long sediment cores, which did not allow for the preservation of the sediment–water interface. The X-rays radiographies collected during the present study were achieved on cores collected using a lightweight interface corer, which allowed for a better preservation of this inter-face. Results confirmed previous observations in showing (1) the occurrence of sandy layers in the top sediment column of the three stations sampled within the proximal part (see above); (2) the presence, especially at shallow stations, of laminae attributed by Lesueur and Tastet [43] to the deposition of dense and coarse particles following high energy events; and (3) a limitation of bioturbation to the top of the sediment column at shallow stations, whereas the thickness of the mixed sediment layer was clearly higher at deep stations. During the present study, we also used Sediment Profile Imagery, which allowed for (1) an in situ 2D visualization of the sedimentary column without disturbing the sediment–water interface and (2) a multiparametric assessment of modern bioturba-tion through the analysis of biological traces [63]. This resulted in the identificabioturba-tion of two main groups of stations delimited by a ca. 42.5 m depth threshold, which further supports the distinction between a proximal part where bioturbation is limited and a distal part where it is much higher (Figure 7A–C).
4.1.2. Spatial Structuration of the Distal Part
Previous sedimentological surveys have shown the occurrence of two major depth gradients in the distal part [26,34,35,40,43]. The first related to the frequency of occur-rence of erosional surfaces and subsequent vertical decreasing granulometric sequences (see above), and the second related to bioturbation. However, these surveys did not ac-count for modern biogeochemical processes taking place in the top of the sediment col-umn. This issue was tackled by Relexans et al. [44] and later by Massé et al. [45] based on the analyses of surface sedimentary organics and benthic fauna composition. However,
results remained largely inconclusive regarding the possible existence of spatial gradi-ents due to limited sampling efforts.
During the present study, we sampled 25 stations within the distal part. Based on the multivariate analysis of their surface sediment characteristics, these stations were mostly distributed among two main groups, which were clearly related to station depth as confirmed by the significance of the correlations linking station depth with (1) POC, THAA, and Phaeo-a concentrations and (2) the coordinates of stations on the first com-ponent of the PCA based on surface sediment characteristics within the distal part of the WGMP. A significant correlation was also found for the Chl-a/(Chl-a + Phaeo-a) ratio when excluding two outliers. Thus, our results clearly support the occurrence of a depth gradient in surface sediment characteristics within the distal part of the WGMP. This gradient was linked to changes in sedimentary organic characteristics and independent of changes in sediment granulometry, since all organic concentrations were normalized to SSA.
The two statistical approaches used to assess the existence of a potential depth gra-dient based on SPI characteristics led to apparently different conclusions. On the one hand, regression analyses showed significant correlations between most individual characteristics and station depth, and there was a significant correlation between station depth and station coordinates on the first component of the PCA based on SPI charac-teristics. On the other hand, the hierarchical clustering based on the whole set of SPI characteristics together with the associated SIMPROF procedure failed to identify sig-nificantly differing station subgroups. Most of the assessed individual SPI characteristics correlated significantly with station depth, and for five of them, this was indicative of an increase in bioturbation with station depth. This trend was particularly marked for (1) sediment oxidation (aRPD), (2) burrowing (oxic void number), and (3) thickness of the mixed sediment layer (oxic void maximal depth). Conversely, neither infauna nor bur-row numbers did significantly correlate with station depth. For infauna, this may result from undersampling. For burrow number, this probably results from (1) large spatial extensions at highly bioturbated deep stations, which complicates the distinction be-tween burrows and may induce an underestimation of their number; and (2) stronger difficulties in identifying burrows (i.e., oxidized structures) within sediment columns featuring thicker aRPDs at deep stations. Interestingly, the positive correlation with sta-tion depth was more pronounced for the total number of biological traces (although this last parameter included the epifauna number, which correlated negatively with station depth) than for any SPI individual characteristic. This can be interpreted as a reduction (by summation) of the lack of fit of the regression models linking station depth and dividual SPI characteristics, which further supports the existence of a gradient of in-creasing bioturbation along the depth gradient within the distal part of the WGMP. The fact that hierarchical clustering based on SPI characteristics did not allow differentiating station subgroups is likely caused by (1) the use of normalized data, which resulted in the attribution of the same weight to all considered parameters, including those that did not correlate significantly with station depth (i.e., burrow and infauna numbers); and (2) the noise generated by the lack of fit of the regression models linking station depth and in-dividual SPI characteristics, which differed between characteristics for a given station (as exemplified above for the total number of biological traces). Therefore, our interpretation of SPI data is that they also support the existence of a depth gradient of increasing bio-turbation within the distal part.
4.1.3. Overall Conclusion
Based on a wide range of surface sediment characteristics and the use of an image analysis technique specifically designed for the top of the sediment column, our results clearly confirm the subdivision of the WGMP in a proximal and a distal part put forward by previous sedimentological surveys and support the proposed 40–45 m depth limit between these two parts [26,43]. They also show the existence of a depth gradient
re-sulting from modern sedimentation and bioturbation processes taking place in the distal part of the WGMP.
4.2. Disentangling the Potential Effects of Hydrodynamics and Bottom Trawling
The potential impacts of hydrodynamics and bottom trawling on the spatial distri-butions of surface sediment and SPI characteristics were tested by the simultaneous as-sessments of the spatial distributions of (1) Bottom Shear Stress (BSS), (2) Bottom Trawl-ing Effort (BTE), (3) surface sediment characteristics, and (4) SPI features. When consid-ering the whole WGMP, the correlations between both BSS and BTE with station depth impaired the unraveling of the role of these two factors in controlling the spatial distri-bution of surface sediment and SPI characteristics. More generally, the correlation be-tween environmental characteristics and fishing effort clearly constitutes a major issue when assessing the impact of benthic trawling on benthic systems [23,83,84]. During the present study, this difficulty was overcome by considering spatial changes recorded in the sole distal part where (1) BTE did not correlate significantly with station depth, (2) the ranges of D0.5 and SSA were narrower, and (3) none of these two parameters correlated
significantly with both BSS and BTE (see Queirós et al. [24] for a similar approach). The 95th BSS percentiles recorded during the present studies were between 0.4 and 1.1 N.m-2. These values can be compared with those computed in the Gulf of Lions using
a similar model (i.e., a 90th percentile around 0.05 N·m−2 at a 30 m depth; [85]). Moreover,
based on simultaneous assessments of BSS and Suspended Particulate Matter concentra-tion, Dufois et al. [78] concluded that resuspension was induced over a critical BSS threshold of 0.35 N·m−2 at a 20 m deep station within the Rhône River Prodelta. Although
caution should clearly be taken since sediment roughness and rheological properties were not assessed during the present study, this supports the hypothesis according to which sediment resuspension may take place over the whole WGMP [47]. Moreover, the 95th percentile value of BSS correlated negatively with station depth, which largely cor-responded to the dominance of its wave-induced component relative to its cur-rent-induced component and is also coherent with the dominant role attributed to waves in controlling the spatial structuration of the WGMP [26]. Although collected over dif-ferent periods (June 2017–June 2018 vs. 2005–2013) and using difdif-ferent positioning sys-tems (i.e., Automatic Identification System vs. Vessel Monitoring System), the absolute values and the spatial distribution of BTE observed during the present study were fully consistent with the one reported by Mengual et al. [19,20]. BTE was clearly higher within the distal part with a maximal average number of times trawled.y−1 of 12.9.
Several lines of evidence suggest that the effect of bottom trawling on the spatial distributions of both surface sediment and SPI characteristics was limited as compared to the influence of hydrodynamics. First, there were significant correlations between three (four when excluding the two above-mentioned outliers for Chl-a/(Chl-a + Phaeo-a)) of surface sediment characteristics and BSS, whereas only δ13C (although featuring a very
restricted range of variation) and Chl-a/(Chl-a + Phaeo-a) (when excluding the two above-mentioned outliers) correlated significantly with BTE. Second, most of the SPI in-dividual characteristics correlated negatively with BSS, whereas the number of tubes was the only individual SPI characteristic significantly correlating with BTE. Furthermore, this last result is not supporting a strong effect of bottom trawling, since BTE is generally assumed to negatively impact benthic bioturbation [24,83,84,86–89]. Along the same line, the correlation between tube number and BTE was positive, which here again is not supporting a strong influence of bottom trawling, since according to the literature, tube-building species tend to be rare or even absent in trawled areas [61,62,90]. Third, stations coordinates of the PCAs based on both surface sediment and SPI characteristics correlated significantly with BSS, but not BTE. Fourth, the incorporation of BTE with BSS in multiple regression models did not improve the description of either the surface sediment or the SPI characteristics assessed during the present study. None of the corre-lations that were not significant using BSS alone as the independent variable became
significant when incorporating BTE as a second independent variable. Moreover, for most characteristics correlating significantly with BSS alone (i.e., all except tube number and total number of biological traces), the incorporation of BTE resulted in poorer de-scriptions. Therefore, BTE did not account as well for changes in surface sediment and SPI characteristics assessed not described by changes in BSS.
Overall, the only rationale for a significant impact of bottom trawling was the sometimes high (i.e., up to ca 80%) proportion of SPI featuring trawling traces. However, these proportions were highly variable between stations and did not correlate signifi-cantly with BTE. Moreover, the trawling traces recorded during the present study almost exclusively consisted in mud clasts with almost no furrows and no puzzle fabrics at all. This is an important point, since the direct causality linking bottom trawling and the presence of mud clasts appears still questionable [91,92]. For example, similar propor-tions of SPI featuring trawling traces (including mud clasts) have been reported in sev-eral areas of the Gulf of Lions experimenting different BTE [61,62,93], which further highlights the difficulty in unambiguously associating the presence of mud clasts with bottom trawling.
Based on these rationales, our overall conclusion is that the assessment of the spatial distributions of both SPI characteristics and BTE recorded during the present study does not support the hypothesis according to which bottom trawling is a key factor in con-trolling the spatial structuration of the WGMP. However, it should be pointed out that this conclusion may partly result from differences in spatial scales associated with the assessments of BTE (i.e., a few km2) and SPI characteristics (i.e., typically a few m2). BTE
is known to induce spatially heterogeneous effects on benthic habitats even within ex-perimentally heavily trawled areas [94], which led Smith et al. [95] to recommend col-lecting a high number of SPIs (i.e., ca. 30, which is much more than achieved during the present study) at each station to infer the impact of bottom trawling (see also [86,96], for the interest of complementary approaches). BTE was not spatially homogeneous over each of the 1.77 km2 cells considered during the present study, which may have
ham-pered the detection of significant correlations between BTE and both surface sediment and SPI characteristics measured over much smaller spatial scales. Differences in tem-poral scales associated with the assessment of BTE (i.e., one year during the present study) and the kinetics of recovery of benthic habitats may have had the same effect as well.
4.3. Comparison with the Rhône River Prodelta
4.3.1. Surface Sediment Characteristics
δ13C values differed between the distal part of the WGMP and the Rhône River
Prodelta (RRP) regarding both their absolute values and their changes relative to station depth. In the RRP, δ13C ranged from −24.2% to −27.2‰ and significantly increased with
station depth, whereas in the distal part of the WGMP, they were close to −23‰ and did not change significantly with station depth. In the RRP, these results have been inter-preted as reflecting the dominance of a continental source of organic matter and its gradual mixing with marine sources through a series of resuspension/sedimentation events occurring within the prodelta itself [74,81,97–99]. In the WGMP, δ13C values
around −23‰ have been reported in suspended particulate material both at the Mouth of the Gironde Estuary and in the inner part of the Bay of Biscay Continental Shelf [100]. These values were interpreted as resulting from an early mixing between (1) a continen-tal/terrestrial source (with a mean δ13C of −25.9‰), (2) estuarine sources generated by
autochthonous processes due to long estuarine residence times [101,102], and (3), a ma-rine planktonic source (with a mean δ13C of −20.5‰). Such an early mixing within the
Gironde Estuary is largely resulting from its macro-tidal regime [100,103]. Our own re-sults support this interpretation and suggest the lack of subsequent significant mixing with marine sources in the WGMP itself. Overall, the discrepancies in the δ13C between
the two systems are indicative of major differences in the timing and the nature of the processes involved in the mixing of continental and marine sources of sedimented Par-ticulate Organic Matter (POM).
Our results show a lack of correlation between station depth and D0.5 and the
pres-ence of coarser sediment in the distal part of the WGMP, despite a lower water discharge and a long (i.e., 1–2 years in the Estuarine Turbidity Maximum) particle residence time in the Gironde Estuary [104,105]. There were also marked differences between systems in both sedimentary organics concentrations and their changes relative to station depth. THAA concentrations were higher in the WGMP, where they increased with station depth conversely to what was observed in the RRP. Such opposite patterns were also observed for POC and, to lesser extent, EHAA. In the RRP, spatial changes in D0.5 and
surface sediment concentrations were interpreted as resulting from (1) a particle sorting relative to size induced by the succession of sedimentation/resuspension events [106] and (2) the progressive dilution of a highly dominant continental POM source originating from the Rhône River [55,56,74,81,97–99]. The Gironde River is also the dominant source of particles fueling the WGMP [31,32,41], and successive sedimentation/resuspension events are largely responsible for the transfer of particles at depth in this system as well [26]. Therefore, the same two key driving factors are inducing major differences in the spatial structuration of the two systems. The lack of depth gradient in particle size in the distal part of the WGMP suggests that particle sorting is not predominantly controlled by particle size in the WGMP. Density may constitute an alternative sorting cue as sug-gested by the preferential sedimentation of denser particles following major resuspen-sion events [43]. In coastal sediments, low-density particles are organically enriched and behave similar to smaller ones with regard to particle sorting [107]. Therefore, a densi-ty-driven particle sorting could account for the depth gradients observed in the distal part of the WGMP; low-density (and organically enriched) particles being preferentially settled and trapped in deeper areas irrespective of their size, which would account for increasing bulk organic concentrations with station depth. At this stage, this only con-stitutes a working hypothesis, and it will certainly prove interesting to assess spatial changes in the proportion of low-density particles during future studies taking place in the WGMP.
EHAA/THAA ratios were lower in the distal part of the WGMP than in the RRP. This is indicative of a lower lability of sedimented POM, which may be linked to the long residence time of particles in the Gironde Estuary [104,105] and the predominance of degradation processes in its Estuarine Turbidity Maximum [101,108–110]. Conversely Chl-a/(Chl-a + Phaeo-a) ratios did not significantly differ between areas. These two indi-ces showed the same pattern of change relative to station depth in both systems with (1) a significant decrease in Chl-a/(Chl-a + Phaeo-a) ratios and (2) no significant change in EHAA/THAA ratios. In the RRP, the discrepancy between the two indices has been at-tributed to the fact that the Chl-a/(Chl-a + Phaeo-a) ratio is representing a highly labile vegetal fraction of the sediment POM, whereas the EHAA/THAA ratio is representative of the lability of the bulk nitrogenous fraction of sedimentary organics [56,57]. This sug-gests that both in the WGMP and the RRP, degradation processes occurring during the transfer of deposited particles at depth are mostly affecting a highly labile fraction of POM. Since this component is contributing only to a small fraction of bulk sedimentary organics, this is also in agreement with the lack of significant changes in δ13C with station
depth.
Overall, the WGMP and RRP present strong similarities. Both are alimented by par-ticles originating from major rivers. Moreover, the transfer of parpar-ticles along their depth gradient is cued by sorting processes associated with the succession of sedimentation and resuspension sequences. Major differences between the two systems first refer to the tidal regime and marine hydrodynamics, which result in a much earlier mixing between con-tinental and marine POM in the Gironde estuarine system. More specifically, this mixing is largely taking place in the RRP itself and conversely upstream the WGMP, namely in
the Gironde Estuary and near its mouth. Other major differences between the two sys-tems are linked to sedimentary organic concentrations and their patterns of change rela-tive to station depth. We hypothesized that this may result from different particle sorting processes (i.e., mostly cued by particle size and particle density in the RRP and the WGMP, respectively) associated with successive sedimentation/resuspension events. These differences support the distinction between type 1 and type 2 prodeltas [3,5] for temperate areas.
4.3.2. Bioturbation
In both systems, the aRPD thickness, the total number of biological traces, and the thickness of the bioturbated layer increased with station depth in accordance with the negative impact of disturbance on bioturbation described by the Pearson and Rosenberg [111] and Rhoads et al. [12] models. However, the nature of the dominant disturbance itself differs between systems. In the RRP, the shallowest stations are mostly submitted to high sedimentation rates [74,79,80,112] and associated organic matter inputs caused by river floods [56]. This results in sediment instability and organic enrichment, which largely affect benthic macrofauna composition and limit bioturbation [56]. In the distal part of the RRP, continental inputs are diluted and sediment stability is higher, which results in increasing bioturbation. In the proximal part of the WGMP, strong Bottom Shear Stress (BSS) precludes modern sedimentation [25,26]. It also largely controls the composition of resident fauna, which is largely dominated by suspension feeders (mostly the small-sized bivalve Kurtiella bidentata and the ophiuroid Amphiura filiformis; [45]) that are not efficient bioturbators under such environmental conditions.
There were also important differences in bioturbation between the distal parts of the WGMP and the RPP. These differences refer both to overall intensity and change relative to station depth. In the distal part of the WGMP, bioturbation intensity tended to increase with station depth together with decreasing BSS, which is coherent with the Rhoads et al. [12] model. Conversely, in the distal part of the RRP, there was no clear correlation be-tween station depth and bioturbation intensity. Salen-Picard et al. [113] reported the ex-istence of a positive impact of Rhone River floods on the abundance of subsurface feeders (i.e., potentially strong bioturbators) at a 70 m deep station with a time lag of ca. 33 months. Therefore, the lack of significant correlation between bioturbation intensity with station depth in the distal part of the RRP may result from opposite gradients in three potentially controlling factors, namely: (1) organic matter availability, which decreases with station depth; (2) the positive impact of floods on the abundance of strong biotur-bators, which also decreases with station depth; and (3) sediment stability, which con-versely increases with station depth. According to this hypothesis, the lack of gradient in bioturbation intensity in relation with station depth would result from an equilibrium between organic matter availability and sediment stability and therefore conforms to the Rhoads et al. [12] model.
Differences between overall bioturbation intensities between systems are not easy to account for. According to the Rhoads et al. [12] model, bioturbation intensity results from the interaction between organic matter availability (eventually through its effect on benthic macrofauna) and physical disturbances [12]. POC sediment concentrations were quite similar in both areas, which was also true for amino acid concentrations when ac-counting for their bioavailability (i.e., EHAA). The comparison of benthic macrofauna abundance, biomass, and feeding types between systems is clearly complicated by the fact that they were not sampled using the same gear (i.e., an Hamon grab for Massé et al. [45] vs. a Van Veen grab for Bonifacio et al. [56]. Nevertheless, it showed no obvious dif-ference in the nature and abundance of major potential bioturbators. During the present study, we considered the effect of hydrodynamics, sedimentation, and bottom trawling as potential sources of physical disturbances within the WGMP. Therefore, these three sources of physical disturbances could also account for differences between systems. As exemplified by differences in (1) WGMP and RRP morphologies [5], and (2) the upper