Do local government-industry linkages affect air quality?
Evidence from cities in China
by
Xingyao Shen
B.S., Shanghai Jiao Tong University (2013)
M.S., Swiss Federal Institute of Technology, Zurich (2015)
Submitted to the Technology and Policy Program
Institute for Data, Systems, and Society
in partial fulfillment of the requirements for the degree of
Master of Science in Technology and Policy
at the
MASSACHUSETTS INSTITUTE OF TECHNOLOGY
June 2017
© Massachusetts Institute of Technology 2017. All rights reserved.
Author . . . .
Technology and Policy Program
Institute for Data, Systems, and Society
May 12, 2017
Certified by. . . .
Valerie Karplus
Assistant Professor, Sloan School of Management
Thesis Supervisor
Accepted by . . . .
Munther Dahleh
Professor, Electrical Engineering and Computer Science
Do local government-industry linkages affect air quality?
Evidence from cities in China
by
Xingyao Shen
Submitted to the Technology and Policy Program Institute for Data, Systems, and Society on May 12, 2017, in partial fulfillment of the
requirements for the degree of
Master of Science in Technology and Policy
Abstract
I investigate the relationship between local government-industry linkages and pollution out-comes in Chinese cities over the period 2003 to 2010. For identification, I rely on the admin-istrative rotation of city mayors, which is determined by political career considerations and retirement age cut-offs but unrelated to their environmental records. These transitions act as plausibly exogenous shocks that disrupt the relationship between the local government and enterprises at the city level. I employ several statistical models to investigate the leadership’s impacts on environmental outcomes.
First, a simple t-test is used to evaluate the change in the pollution index when may-ors with particular characteristics enter or leave office. In addition, empirical models are utilized to explore the correlation between mayoral characteristics and changes in city-level pollution. I find correlations between mayoral characteristics and city-level environmental outcomes, focusing specifically on SO2 emissions, SO2 emission intensities, and end-of-pipe SO2 removal ratios. Finally, firm-level data allow me to identify the relationship between mayoral characteristics and pollution by enterprises of specific ownership types.
Mayors with different characteristics show distinct impacts on city-level pollution. I hypothesize that city leaders who have previous experience in industry pay more attention to local economic growth rather than environmental improvements, resulting in increased SO2 emissions. Consistent with this hypothesis, I find that mayors with industry work background correspond to an increase (decrease) in city-level SO2 emissions when they enter (leave) office after controlling for city and year fixed effects. Apart from this, I expect that leaders closer to retirement are under less pressure for promotion as they are going to retire soon and due to age cut-offs may not be eligible for higher positions; instead, they may feel less pressure to promote local businesses and pay more attention to environmental management. Evidence shows consistently that tenures of mayors on the verge of retirement are associated with reductions in city-level SO2 emissions and increases in city-level end-of-pipe SO2 removal rates.
Further investigation shows that mayors realize their environmental goals via enterprises of specific ownership types. I predict that mayors rotated from the central government are not under pressure of promotion and they are adherent to the central policy in reducing SO2 emission intensities. I further predict that mayors from the local administration are expected to enforce the usage of SO2 removal facilities, particularly among enterprises of low level authorities. Consistent with these hypotheses, results show that mayors with work background in central and local governments are associated with improved environmental outcomes, but through different channels. A central government work background results in intensity reduction, but not necessarily SO2 emissions; however, local government work background is associated with short-term reductions in SO2 intensities, possibly due to increases in SO2 removal ratios, particularly among city SOEs.
In addition to the analysis of mayoral characteristics, my research reveals several addi-tional interesting findings. I find that enterprises of lower rank more readily build linkages with local officials not only for economic development but also for environmental manage-ment as high-ranking enterprises may face a more stringent monitoring system and are more politically powerful. Implications for environmental policy design in China can be drawn from the results. First, industries are encouraged to behave independently from the gov-ernment in economic activities as well as policy implementation. Second, environmental performance should be effectively and explicitly included in the evaluation program of offi-cials. Third, government-industry linkages, to the extent that they undermine the economic and policy system, should be minimized as much as possible.
Thesis Supervisor: Valerie Karplus
Acknowledgments
This thesis work integrates part of my research work during the past two years. This can not be completed without the help, support, and encouragement from different elements including sponsors, advisors, colleagues, friends, and families. Firstly, I am deeply grateful to the Technology and Policy Program (TPP) for providing my curriculum home and the Joint Program on the Science and Policy of Global Change (JPSPGC) and the Karplus Energy Group (KEG) for hosting my academic research. Additionally, I appreciate the Environmental Solutions Initiative (ESI), a Bechtel Curriculum Development Grant, and a CGN Fellowship through the MIT Energy Initiative for funding my study and research at MIT. As my supervisor at the Sloan School of Management at MIT, Professor Valerie Karplus deserves my sincere thanks for her guidances, suggestions, and support in advising my two years of research during my master study.
Beyond this, I would like to thank my fellow MIT students, staff at the MIT Joint Program on the Science and Policy of Global Change, and colleagues in the Karplus Energy Group. They provide not only an academic environment but also a fun life, which are essentially helpful with my study and research at MIT. This work can not be perfectly completed without the support from the Karplus Energy Group. I would like to give my thanks to Dr. Da Zhang, Paul Kishimoto, Danielle Wilson, Michael Davidson, Arun Singh, and Mingwei Li for their helpful suggestions. In particular, I appreciate the data support from Professor Valerie Karplus, Dr. Da Zhang, Professor Jing Cao at Tsinghua University in China, Professor Shanjun Li at Cornell University, and visiting Tsinghua Ph.D. student Yangqin Weng. Professor Cao and Yangqin were instrumental in enabling the analysis using the proprietary firm-level pollution data set for China. These data were stored and analyzed exclusively on their computers. The CEIC data were accessed through the subscription maintained by Professor Valerie Karplus. I am grateful to Professor Cao and Professor Li for allowing me to use their data sets on mayoral characteristics. In addition, Fannie Barnes, Barbara DeLaBarre, and Dr. Frank Field have provided great support for the administration work for my research and study and they deserve thousands of thanks.
Finally, I would like to sincerely thank my family, friends, and colleagues beyond MIT community for their life long support, help, and significant shared time on my pathway to complete this work. At the end, I hope this thesis work could inform technology, policy, institutional management, and academic research efforts to conquer environmental challenges in the world.
Contents
1 Introduction 13
1.1 Background . . . 13
1.2 Analytical Strategy . . . 17
1.3 Context, Contribution, and Outline of the Study . . . 18
2 Motivation 19 2.1 Setting in China . . . 19
2.2 Adverse Impacts from Air Pollution . . . 22
2.3 China’s Economic Reform and SOEs . . . 24
2.4 Government-industry Linkages . . . 27
2.5 Motivation for Research . . . 29
2.6 Linkages to Technology and Policy . . . 30
3 Policy Setting in China 31 3.1 Market-based Tools . . . 31
3.2 Command-and-control Tools . . . 33
3.3 Total Emission Control of SO2 in the 10th and 11th Five-Year Plan . . . 35
3.4 Government-industry Linkages in Policy Setting . . . 37
4 Data Description 39 4.1 City Level Analysis . . . 39
4.1.1 Pollution and Economic Index . . . 40
4.2 Enterprise Level Analysis . . . 41
4.2.1 City and Ownership . . . 42
4.2.2 City and Category . . . 43
4.3 Mayors’ Characteristics . . . 43
4.3.1 Mayors’ Characteristics - Source 1 . . . 43
4.3.2 Mayors’ Characteristics - Source 2 . . . 43
4.3.3 Consistency of the Two Sources of Data on Mayoral Characteristics . 44 5 Empirical Analysis 47 5.1 Empirical Strategy . . . 47
5.3 Preliminary Evidence from City-level Pollution . . . 52
5.4 Regression Models . . . 55
5.5 Regression Results . . . 56
5.5.1 ex post Characteristics . . . 56
5.5.2 City Level Analysis . . . 57
5.5.3 Enterprise and Category Level Analysis . . . 62
6 Conclusion and Outlook 65 6.1 Government-Industry Linkages . . . 65
6.2 Leadership Characteristics’ Impacts on Emissions . . . 66
6.3 Policy Implications . . . 70
6.4 Limitations of This Study . . . 72
6.5 Directions for Future Work . . . 73
A Tables 81
List of Figures
2-1 City level SO2 emissions versus GDP and GDP in industry in 2005 . . . 20
2-2 Haze over the Forbidden City in Beijing on December 20, 2016. (McCann, 2016) . . . 21
2-3 Timeline of economic reform in China (Xi, 2007) . . . 24
2-4 Economic output of enterprises of different types in China . . . 25
2-5 Emissions of chemical oxygen demand (COD) of enterprises of different types in China . . . 26
2-6 Emissions of sulfur dioxide (SO2) of enterprises of different types in China . 26 3-1 Timeline of emission policy evolution in China . . . 33
5-1 Coefficients on mayoral characteristics in the regressions of absolute SO2 emis-sions (1000 tons) . . . 58
5-2 Coefficients on mayoral characteristics in the regressions of SO2 emission in-tensity (1000 tons / billion CNY) . . . 58
5-3 Coefficients on mayoral characteristics in the regressions of end-of-pipe SO2 removal ratios . . . 58
B-1 Observed number of distinct cities for each province - all . . . 121
B-2 Observed number of distinct cities for each province - balanced . . . 122
B-3 Observed number of distinct mayors for each province - all, Source 1 . . . 122
B-4 Observed number of distinct mayors for each province - balanced, Source 1 . 123 B-5 Observed number of distinct mayors for each province - all, Source 2 . . . 123
B-6 Observed number of distinct mayors for each province - balanced, Source 2 . 124 B-7 Change of de-meaned and de-trended SO2 emission on mayors (mwbind) en-tering and leaving office - balanced . . . 124
B-8 Change of de-meaned and de-trended SO2 emission on mayors (mwbind) en-tering and leaving office - unbalanced . . . 125
B-9 Change of de-meaned and de-trended SO2 emission on mayors (mprom) en-tering and leaving office - balanced . . . 125
B-10 Change of de-meaned and de-trended SO2 emission on mayors (mprom) en-tering and leaving office - unbalanced . . . 126
B-11 Change of de-meaned and de-trended SO2 emission on mayors (mwbctr) en-tering and leaving office - balanced . . . 126
B-12 Change of de-meaned and de-trended SO2 emission on mayors (mwbctr) en-tering and leaving office - unbalanced . . . 127 B-13 Change of de-meaned and de-trended SO2 emission on mayors (mlocal)
en-tering and leaving office - balanced . . . 127 B-14 Change of de-meaned and de-trended SO2 emission on mayors (mlocal)
en-tering and leaving office - unbalanced . . . 128 B-15 Change of de-meaned and de-trended SO2 emission on mayors (mret51)
en-tering and leaving office - balanced . . . 128 B-16 Change of de-meaned and de-trended SO2 emission on mayors (mret51)
List of Tables
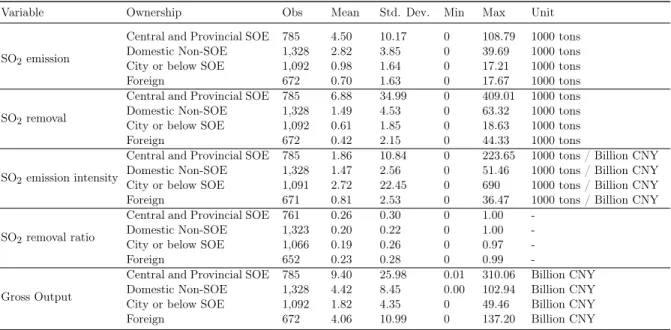
4.1 Balanced and unbalanced information of observed cities . . . 40 4.2 Pollution and economic index summary statistics . . . 41 4.3 Pollution and economic index summary statistics - ownership level, balanced 42 4.4 Leadership’s characteristics - source 1 . . . 44 4.5 Leadership’s characteristics - source 2 . . . 44 5.1 Hypothesized relationships between city-level index and leadership’s
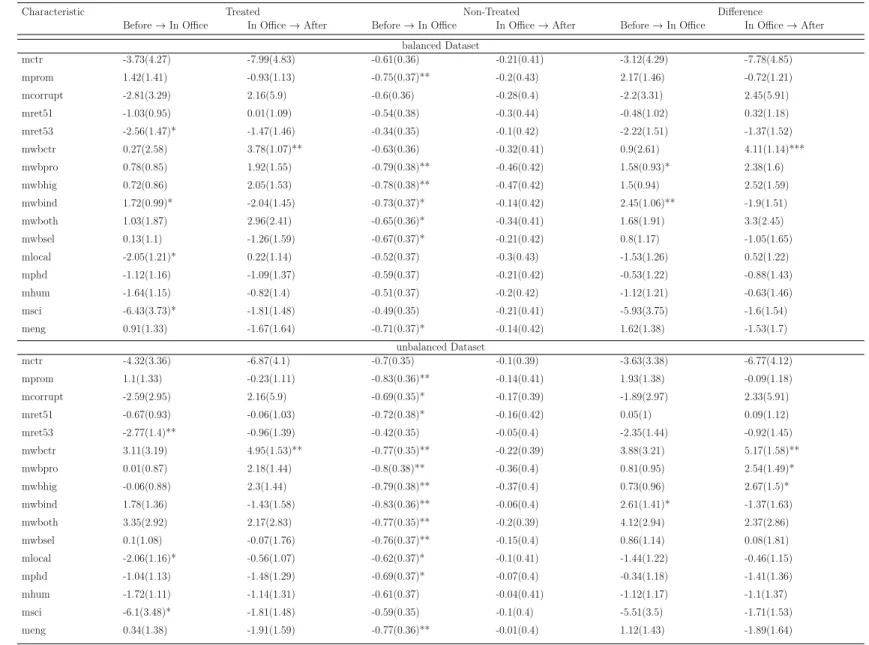
charac-teristics . . . 50 5.2 Two-sided t-test for change of de-meaned and de-trended SO2 index on
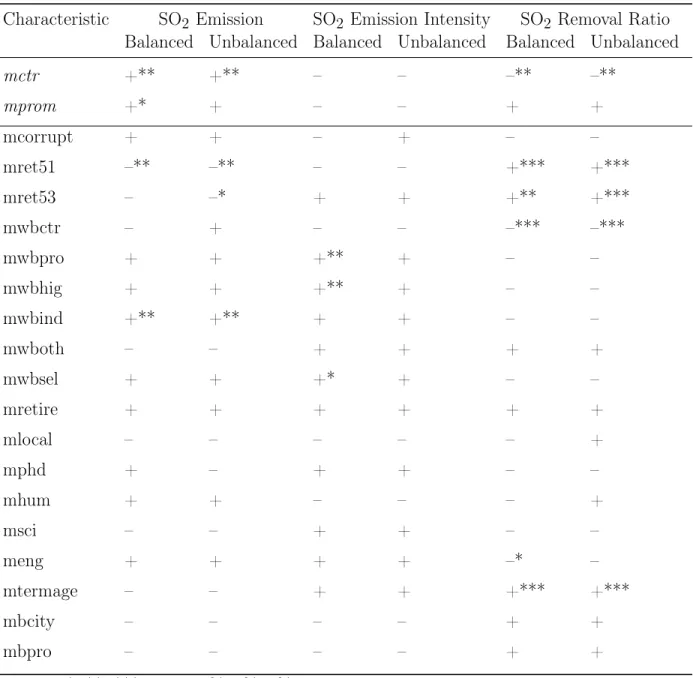
tran-sitions of leaders . . . 54 5.3 Co-efficient directions of leadership’s characteristics in city-level regressions . 60 5.4 Co-efficient directions of leadership’s characteristics in city-ownership-level
regression of SO2 emissions . . . 63
A.1 Pollution and economic index summary statistics - category level, balanced . 81 A.2 Two-sided t-test for change of de-meaned and de-trended SO2 emissions on
transitions . . . 82 A.3 Two-sided t-test for change of de-meaned and de-trended SO2 intensity on
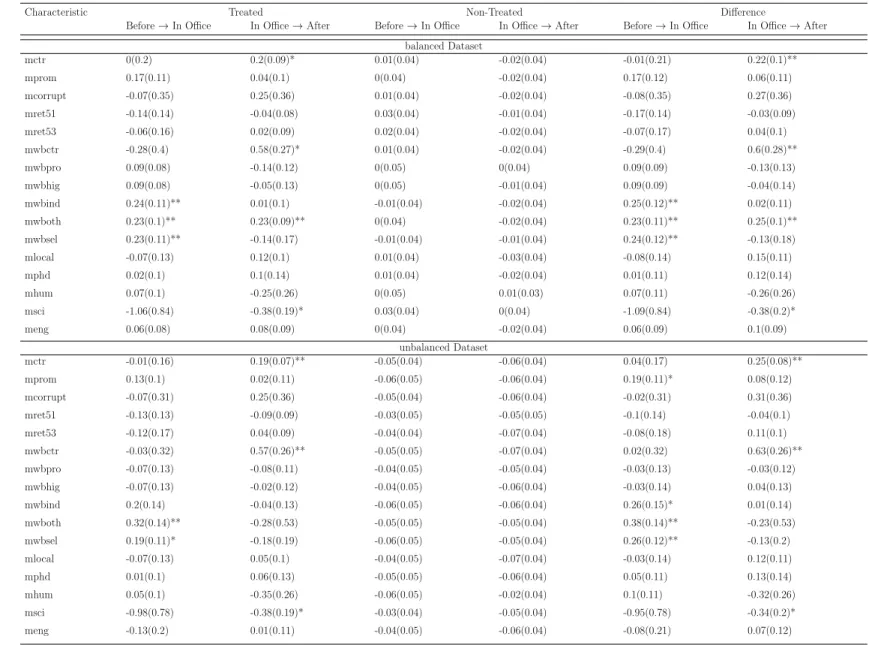
transitions . . . 83 A.4 Two-sided t-test for change of de-meaned and de-trended SO2 removal ratios
on transitions . . . 84 A.5 Two-sided t-test for change of de-meaned and de-trended GDP on transitions 85 A.6 Two-sided t-test for change of de-meaned and de-trended GDP in industry on
transitions . . . 86 A.7 Two-sided t-test for change of de-meaned and de-trended population
(thou-sand) on transitions . . . 87 A.8 Two-sided t-test for change of de-meaned and de-trended average wage (CNY)
on transitions . . . 88 A.9 Regressions of SO2 emissions (1000 tons) - balanced, source 1 . . . 89 A.10 Regressions of SO2 emissions (1000 tons) - unbalanced, source 1 . . . 89 A.11 Regressions of SO2 emission intensity (1000 tons / billion CNY) - balanced,
source 1 . . . 90 A.12 Regressions of SO2 emission intensity (1000 tons / billion CNY) - unbalanced,
A.13 Regressions of SO2 emission removal ratio - balanced, source 1 . . . 91
A.14 Regressions of SO2 emission removal ratio - unbalanced, source 1 . . . 91
A.15 Regressions of water discharge (million tons) - balanced, source 1 . . . 92
A.16 Regressions of water discharge (million tons) - unbalanced, source 1 . . . 92
A.17 Regressions of water meet standard (million tons) - balanced, source 1 . . . . 93
A.18 Regressions of water meet standard (million tons) - unbalanced, source 1 . . 93
A.19 Regressions of water treatment rate - balanced, source 1 . . . 94
A.20 Regressions of water treatment rate - unbalanced, source 1 . . . 94
A.21 Regressions of SO2 emissions (1000 tons), source 2 . . . 95
A.22 Regressions of SO2 emission intensity (1000 tons / billion CNY), source 2 . . 95
A.23 Regressions of SO2 emission removal ratio, source 2 . . . 96
A.24 Regressions of water discharge (million tons), source 2 . . . 96
A.25 Regressions of water meet standard (million tons), source 2 . . . 97
A.26 Regressions of water treatment rate, source 2 . . . 97
A.27 Regressions of SO2 emissions (1000 tons) on different age cut-offs - balanced (1-5) / unbalanced (6-10) . . . 98
A.28 Regressions of SO2 emission intensity (1000 tons / billion CNY) on different age cut-offs - balanced (1-5) / unbalanced (6-10) . . . 98
A.29 Regressions of SO2 emission removal ratio on different age cut-offs - balanced (1-5) / unbalanced (6-10) . . . 99
A.30 Regressions of water discharge (million tons) on different age cut-offs - bal-anced (1-5) / unbalbal-anced (6-10) . . . 99
A.31 Regressions of water meet standard (million tons) on different age cutoffs -balanced (1-5) / un-balanced (6-10) . . . 100
A.32 Regressions of water treatment rate on different age cut-offs - balanced (1-5) / unbalanced (6-10) . . . 100
A.33 Predicting promotion to central government (mctr) . . . 101
A.34 Predicting promotion to central government or other agencies (mprom) . . . 101
A.35 mctr×ownership - balanced . . . 102
A.36 mctr×category - balanced . . . 102
A.37 mwbctr×ownership - balanced . . . 103
A.38 mwbctr×category - balanced . . . 103
A.39 mwbind×ownership - balanced . . . 104
A.40 mwbind×category - balanced . . . 104
A.41 mretire×ownership - balanced . . . 105
A.42 mretire×category - balanced . . . 105
A.43 mlocal×ownership - balanced . . . 106
A.44 mlocal×category - balanced . . . 106
A.45 mwbpro×ownership - balanced . . . 107
A.46 mwbpro×category - balanced . . . 107
A.47 mwbhig×ownership - balanced . . . 108
A.49 mret51×ownership - balanced . . . 109
A.50 mret51×category - balanced . . . 109
A.51 mwboth×ownership - balanced . . . 110
A.52 mwboth×category - balanced . . . 110
A.53 mwbsel×ownership - balanced . . . 111
A.54 mwbsel×category - balanced . . . 111
A.55 mphd×ownership - balanced . . . 112
A.56 mphd×category - balanced . . . 112
A.57 mhum×ownership - balanced . . . 113
A.58 mhum×category - balanced . . . 113
A.59 msci×ownership - balanced . . . 114
A.60 msci×category - balanced . . . 114
A.61 meng×ownership - balanced . . . 115
A.62 meng×category - balanced . . . 115
A.63 mbirthcitysame×ownership - balanced . . . 116
A.64 mbirthcitysame×category - balanced . . . 116
A.65 mbirthprosame×ownership - balanced . . . 117
A.66 mbirthprosame×category - balanced . . . 117
A.67 mprom×ownership - balanced . . . 118
A.68 mprom×category - balanced . . . 118
A.69 mcorrupt×ownership - balanced . . . 119
Chapter 1
Introduction
As a emerging country, China increasingly faces environmental problems as a byproduct of rapid economic growth. As a step towards better understanding the causes of these problems, this thesis explores the relationship between governmental leadership characteristics and environmental performance. In this chapter, I provide the context to understand my research question and introduce the problem generally behind my study. This is followed by a short discussion of my analytical strategy. Finally, the outline of the study is described.
1.1
Background
Governments in emerging countries face the challenge of developing the economy. Simulta-neously, they also face pressure to minimize adverse environmental impacts while fostering economic growth. Therefore, against this backdrop, the government must decide how to pri-oritize economics and environmental goals in a dynamic sense. China, which has grown to be the second largest economy in the world, faces this dilemma. Since 2000, the annual GDP growth of China was reported to be above 8% through 2011 according to The World Bank
(World Bank, 2016). Although these statistics showed that China experienced a tremendous increase in economic development and living standards, China also suffered from an increas-ing severity of environmental degradation. Vennemo et al. (2009) stated that China had become the world’s biggest emitter of SO2 and its total emissions of SO2 were almost the
equivalent of the combination of Europe and United States. In addition, they concluded that the ambient air quality in China was the most degraded in the world. From 2000 to 2006, SO2 emissions in China increased by 53%, from 21.7 Tg to 33.2 Tg, at an annual average
growth rate of 7.3% (Lu et al., 2010). In addition to air pollution, water pollution causes serious concern in China. Approximately, 54% of the seven main rivers were considered to be unsafe for human consumption in China between 2001 and 2005 (10th Five-Year Plan) (World Bank, 2007). At the same time, water pollution worsened water scarcity and the associated annual cost was approximately 147 billion CNY (1% of the national GDP) in 2003 (World Bank, 2007). Health consequences of environmental degradation in China are severe. Because of mortality and morbidity, resulting from PM2.5 air pollution in 2007, work
time of Chinese employees in years was reduced and the estimated total economic losses were approximately 346 billion CNY (1.1% of the national GDP) (Xia et al., 2016). Thus, along with the development of economy, environmental degradation leads to serious concern among policymakers in the Chinese government.
Despite several decades of market-oriented reforms, the China’s economy is heavily supported by state-owned enterprises (SOEs). These SOEs are systematically controlled by the central government. In the political system of China, guoziwei 1 is the agency designed
to control SOEs at different authority levels. The Nomenklatura framework, utilized by the
1The agencies exist on different levels. For example, the state level agency is called State-owned Assets Su-pervision and Administration Commission of the State Council (Guowuyuan Guoyou Zichan Jiandu Guanli Weiyuanhui ): http://www.sasac.gov.cn/. On city level, there exist similar agencies. For example, the similar organization in Shanghai is called State-owned Assets Supervision and Administration Commission of the Shanghai municipal government: http://www.shgzw.gov.cn/.
China Communist Party (CCP), is used to establish systematic Party and governmental leadership in China (Chan, 2004). As a result of this framework, the central Party maintains tight and continued control of those SOEs of significance to the China’s economy. Party committees at different levels even have explicit lists indicating those institutions which can be controlled. Since the Nomenklatura, the Party’s control over SOEs seems not to be diluted and the central Party seeks new ways to intensify party-building in various industries. The strategy is to retain tight authority over large SOEs and release control over relatively small SOEs (zhuada fangxiao) (Chan, 2004). However, there is still partial delegation and financial authority left in small businesses. In particular, the central government still retains the absolute personnel control over large SOEs and industries of significant importance to the infrastructure (e.g., power sector), economic livelihood, and China’s security. On the local level (e.g., city, provincial), this type of control is attributed to local leaders (e.g., mayors, secretaries) through governing channels of guoziwei. The severity of pollution is correlated with economic development, especially in the power sector, which contributes more than 50% of total SO2 emissions in China (Lu et al., 2010). This partial control of economic
participants of significance to the economy by governmental agencies is hypothesized to indirectly impact environmental performance.
There are several reasons why government-industry linkages could affect pollution. Lo-cal politiLo-cal officials partially determine decisions of related SOEs through politiLo-cal control over the personnel system. As a result, motivations of those political officials are hypoth-esized to affect enterprise decision-making processes to some degree. First of all, most of political officials are incentivized by promotion tournaments, which make them care about promotion opportunities (Zhou, 2007). Within the promotion mechanism of China’s polit-ical system, economic performance is considered to be of significance in the evaluation for promotion in the cadre management system in China (Li and Zhou, 2005). Li and Zhou
(2005) emphasized that economic performance was a key driving force for the promotion of political officials. Although this analysis was constructed over the turnover data of provin-cial level leaders, it provides suggestive information that economic performance counts in the promotion of officials below the provincial level as those lower level leaders are centrally man-aged by higher-level governmental leaders (Edin, 2003). Lin (2007) analyzed the promotion mechanism from prefectural level leaders and found that economic performance contributed to the promotion of local leaders. This evidence implies that the political system has a well established mechanism to incentivize local leaders to prioritize economic development and this priority is expected to simultaneously drive the development of related enterprises as well as the associated environmental impacts.
In addition to economic performance, environmental performance has also been con-sidered as an incentive for the promotion of political officials since the 11th Five-Year Plan (FYP) 2 (Zheng et al., 2014). Zheng et al. (2014) found that in recent years in China, the
cadre promotion system was restructured in some aspects and environmental performance became a promising factor with respect to the promotion of officials. As a result, city leaders’ ambitions for political promotion might be expected to more directly affect environmental outcomes. With increasing concern on environmental cleanup alongside economic devel-opment, both the central government and public place pressure on the local government to mitigate environmental pollution (Zheng et al., 2014). However, compared to the GDP growth, the environmental performance’s impacts on promotion is of less significance. Never-theless, economic development induces adverse environmental outcomes as the corresponding increased consumption of energy is positively correlated with the severity of pollution. Thus, city leaders must make trade-offs between economic development and environmental
perfor-2Official information can be found via "Interim Procedures for Comprehensive Assessment and Evaluation of Local Leading Groups and Leading Cadre of CPC and Governments Embodying the Scientific Outlook on Development", published in 2006.
mance. In this study, I expect that mayors with different characteristics are associated with different degrees of trade-offs.
At the local level, there is further evidence that governments and industry leaders are mutually dependent on each other to conduct everyday functions (e.g., tax collection, busi-ness licensing and quality oversight). Prior research showed that SOEs and governments were strongly linked with each other and leaders were frequently exchanged between them (Yang et al., 2013). It is also reasonable to predict that individual leadership might be able to partly determine environmental outcomes in these settings as a result of lack of envi-ronmental monitoring capacity and enforcement system, which results from resource and personnel constraints (Zheng et al., 2014). Local leaders’ impacts on the strategy of SOEs and related industries, together with local leaders’ individual incentives from the politcal system and public, raise the research question: do leaders’ personal characteristics affect lo-cal industries’ environmental performance? In this thesis, the main research question is to explore whether or not individual leader’s characteristics can affect local pollution in China, and to identify potential channels of government-industry linkages through which this relationship arises.
1.2
Analytical Strategy
My analytical approach involves analyzing pollution outcomes in cities as mayors rotate in and out of office using statistical techniques, mainly regression analysis, which relies on a difference-in-difference design. For this, the analysis needs a dataset that includes city-level annual pollution indices and city leaders with detailed personal characteristics. I begin by assembling the dataset using yearly prefectural city-level pollution indices and mayoral characteristics. Then, in order to explore different impacts corresponding to the interaction
between city leaders with different characteristics and different types of enterprises, pollution indices are reported by enterprises of different ownership types in a city. In addition, I use other auxiliary data such as an economic output index to control for related changes in energy use and pollution. For the empirical model, different specifications are considered. In order to obtain robust results, panel regression models are examined based on the data. For instance, to account for the heterogeneity of cities, fixed effects and cluster errors across prefectural cities are included in the model.
1.3
Context, Contribution, and Outline of the Study
In the past several decades, China experienced a rapid economic growth as well as envi-ronmental degradation. Governments and leading groups face severe challenges. Of total environmental damages, SOEs of significance to the national economy make a non-negligible contribution. However, these SOEs are systematically controlled by the governmental lead-ership. Thus, governmental leadership directly confronts trade-offs between economy and environment. The cadre management system in China rotates leaders across positions and departments in a process which is exogenous to environmental outcomes and provides a quasi-experimental setting for me to investigate the correlation between mayors’ personal characteristics and local polluting behaviors. Overall, this study represents a basic quantita-tive analysis of the leadership’s impacts on environmental performance and lays a foundation for studying the relationship between institutional management and pollution.
The remainder of the thesis is organized as follows. In chapter 2, the motivation for this study is described in detail. In chapter 3, the policy setting in China is depicted. Chapter 4 provides the description of the respective datasets used in my analysis. In chapter 5, my empirical strategy and hypothesis are presented, the econometric models are established, and empirical results are reported and interpreted. Chapter 6 concludes the analysis.
Chapter 2
Motivation
In this chapter, I discuss the motivation for this study in technology and policy. First, I introduce the current setting in China, focusing on how energy use has created various ad-verse environmental impacts. Then, I discuss the cause of this problem in several directions. Finally, the focus of this study is introduced.
2.1
Setting in China
Over the last several decades, China’s economy has experienced a tremendous growth. How-ever, this rapid economic growth in China has been accompanied by a large increase in energy consumption, resulting in severe environmental damages (Vennemo et al., 2009). At the same time, it is also associated with urbanization and industrialization in terms of in-creasing number of population, industries, and enterprises. Looking back at the development of China, it has been heavily supported by heavy industries since 1980s, especially those in energy intensive sectors. In 2005, the total consumption of coal was about 2.2 billion tons, which was about 3 times the consumption of coal in 1978 (China Statistical Yearbook, 2005,
● ● ● ● ● ● ● ● ● ● ● ● ● ● ● ● ● ● ● ● ● ● ● ● ● ● ● ● ● ● ● ● ● ● ● ● ● ● ● ● ● ● ● ● ● ● ● ● ● ● ● ● ● ● ● ● ● ● ● ● ● ● ● ● ● ● ● ● ● ● ● ● ● ● ● ● ● ● ● ● ● ● ● ● ● ● ● ● ● ● ● ● ● ● ● ● ● ● ● ●
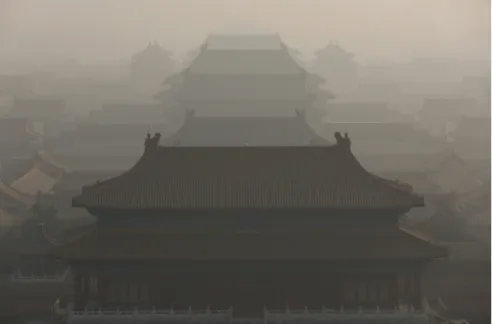
Figure 2-2. Haze over the Forbidden City in Beijing on December 20, 2016. (McCann, 2016)
2006). Air pollutant emissions are closely related to energy consumption, because of the large reliance on fossil fuels. Thus, emissions of air pollutants associated with energy consumption have been experiencing the similar trend of growth. This is shown in Figure 2-1: the average GDP and average GDP in industry for mega cities are positively correlated with average SO2 emissions of each city over the period 2003 - 2010. The number of days of poor air
qual-ity in mega cities is increasing. This can be reflected by a recent figure of Beijing: Figure 2-2. On average, about 10-30% of days exceeded Grade-II1 standards in Beijing, Shanghai,
Pearl River Delta region, and the respective vicinities (Chan and Yao, 2008). About 22% of cities in China with SO2 concentrations exceeded the Grade-II standard and this caused
acid rain problems in 38% of cities (Report of the State of the Environment in China, 2005). Negative consequences of pollution in air, water, and other circumstances damage physical resources, human health, and life quality. Solving this problem requires us to look further at China’s economy, which induces increased energy consumption and the respective pollution 1Grade-II (SO
2) of Chinese National Ambient Air Quality Standards (CNAAQS) is 0.15 mg/m3 for daily averages and 0.06 mg/m3 for annual averages.
in the surrounding environment. In response to environmental problems, policies have been enacted by the government. However, top-down implementation of environmental policy interacts with local economic compositions and interests (Eaton and Kostka, 2014; Schreifels et al., 2012). Thus, a detailed understanding of the organization of China’s economy and the respective leadership can give us more insights into the origins of the pollution problem and how the situation can be improved.
My analysis starts from a summary of adverse impacts from air pollution. Then, I discuss how the China’s economy is organized, the role of SOEs, and how air pollution is related to economic activities. Next, I talk about how governments interact with industries. Until a reasonable linkage between governments and industries is established, I further discuss the motivation for this study and how it is related to technology and policy.
2.2
Adverse Impacts from Air Pollution
Health impacts of air pollution are well studied. Usually, negative impacts are measured in terms of morbidity and mortality. In order to estimate economic costs, metrics used frequently are willingness-to-pay (WTP) and associated additional costs in medical system. City level analysis of health costs suggests that consequences of air pollution cannot be neglected. Wang and Mauzerall (2006) implemented an integrated assessment procedure to estimate impacts of air pollution in Zaozhuang of China on public health. They showed that the estimated health cost associated with anthropogenic emissions in 2000 of Zaozhuang was approximately 0.28 billion USD and this amount was equivalent to 10% of the GDP in the city. Additionally, the projected health cost of the same cause in 2020 was about 2.7 billion USD, which accounts for 16% of the projected GDP in the same city. Zhang et al. (2010) connected energy use, air pollution, and public health impacts for an integrative assessment
of air pollution in Taiyuan for 2000. The result suggested that the induced excessive deaths associated with particulate matter (PM) pollution in 2000 were about 2,200 in Taiyuan. Upon monetization of the health impact, this damage was equivalent to 0.8 – 1.7 billion CNY, which was within the range 2.4 – 4.9% of the city’s GDP in 2000. For mega cities, Kan and Chen (2004) estimated that the total economic cost of health impacts attributed to PM air pollution in urban areas of Shanghai in 2001 was approximately 625.40 million USD. This number was equivalent to 1.03% of GDP of the city. On the country level, Matus et al. (2012) utilized an expanded version of a computable general equilibrium model to analyze the health damage from air pollution in China. The conclusion is that although the damage from air pollution in relative terms declined over the last decades, the cost in absolute terms increased to a high degree as the whole economy of China grew.
In addition to air pollution-related health impacts, damages also include polluted rivers, poor quality of drinking water, depleted ground water, and other environmental damages (Vennemo et al., 2009). Apart from this, a great deal of food produced in China is contam-inated with pollutants. Wang et al. (2001) presented that in a short period, the irrigation of sewage water could induce increased metal in soil and crops and industrial wastes con-tributed partly to this type of contamination. Wang et al. (2003) showed that in polluted sites of China, heavy industries, metal mining, smelting and untreated wastewater induced heavy metal contamination in soil. They also pointed out that heavy metal contamination was one of the biggest health problems in China and part of this contamination was traced back to industrial activities (He et al., 2013; Li et al., 2014). Another important damage to environment from SO2 emissions in China was the acidification of soil (Duan et al., 2013).
Increased pollution in China can hinder efforts in production of food. Chameides et al. (1999) provided evidence that ozone pollution could affect crop yield in China and this effect was growing even in non-urban areas. Industrial enterprises induce agricultural loss as well.
Wei et al. (2014) analyzed and assessed 2,069 state-monitored units and the associated loss was estimated to be around 1.43 billion USD.
2.3
China’s Economic Reform and SOEs
Although there is a decline of the output share of SOEs within the whole economy in China, the central Party maintains tight and continued control over SOEs of economic significance (Chan, 2004). The reform of China’s SOEs started from 1978 and the ultimate goal was to transform China’s economy into a market economy with Chinese characteristics, as shown in Figure 2-3. This is called captalism with Chinese characteristics, which is a function of political balance between market-driven China and state-led China (Huang, 2008). This balance is realized through two channels. The first tool is to encourage explicit private entrepreneurship and on the other hand, the government is to privatize part of SOEs. The financial reform is simultaneous and it is designed to channel a significant high level of credit to private sectors. In general, the reform was implemented with three characteristics:
1978 – 1980 The goal of this period is to separate ownership and management within SOEs. In addition, ownership is extended to broader range. 1981 – 1982 This is the trial period to establish the economic responsibility system. It is to improve the operating efficiency and innovating capacity of SOEs. 1983 – 1986 The goal of this period is to change profit mechanism to tax mechanism. This is to improve the public finance-revenue. 1987 – 1991 After the first three periods, the operating efficiency and profiting capacity of SOEs are highly improved. In this period, the central government is to improve the business mechanism. 1992 – In this period, the goal is to establish a modern enterprise system. China is seeking more effective reform across all aspects of SOEs in order to make them competitive in global.
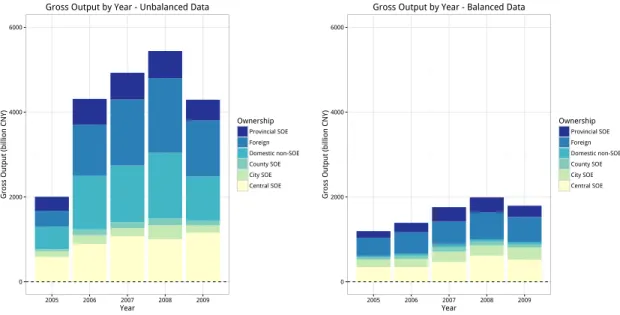
decentralization in property rights of SOEs, change in enterprise management structure, and gradual liberalization of resource allocation (Li, 1997). In 1978, SOEs dominated China’s economy in almost every aspect and they accounted for approximate 77.6% of the industrial output (Lin et al., 1998). This number has declined gradually since then (Jefferson et al., 2000), which was due to both declining output in SOEs and an increase of private and foreign enterprises’ output. However, importantly, SOEs still employ a high percentage of urban workers and control large scale fixed assets in China’s economy. This is realized by retaining SOEs’ role in controlling fundamental sectors (e.g., power, telecommunication, and energy) in China. Figure 2-4 is compiled based on an unbalanced and balanced dataset including type information of enterprises in my analysis and it shows the absolute gross output for enterprises of different types of ownership from 2005 to 2009. Values are aggregated over enterprises in the whole country and rely mainly on data from an industrial survey of China.
Figure 2-4. Economic output of enterprises of different types in China
Despite several decades of reform and privatization of SOEs, government-industry link-ages remain tight, especially in energy and resource intensive sectors. For example, the energy consumption of the entire economy in China was 3,480 million tons of coal
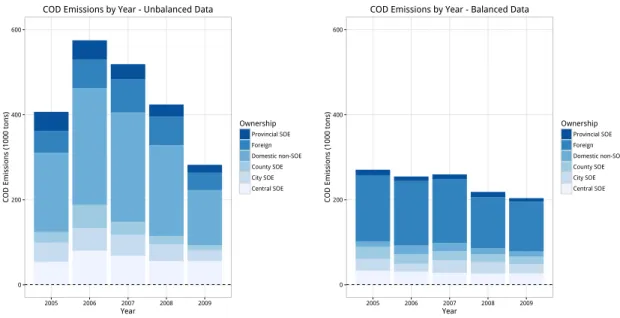
equiva-Figure 2-5. Emissions of chemical oxygen demand (COD) of enterprises of different types in China
Figure 2-6. Emissions of sulfur dioxide (SO2) of enterprises of different types in China
lents (Mtce) in 2011. Of the total energy consumption, industrial energy consumption was 2,464 Mtce in the same year and of this, the energy consumption of manufacturing was 2,004 Mtce. Finally, the respective energy consumption in the iron and steel sector was 589 Mtce, which accounted for 29%, 24%, and 17% of the manufacturing, industrial, and total
energy consumption respectively (China Energy Statistical Yearbook, 2012). The estimated direct CO2 emissions within the iron and steel industry was 920 million tons in 2007 in
China (Shangguan et al., 2010) and this number was approximately equivalent to 15% of total emissions in China (Xu et al., 2013). Furthermore, this industry is tightly controlled by the state. On the structure of the ownership in the enterprise, the average number of employees in state-owned and state-holding enterprises is approximately equivalent to 41% of total employees in all iron and steel enterprises (Lin and Wang, 2014).
When looking at SOEs’ impacts on the environment of China, the structure of chemical oxygen demand (COD) and SO2 emissions in China is illustrated in Figure 2-5 and Figure
2-6 respectively and the value is the aggregate value of all firms belonging to the same type of enterprise. SOEs play an important role in China’s emissions and pollution related industries.
2.4
Government-industry Linkages
Ties between SOEs and the government can be very close and SOEs in reality are system-atically controlled by the central government. In the political system of China, guoziwei is the agency designed to control SOEs across different authority levels (e.g., state (central) level, provincial level, city level, and county level). The guoziwei is a governmental agency and the personnel system is partially determined by local leadership. In particular, rotation of personel between SOEs and governmental agencies exists. SOEs’ leaders often rotate in and out of government positions in some situations (Yang et al., 2013). For example, the mayor of Nanjing in 2013, Hongkun Jiang, was previously the manager and party secre-tary of the state-owned Mechanical Industrial Company of Shazhou County. Such personnel management in the system is one way to cultivate the linkages between governments and
industries.
Local leaders impact the implementation of policy principally due to three mechanisms in China: fiscal decentralization from the central government, unchanged economic incentives to local officials, and highly selective toleration of corruption behaviors (Fan and Grossman, 2001). Based on these three mechanisms, certain linkages between governments and indus-tries can be established.
Fiscal decentralization facilitates more linkages between local leadership and industries. Looking at the evolution of SOEs, they were originally developed not under market conditions but under the central plan prior to the economic reform. Thus, many of them retain social-ist charactersocial-istics and these SOEs work as pillars in the region in terms of providing social benefits and welfare. In order to carry out this function, a coalition between local govern-ments and SOEs is established in order to maintain SOEs’ business (Zhu, 1999). Apart from this, fiscal decentralization facilitates collusion between local municipal governments and enterprises’ managers when there is fiscal pressure from the central government (Broadman, 1995); and, this collusion can be beneficial to both local leadership and SOEs’ managers as the increased revenue of enterprises can yield better evaluation of the performance for both government level and enterprise level leadership. This was confirmed by Li and Zhou (2005) and Lin (2007): better economic performance can contribute to the promotion of local leaders. Additionally, it was pointed out by Gordon and Li (1997) that local officials have much more strongly supported new non-state firms in China as local governments can receive additional taxes from those new firms.
Corruption is also a form of interaction between officials and enterprise leaders. The corruption in China emerges as a problem while in some cases, corruption can facilitate eco-nomic development (Huntington, 2006; Lui, 1985). Fan and Grossman (2001) argued that the political advantage of corruption was to provide a way to compensate those local officials
who promoted the economic development. In China, the corruption behavior is embodied in two ways: tanwu shouhui and nuoyong gongkuan. The first behavior refers to extracting bribes or arranging nepotistic favors and the other refers to misappropriating public property or public funds for private benefits by officials. Thus, officials in the government are reason-ably assumed to maintain an invisible linkage with local enterprises via tanwu shouhui. For example, some selected corruptions are published by the Central Commission for Discipline Inspection (CCDI) 2.
2.5
Motivation for Research
Severe environmental damages have accompanied rapid economic growth in China during the past several decades. In 2015, the Ministry of Environmental Protection estimated that economic burden of pollution could be as high as 6% of GDP during the Eleventh Five-Year Plan (2006-2010). Significant adverse impacts from air pollution include both residents’ health and environmental damages. In China’s economy, SOEs still play an important role and these SOEs retain tight control of fundamental business, especially in energy and re-source intensive sectors, which emit the most of the re-source of air pollution. Linkages between SOEs and governments are pretty close and leaders rotate across SOEs and governmental agencies. In addition, top-down implementation of environmental policy can be ineffective due to local economic compositions and interests. Local economic interests are embodied by government-industry coalition, private incentives of promotion, and corruption. Therefore, analyzing solutions to China’s environmental problems leads us to take a close look at the relationship between local leadership’s characteristics and environmental performance. The connection is hypothesized to be built up via invisible government-industry linkages. Thus, a thorough understanding of the correlation between leadership’s characteristics and envi-2The official website ishttp://www.ccdi.gov.cn/.
ronmental performance can provide insights into improving the surrounding environment via institutional management.
2.6
Linkages to Technology and Policy
Leadership plays an important role in determining technology choice and adoption. City leadership can shape the industrial organization of a city to some degree. This is realized by the invisible government-industry linkage. In this sense, leadership’s personal preference across different technologies can be reflected by the evolution of technologies in the respective city. Here, I begin the research by understanding city leadership’s impacts on the outcome of technologies; and, the city leadership’s impacts on the choice of technologies in the city could be further investigated. The result informs insights into the interaction between technology, policy, and society.
An important question is whether or not city leadership would foster the implementation and operation of SO2 removal facilities. Particularly, flue gas desulfurization (FGD) is the
main technology to improve SO2 removal index in cities. The correlation between SO2
removal rates and mayors’ personal characteristics can tell us which mayors might promote the usage of these technologies. In the future, related follow-on work could be developed in order to understand similar questions such as how institutional management affects the development of the electrification of transportation and other clean energy transitions.
Chapter 3
Policy Setting in China
In this chapter, I provide the history of SO2 regulation in China, as shown in Figure 3-1.
Schreifels et al. (2012) described the evolution of China’s SO2 control systematically. I focus
on the SO2 control during the 10th and 11th Five-year Plans (FYP), which spanned the time
period of my analysis. In general, the national policy imposed a target of 10% reduction at the beginning of each of the FYP. However, the realized reductions within the two periods were quite different. This phenomenon is attributable to several factors, to be discussed.
3.1
Market-based Tools
SO2 is the pollutant which has received the most regulatory attention from the Chinese
government. As a major contributor to surrounding air quality and acid rain, SO2 has
been regulated via a number of policy instruments and programs in China since 1990s. In fact, regulation was proposed as early as 1979’s "Trial Environmental Law" and 1982’s "Interim Procedure on Pollution Charges" but was delayed due to a lack of monitoring and enforcement capabilities.
The pollution levy has been implemented by the Chinese government as one of the market-based tools in regulating SO2 emissions. At the beginning, the idea was to charge
those emissions above a certain limit. However, owing to the limited monitoring and enforce-ment mechanism, the governenforce-ment altered the levy impleenforce-mentation in several dimensions to improve the capability of the levy such as changing the level of the levy, applying the levy to total emissions instead of those above the limit, and covering different industries and regions. However, the effectiveness of the levy was not obvious (Finamore and Szymanski, 2000). This is in part caused by the political system. In earlier phases of the policy, most of the levy was recycled to compensate for the pollution control cost of local firms, and the rest of the revenue was used to fund the local Environmental Protection Bureau (EPB) (Wang and Wheeler, 2005). However, in most cases, firms did not take advantage of the recycled levy to invest in reducing emissions (Ellerman, 2002). The levy was, in many cases, cheaper than emission control cost in later phases. This made firms directly pay the levy without reducing emissions (Gao et al., 2009). What’s more, local EPBs were not powerful enough to enforce the implementation of the levy. For instance, the local government negotiated with local EPBs to reduce the levy in order to protect local firms in some cases, possibly due to the linkage between governments and industries.
In addition to the levy, subsidies have been utilized by the government to compensate for the cost of adopting flue gas desulfurization (FGD, i.e., SO2 scrubbers) in curbing emissions
from power plants. At the initial stage, this policy was not effective since subsidies were targeted at the installation of FGDs, while they were found in some cases not be operated once installed (Schreifels et al., 2012). Thus, most power plants only installed the equipment without running them. The portion of FGDs in power plants actually in use was quite low due to operational costs, lack of trained staff, and lack of effective monitoring systems by the end of 2005. In order to improve the usage of FGDs, the high-level administration
consid-ered and implemented several solutions including installing continuous emission monitoring systems (CEMS), differentiating the premium based on the usage of FGDs, and introducing a franchising mechanism for desulfurization (Li et al., 2011). The usage of FGDs increased to 86% by the end of 2010 (China Electricity Council, 2011).
Pollution Levy
1978: "Trial Environmental Law" included pollution levy. 1982: "Interim Procedure on Pollution Charges" specified the
detail of implementation. 1998: The SO2 discharge rate is altered. 2003: The rate is increased. 2004: The rate is increased. 2007: The rate is increased. Subsidies for Low SO2 Electricity 2003: Price premium is applied to electricity generated with FGD. 2007: Continuous Emission Monitoring System is implemented on coal-fired power plants. Emission Standards 1991: Emission standards are brought online and SO2 emission
limits are stipulated. 1996: Maximum SO2 concentration is issued (GB13223-1996). 2003: Emission standards are revised (GB13223-2003). 2007: Mandatory boiler technology is issued. 2011: Emission standards are revised again. Total Emission Control 1988: Total Emission Control (TEC) is proposed. 9th FYP: TEC is implemented with industrial solid waste and 11 air-pollution related pollutants. 10th FYP: The number of TEC targets are reduced to 5. 11th FYP: Only SO2 and Chemical Oxygen Demand are included.
Technology Mandates
10th FYP: Phasing out small boilers.
2007: Small boilers closure schedule is issued by MEP and
NDRC.
Figure 3-1. Timeline of emission policy evolution in China
3.2
Command-and-control Tools
The economy in China is characterized as market economy with Chinese characteristics. Local officials and SOEs in China are systematically controlled by the central government. This fact makes China an easier context in which to implement top-down command-and-control policy. The command-and-command-and-control tools can be classified into two categories: emission
(performance) standards and technology mandates.
China introduced the first emission standard for power plants in 1991, focusing on regu-lating SO2 emissions. To account for differences in conditions, the standard is differentiated
across power plants based on different factors such as age, location, stack height, and metero-logical conditions. Power plants using high-sulfur coal have more stringent standards, while the standard is relaxed for plants with low-sulfur coal. Regionally speaking, power plants in eastern China face stricter limits than in western China. The idea is to help western areas to develop their economies; also, environmental conditions in western China are much better than that in eastern China (Schreifels et al., 2012). Since the enactment of this standard, it has been revised several times to be more stringent as technology has become available and economies have been more able to bear the cost.
In addition to firm-level control, the central government also introduced total emission control (TEC) on particular pollutants, such as SO2, in the 1990s. The TEC policy is to set
a cap on total emissions of SO2 compared to the level of the final year in the previous FYP.
The mechanism of the TEC policy is to distribute emission limits gradually from the central to local government (Schreifels et al., 2012). On the ground level, the local administration then negotiates a local allocation plan with stakeholders. Local governments implement and enforce the TEC program. Furthermore, failure to meet the TEC policy does not involve any violation of law, as a result of which the policy was not effective during the 10th FYP.
Technology mandates in China involve three elements: upgrading existing facilities, in-stalling additional pollution-control facilities, and phasing out old or inefficient facilities. Williams and Kahrl (2008) mentioned that China introduced mandatory technology require-ments on capacities and boiler technologies for new coal-fired generating units. This has improved the technology across coal-fired power plants on average. As noted previously, FGDs are subsidized by the local government to be installed in power plants. Although
there were problems with the implementation of this policy, the administration in China has actively sought to figure out solutions to these problems. For example, the CEMS was cre-ated to improve the data accuracy (Zhang and Schreifels, 2011). Along with the fast growth of the economy in China, many small and inefficient power plants were constructed to meet the resulting growth in demand for electricity prior to the 10th FYP. Due to the inefficiency of these power plants, the central government planned to phase them out. However, this process was far more difficult than expected, owing to the lack of incentives, local resistance, and continued growth in demand for electricity (Schreifels et al., 2012). To make this much easier, the China’s administration invented flexible ways to accelerate the process (Williams and Kahrl, 2008), and it came to be effective during the 11th FYP.
3.3
Total Emission Control of SO
2
in the 10th and 11th
Five-Year Plan
With the degradation of the environment, environmental development has gradually become a significant part of the FYP. As one of regulated pollutants, TEC of SO2 entered both the
10th and 11th FYP. The national policy imposed a target of 10% reduction during both the 10th and 11th FYP. However, realized reductions of SO2 emissions within these two periods
are quite different (Schreifels et al., 2012). This phenomenon is attributed to several factors to be discussed.
During the 10th FYP, the SO2emission reduction was set to be 10% in 2005 compared to
the level in 2000. However, it was very difficult: SO2 emissions were reported to increase by
28% in 2005 compared to the level in 2000. Among many factors contributing this significant increase of SO2 emissions, economic growth was the most significant. During the 10th FYP,
economy was accompanied by a similar growth of energy consumption, especially coal. In order to meet the growing consumption of electricity, the previous plan to close inefficient power plants encountered significant resistance for several reasons including shortages of electricity, opposite from local administrations, and lack of incentives. Apart from this, local leadership generally prioritized economic development instead of environmental management, as environmental progress did not enter into the evaluation score of local officials in the 10th FYP (Xu, 2011a). On the other hand, lack of effective enforcement mechanisms made the implementation of TEC by local governments more difficult, as exceeding TEC limits does not involve any violation of the law, and polluters do not face any penalty. Thus, total SO2
emissions increased (instead of decreased) during the 10th FYP.
During the 11th FYP, the SO2 emission reduction was set to be 10% in 2010 compared
to the level in 2005. SO2 emissions were reported to decrease by 14% in 2010 compared
to the level in 2005. It is important to note that the benchmark level of the 11th FYP is the SO2 emission level in 2005 while the benchmark level of the 10th FYP is the SO2
emission level in 2000, and it is clear that the emission level in 2005 is much higher than that in 2000. However, both FYPs covered periods that were characterized by rapid economic growth. Therefore, although the benchmark level of the 11th FYP was higher than that in the 10th FYP, the environmental improvement was still much better in the 11th FYP than that in the 10th FYP. Several factors contributed to this progress. First, the central government paid closer attention to the environmental achievement of local governments and therefore, the supervision and monitoring system became more stringent (Moore, 2011; Xu, 2011a). At the same time, the Ministry of Environmental Protection (MEP) was elevated to a higher-level ministry in 2008. This increased its power and authority with respect to other government bodies, thereby improving its ability to enforce regulation. Second, technological innovation and knowledge improvement enabled a growing rate of installation
and operation of FGDs (Xu, 2011b), leading to a greater degree of end-of-pipe SO2 removal.
Third, the process to close small or inefficient power plants was accelerated by designing several incentive mechanisms by local administrations. All in all, more effective measures were adopted to improve the environment, and China’s government was equipped with more experience in terms of environmental management and control in the 11th FYP.
3.4
Government-industry Linkages in Policy Setting
SOEs are always led by guoziwei, the agency to manage state-owned assets, on different authority levels. As guoziwei is part of the government, the linkage between governments and industries is established.
From the perspective of policy, binding agreements exist between the government and state-owned industries to reduce SO2 emissions associated with SOEs. The central and local
government may consider the performance of pollution control measures taken by enterprises as one element in the evaluation of their managers (Guttman and Song, 2007). In addition to mandatory control and enforcement, the central and local government also provide suitable incentives (e.g., subsidies, special loans) for enterprises to adopt efficient pollution control measures such as installing FGDs, consuming low-sulfur energy, and updating existing facil-ities.
On the other hand, local interests might interact with central directives negatively or positively. In China, local EPBs face dual leadship: local governments and the central MEP. While the MEP directs them to fulfill national targets, the local government must provide the necessary resources (Schreifels et al., 2012). However, this local support might make the local EPB’s behaviors conflict with the central MEP’s objectives, as regional benefits are more important to local leadership in some cases and local leaders are expected to affect
local EPBs’ behaviors to protect local benefits. One reason for the non-compliance with respect to environmental targets in the 10th FYP is that local governments often prioritize economic development to environmental achievement. Thus, there existed cases where local leadership required the EPB to cut levies, in the name of protecting local economies. It is also possible that the monitoring system is weakened owing to the strong linkage between the local government and industries. From the perspective of local leaders, they may impose preference or discrimination across enterprises of different authority levels when negotiating allocation of national targets.
To conclude, the policy system enables the forming of linkages between the leadership and the decision-making processes of industries. This is reflected while not limited by facts mentioned above: negotiation of policy implementation, conflict of interests between local agencies and the central objective, and inability of monitoring system. However, the local leadership can play a role in the arising of these facts; and, this leads to my hypothesis that local leaders can directly or indirectly impact environmental outcomes via government-industry linkages.
Chapter 4
Data Description
In this chapter, datasets used in the analysis are introduced. Two main datasets are utilized in my analysis: city-level dataset and city-ownership dataset. In city-level analysis, I analyze leaders’ impacts on the city-level environmental performance. In city-ownership analysis, the city-level polluting index is split into several categories - defined by firms’ authority levels. In this sense, the dataset allows me to investigate the strength of linkages between leaders and enterprises of different authority levels.
4.1
City Level Analysis
Prefectural city level environmental performance is observed. At the same time, rotations of leaders across different prefectural cities are available. In some cases, a few cities and leaders’ information is missing. Due to the limitation of data sources (e.g., SO2 emissions), the time
spans from year 2003 to 2010. In general, the number of distinct cities in the dataset is 276. Totally, there are 2,156 observations. However, not all cities are observed for all years while each city is at least observed for 4 years. Table 4.1 shows the balanced and unbalanced data
sets respectively1. Additionally, Figure B-1 and Figure B-2 visualize the number of observed
cities in each province across the whole country. It is noted that Xizang (Tibet) does not have any observations. In the rest of this section, I spend more time discussing the pollution data observed in my dataset. For leaders’ characteristics, I have two different sources and I talk about them separately. Finally, I compare leaders’ characteristics in different sources.
Table 4.1. Balanced and unbalanced information of observed cities
Datasets unbalanced balanced Total
Number of years observed 4 5 6 7 8
-Number of cities observed 2 1 8 25 240 276
4.1.1
Pollution and Economic Index
The city level pollution data is from a commercial data source: CEIC 2. It includes
accu-rate micro and macro economic and pollution data for prefectural level cities in China. In my analysis, I heavily investigate three important pollution indices: SO2 emissions, SO2
emissions intensities 3, and SO2 removal ratios. Within these indices, SO2 emissions and
end-of-pipe SO2 removals are directly reported. For others, the definition is given by:
SO2 emissions intensity =
SO2 emissions
Monetized Industrial Output (4.1)
and
SO2 removal ratio =
SO2 removal
SO2 removal + SO2 emissions (4.2)
where the SO2 removal is the end-of-pipe removal of SO2. Other economic indices are also
observed in the data such as GDP, GDP in industry, and population for each city. All the 1Balanced cities are observed in 8 years while unbalanced ones are observed in less then 8 years: 2003 - 2010. 2The dataset can be found on https://www.ceicdata.com/en.
summary statistics are shown in Table 4.2.
Table 4.2. Pollution and economic index summary statistics
Variable Obs Mean Std. Dev. Min Max Unit
SO2emission 2,156 64.48 64.59 0.01 710.8 1000 tons
SO2removal 2,089 78.15 520.15 0.01 18399.5 1000 tons
SO2emission intensity 2,156 2.64 3.42 0.00 43.13 1000 tons / Billion CNY
SO2removal ratio 2,089 0.33 0.24 0.00 0.996
-Water discharge 2,155 80.78 109.49 0.17 912.6 Million tons
Water meet standard 2,155 75.30 104.84 0.17 880.72 Million tons
Water treatment rate 2,155 0.90 0.13 0.01 1
-GDP 2,156 94.96 138.74 3.18 1716.6 Billion CNY
GDP in industry 2,156 47.53 65.81 0.91 721.83 Billion CNY
Population 2,115 4346.17 3081.67 163.7 28846 Thousand
GDP in agriculture 2,156 9.18 7.11 0.08 68.538 Billion CNY
GDP in service 2,156 38.29 75.21 0.5 1060.1 Billion CNY
Per capita GDP 2,152 21180.38 17093.44 2126 175125 CNY
Dust emission 2,140 858.08 1066.52 0.00 9065.052 1000 tons
Dust removal 2,152 25.38 25.15 0.03 250.308 1000 tons
GDP growth rate 2,153 0.18 0.12 -0.74 3.929471
-4.2
Enterprise Level Analysis
The firm level balanced pollution data is from MEP 4 of China. The pollution data was
collected from 2005 to 2009 by the MEP. The data covers 32 provinces, direct-controlled municipalities 5, and autonomous regions 6. In addition, due to the limited availability
of data, the pollution index is not available in Xizang (Tibet). Target establishments are determined by a collaborative effort between the central MEP and regional MEPs. It includes principal sectoral emitters of pollution such as agriculture, forestry, pasturage and fishery, mining and quarrying, manufacturing, production and supply of electric power and heat, production and supply of gas, and construction.
The MEP requires each establishment to self-report the pollution data for the previous 4Ministry of Environmental Protection of the People’s Republic of China: http://www.mep.gov.cn/. 5There are four direct-controlled municipalities in China: Beijing, Tianjin, Shanghai, and Chongqing. 6There are five autonomous regions in China: Xinjiang, Inner-mongolia, Ningxia, Guangxi, and Xizang.
year and it also maintains monitoring and occasional investigating activities on polluting behaviors of targets. Any cheating behavior is to be punished (e.g., fining, deterring SOE leaders’ promotion). Sources of pollution appearing in the data are SO2 emissions, removal
amount, and the respective economic gross output.
4.2.1
City and Ownership
In this part, I aggregate economic and pollution data according to the ownership type of enterprises. Six types are considered in my analysis: Central SOE, Provincial SOE, City SOE, County SOE, Domestic non-SOE, and Foreign. They are shown in Table 4.3.
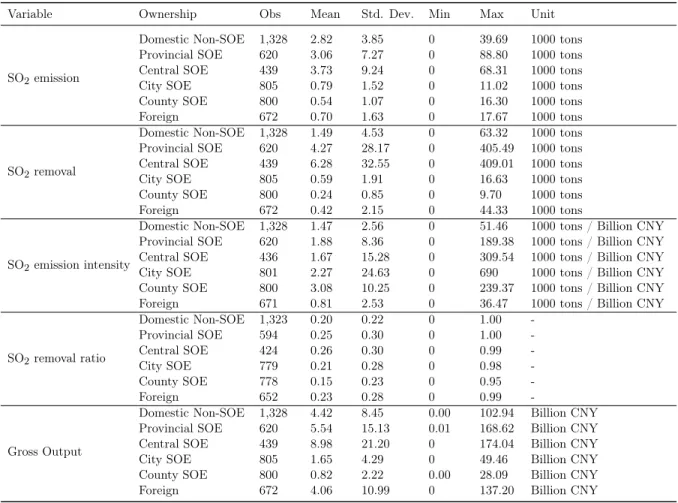
Table 4.3. Pollution and economic index summary statistics - ownership level, balanced
Variable Ownership Obs Mean Std. Dev. Min Max Unit
SO2emission
Domestic Non-SOE 1,328 2.82 3.85 0 39.69 1000 tons Provincial SOE 620 3.06 7.27 0 88.80 1000 tons Central SOE 439 3.73 9.24 0 68.31 1000 tons City SOE 805 0.79 1.52 0 11.02 1000 tons County SOE 800 0.54 1.07 0 16.30 1000 tons Foreign 672 0.70 1.63 0 17.67 1000 tons
SO2removal
Domestic Non-SOE 1,328 1.49 4.53 0 63.32 1000 tons Provincial SOE 620 4.27 28.17 0 405.49 1000 tons Central SOE 439 6.28 32.55 0 409.01 1000 tons City SOE 805 0.59 1.91 0 16.63 1000 tons County SOE 800 0.24 0.85 0 9.70 1000 tons Foreign 672 0.42 2.15 0 44.33 1000 tons
SO2emission intensity
Domestic Non-SOE 1,328 1.47 2.56 0 51.46 1000 tons / Billion CNY Provincial SOE 620 1.88 8.36 0 189.38 1000 tons / Billion CNY Central SOE 436 1.67 15.28 0 309.54 1000 tons / Billion CNY City SOE 801 2.27 24.63 0 690 1000 tons / Billion CNY County SOE 800 3.08 10.25 0 239.37 1000 tons / Billion CNY Foreign 671 0.81 2.53 0 36.47 1000 tons / Billion CNY
SO2removal ratio Domestic Non-SOE 1,323 0.20 0.22 0 1.00 -Provincial SOE 594 0.25 0.30 0 1.00 -Central SOE 424 0.26 0.30 0 0.99 -City SOE 779 0.21 0.28 0 0.98 -County SOE 778 0.15 0.23 0 0.95 -Foreign 652 0.23 0.28 0 0.99 -Gross Output
Domestic Non-SOE 1,328 4.42 8.45 0.00 102.94 Billion CNY Provincial SOE 620 5.54 15.13 0.01 168.62 Billion CNY Central SOE 439 8.98 21.20 0 174.04 Billion CNY City SOE 805 1.65 4.29 0 49.46 Billion CNY County SOE 800 0.82 2.22 0.00 28.09 Billion CNY Foreign 672 4.06 10.99 0 137.20 Billion CNY
4.2.2
City and Category
Different from the analysis in the previous part, I merge ownership types into four categories: Central and Provincial SOE, City or below SOE, Domestic non-SOE, and Foreign. They are shown in Table A.1.
4.3
Mayors’ Characteristics
In this section, I describe the dataset including information of leadership’s characteristics. The data is mainly scraped from online sources. I have two different datasets by scraping from different sources 7. These characteristics are described as dummy variables and therefore,
the mean value represents the percentage of mayors with the particular characteristic.
4.3.1
Mayors’ Characteristics - Source 1
In the first data source, 19 characteristics of mayors are extracted 8. The distribution of
observed distinct mayors is presented in Figure B-3 and Figure B-4. The descriptive statistics can be found in Table 4.4. Identified by city and year, 2,080 observations are observed.
4.3.2
Mayors’ Characteristics - Source 2
In this data source, 10 characteristics are extracted 9. The distribution of observed distinct
mayors is presented in Figure B-5 and Figure B-6. The descriptive statistics can be found in Table 4.5. Identified by city and year, around 1,500 observations are observed.
7Two online sources arewww.baidu.com andwww.weibo.com, collected by Professor Jing Cao at Tsinghua University and Professor Shanjun Li at Cornell University.
8This is from Professor Jing Cao at Tsinghua University. 9This is from Professor Shanjun Li at Cornell University.