HAL Id: hal-00317335
https://hal.archives-ouvertes.fr/hal-00317335
Submitted on 8 Apr 2004
HAL is a multi-disciplinary open access
archive for the deposit and dissemination of
sci-entific research documents, whether they are
pub-lished or not. The documents may come from
teaching and research institutions in France or
abroad, or from public or private research centers.
L’archive ouverte pluridisciplinaire HAL, est
destinée au dépôt et à la diffusion de documents
scientifiques de niveau recherche, publiés ou non,
émanant des établissements d’enseignement et de
recherche français ou étrangers, des laboratoires
publics ou privés.
Pre-earthquake ionospheric anomalies registered by
continuous GPS TEC measurements
J. Y. Liu, Y. J. Chuo, S. J. Shan, Y. B. Tsai, Y. I. Chen, S. A. Pulinets, S. B.
Yu
To cite this version:
J. Y. Liu, Y. J. Chuo, S. J. Shan, Y. B. Tsai, Y. I. Chen, et al.. Pre-earthquake ionospheric
anoma-lies registered by continuous GPS TEC measurements. Annales Geophysicae, European Geosciences
Union, 2004, 22 (5), pp.1585-1593. �hal-00317335�
© European Geosciences Union 2004
Geophysicae
Pre-earthquake ionospheric anomalies registered by continuous
GPS TEC measurements
J. Y. Liu1,2, Y. J. Chuo3, S. J. Shan1, Y. B. Tsai4, Y. I. Chen5, S. A. Pulinets6, and S. B. Yu7
1Institute of Space Science, National Central University, Taiwan
2Center for Space and Remote Sensing Research, National Central University, Taiwan 3Department of Information Management, Ling-Tung College, Taiwan
4Institute of Geophysics, National Central University, Taiwan 5Institute of Statistics, National Central University, Taiwan
6Institute of Geophysics, National Autonomous University of Mexico, Mexico 7Institute of Earth Sciences, Academia Sinica, Taiwan
Received: 31 July 2003 – Revised: 10 November 2003 – Accepted: 22 November 2003 – Published: 8 April 2004
Abstract. In this paper we examine pre-earthquake
iono-spheric anomalies by the total electron content (TEC) de-rived from a ground-based receiver of the Global Posi-tioning System (GPS). A 15-day running median of the TEC and the associated inter-quartile range (IQR) are uti-lized as a reference for identifying abnormal signals dur-ing all of the 20 M>=6.0 earthquakes in the Taiwan area
from September 1999 to December 2002. Results show that the pre-earthquake ionospheric anomalies appear dur-ing 18:00–22:00 LT (LT=UT+8 h) within 5 days prior to 16 of the 20 M>=6.0 earthquakes. This success rate of 80%
(=16/20%) suggests that the GPS TEC is useful to register pre-earthquake ionospheric anomalies appearing before large earthquakes.
Key words. Ionosphere (ionospheric disturbances; ionosphere-atmosphere interactions)
1 Introduction
Many electromagnetic phenomena possibly associated with seismic activities have been extensively discussed in the liter-ature (e.g. Hayakawa and Fujinawa, 1994; Hayakawa, 1999; Hayakawa, 2000; Hayakawa and Molchanov, 2002). Sci-entists observed anomalies appearing in electron densities of the ionospheric F region a few days before some strong earthquakes (Pulinets et al., 1994; Pulinets, 1998; Liu et al., 2000). Liu et al. (2000) examined the ionospheric plasma fre-quency (or electron density) recorded by a local ionosonde and found that the critical frequency of the F2-peak, foF2, significantly decreased a few days prior to most of the M>=6.0
earthquakes in the Taiwan area between 1994–1999. Correspondence to: J. Y. Liu
(jyliu@jupiter.ss.ncu.edu.tw)
Ionosondes have been the most popular instrument prob-ing the ionospheric electron density for more than seven decades (Hunscucker, 1991). Currently, there are more than 200 ionosondes available worldwide. However, only a frac-tion of them are routinely operafrac-tional. Therefore, the spa-tial and temporal coverage of the ionosonde observations are rather limited and difficult to use to correlate with seismic activities systematically. Meanwhile, due to the use of me-dian and high frequencies (MF and HF), 1–20 MHz, ionoson-des often suffer from the short wave fadeout and result in data gaps (Davies, 1990). By contrast, today there are thou-sands of ground-based receivers of the global positioning system (GPS) deployed to monitor the Earth’s surface de-formation rates (see the papers listed in Calais and Amarjar-gal, 2000). Owing to the use of two ultra high frequency (UHF, f1=1575.42 MHz and f2=1227.60 MHz) waves, the GPS studies are generally free from the short wave fadeout. Therefore, while performing Earth’s surface deformation ob-servations, the same network of GPS receivers can also be used to simultaneously and continuously monitor the iono-spheric total electron content (TEC) (for example, see Leick, 1995; Sardon et al., 1994; Liu et al; 1996).
Recently, scientists have found an apparent reduction in GPS TEC a few days prior to some strong earthquakes (se-lected, e.g. Calais and Minster, 1995; Liu et al. 2001; Liu et al., 2002). However, these articles reported only a lim-ited 1–3 cases. In this paper, we adopt the procedure of Liu et al. (2001) to derive the GPS TEC and then employ the statistical analysis of Liu et al. (2000) to identify pos-sible pre-earthquake ionospheric anomalies 15 days before and after each of the 20 M>
=6.0 earthquakes in the Taiwan
area from September 1999 to December 2002. The features and lead times of the identified pre-earthquake ionospheric TEC anomalies are examined and discussed.
1586 J. Y. Liu et al.: Pre-earthquake ionospheric anomalies
118
119
120
121
122
123
124
22
23
24
25
Chung−Li°
M7.3°
M6.4°
M6.9°
M6.9°
M6.4°
M6.0°
M6.7°
M6.1°
M6.2°
M6.2°
M6.3°
M6.2°
M6.2°
M6.7°
M6.2°
M6.8°
M6.2°
M6.2°
M6.0°
M6.0°
M6.8♦
YMSMLongitude(
°
E)
Latitude(
°
N)
Fig. 1. The locations of the ionosonde, the GPS receiver and the 20 M>=6.0 earthquakes in the Taiwan area during September 1999 and
December 2002. The square and diamond symbols denote the Chung-Li ionosonde and YMSM GPS receiver, respectively.
Table 1. Catalog of the earthquakes in the Taiwan area used in this study.
EQK YY MM DD Hr Min Lat. Long. Depth Mag. P-day (LT)
1 1999 09 21 01 17 23.87 120.75 1.7 7.3 −1,−3,−4 2 1999 10 22 10 19 23.51 120.4 12.1 6.4 −1 3 1999 11 02 01 53 23.43 121.63 30.4 6.9 −2 4 2000 02 25 14 13 24.83 124.00 112 6.0 −2 5 2000 06 11 02 23 23.9 121.10 10.2 6.7 −3 6 2000 07 16 11 21 20.16 122.29 10.0 7.0 −2,−5 7 2000 07 29 04 28 23.4 120.94 4.0 6.1 −2 8 2000 09 10 16 54 24.05 121.62 20.0 6.2 −1,−2 9 2000 12 26 11 20 21.18 122.22 164.2 6.2 −1,−2 10 2001 06 13 21 17 24.42 122.43 54.2 6.3 X 11 2001 06 14 10 35 24.45 121.93 10.4 6.2 X 12 2001 11 24 13 46 25.34 122.20 280.4 6.2 −5 13 2001 12 18 12 02 23.89 123.04 32.2 6.7 −2 14 2002 02 12 11 27 23.77 121.66 25.1 6.2 X 15 2002 03 31 14 52 24.24 122.17 9.6 6.8 −3,−5 16 2002 05 15 11 46 24.68 121.90 5.0 6.2 −3,−4 17 2002 05 29 00 45 24.05 122.18 5.7 6.2 −3,−5 18 2002 08 29 01 05 22.2 121.35 13.2 6.0 −2 19 2002 09 01 15 07 23.85 122.62 35.5 6.0 X 20 2002 09 16 08 03 25.06 122.38 173.6 6.8 −3
1 2 3 4 5 6 7 8 9 10 0 10 20 30 40 50 (a) P P ↑M5.3 NmF2u September 1999 11 12 13 14 15 16 17 18 19 20 0 10 20 30 40 50 NmF2u P P P P 21 22 23 24 25 26 27 28 29 30 0 10 20 30 40 50 NmF2u ↑M7.3 ↑M6.8 Day 1 2 3 4 5 6 7 8 9 10 0 50 100 (b) P P ↑M5.3 TECu September 1999 11 12 13 14 15 16 17 18 19 20 0 50 100 P P TECu P P ↑M7.3 21 22 23 24 25 26 27 28 29 30 0 50 100 TECu ↑M6.8 Day
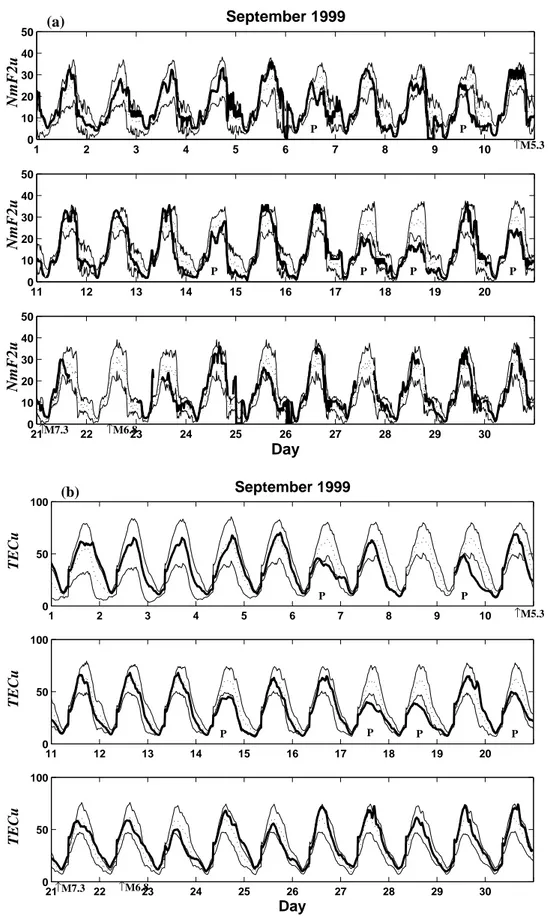
Fig. 2. The variations of NmF2 and V T EC observed in September 1999. (a) NmF2 and (b) V T EC. The bold, dashed, solid curves and the P
character denote the observed NmF2 or V T EC, associated 15-day medians, upper/lower bounds and detected seismo-ionospheric anomalies, respectively. 1 NmF2u = 1012el/m3and 1 TECu = 1016el/m2.
1588 J. Y. Liu et al.: Pre-earthquake ionospheric anomalies 0000 0600 1200 1800 2400 −25 −20 −15 −10 −5 0
TECu
LT(hr)
September 6, 1999
NmF2u
0000 0600 1200 1800 2400 −25 −20 −15 −10 −5 0TECu
LT(hr)
September 9, 1999
NmF2u
0000 0600 1200 1800 2400 −25 −20 −15 −10 −5 0TECu
LT(hr)
September 17, 1999
NmF2u
0000 0600 1200 1800 2400 −25 −20 −15 −10 −5 0TECu
LT(hr)
September 18, 1999
NmF2u
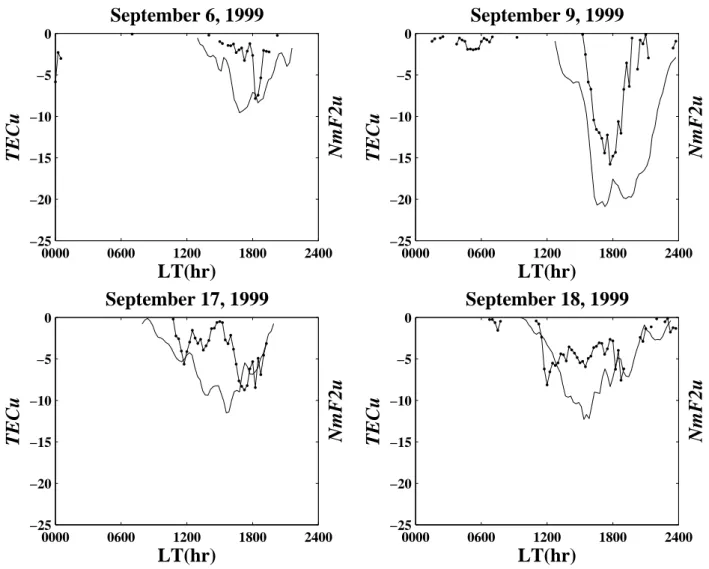
Fig. 3. The strength of four pre-earthquake ionospheric anomalies in NmF2 (dotted lines) and V T EC (solid lines) appear on 6, 9, 17 and 18
September 1999. The strength is defined as the departure of the observed quantities from the associated medians.
2 Observation and methodology
Owing to being a dispersive medium of the ionosphere, sci-entists can derive the TEC from the signals recorded by ground-based GPS receivers every 30 s (for example see Sar-don et al., 1994; Leick, 1995; Liu et al,; 1996). The slant total electron content, ST EC, along ray path l between a GPS satellite, T x, and a ground-based receiver, Rx, can be written as: ST EC = Z T x Rx N dl = f 2 40.3 Z T x Rx (n−1−1)dl = f 2 40.3 Z T x Rx s (1 −f 2 N f2) −1 −1 dl, (1)
where N is the electron density in el/m3, n denotes the refractive index, and f and fN represent radio wave and
plasma frequency in Hz, respectively. The l-axis stands for the receiver-to-satellite direction. From recorded broadcast
ephemeris (GPS satellite parameters) and given local sub-ionospheric heights, the ST EC can be converted into the vertical total electron content V T EC at its associated lon-gitude and latitude (Tsai and Liu, 1999). Both ST EC and
V T ECare in TECu (1 TECu=1016el/m2).
Taiwan is located in the seismic zones around the rim of the Pacific Ocean and, therefore, earthquakes frequently oc-cur. For instance, the recurrence interval of an M>=5.0
earth-quake between 1991–1999 is about 13–15 days. To iden-tify abnormal signals, we compute in this paper the median
˜
Xof the previous 15-day V T ECs (or foF2) and the associ-ated inter-quartile range I QR, to construct the upper bound
˜
X+I QRand lower bound ˜X−I QRat a certain local time (LT). Under the assumption of a normal distribution with mean µ and standard deviation σ for the V T EC (or foF2), the expected value of ˜X and IQR are µ and 1.34σ , respec-tively (Klotz and Johnson, 1983). If an observed V T EC (or foF2) falls out of either the associated lower or upper bound, we declare with a confidence level of about 80–85% that a lower or upper abnormal signal is detected.
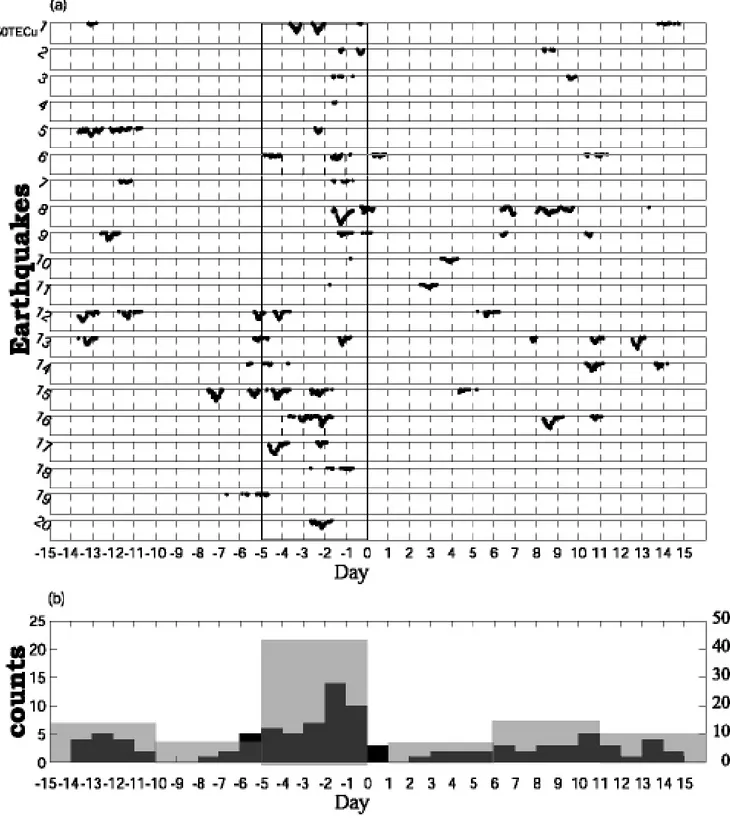
Fig. 4. The lower anomalies that occurred within 15 days before and after the 20 M>=6.0 earthquakes. (a) The observed V T EC exceed the associated lower bound. (b) The counts of lower anomalies appear more than 2 h during 12:00–22:00 LT for each day (dark histogram, left vertical axis) and every 5-day (gray histogram, right vertical axis). The day is in LT.
1590 J. Y. Liu et al.: Pre-earthquake ionospheric anomalies
3 Data analysis and interpretation
Figure 1 illustrates the locations of a local ionosonde at Chung-Li (25◦N, 120◦E), a GPS receiver at Yang-Ming San Mountain (YMSM, 25.3◦N, 120◦E) and the epicenters of all the 20 M>=6.0 earthquakes that occurred in the Taiwan
area during September 1999 and December 2002. Table 1 gives a catalog of the earthquakes, which summarizes the origin time, epicenter, magnitude and the anomaly day(s) before each earthquake. The M7.3 Chi-Chi earthquake was the strongest one among the 20 earthquakes. To validate the applicability of the GPS TEC, we compare first the tempo-ral variations between the co-located V T EC (right above the Chung-Li ionosonde station) from the YMSM GPS re-ceiver and the F2-peak electron density NmF2=(foF2)2/80.3 (for details, see Davies, 1990) from the Chung-Li ionosonde during the month of the Chi-Chi earthquake (see Figs. 2a and b). The bold lines in the figures denote the observed NmF2 and V T EC, the dashed lines show the associated 15-day me-dians, and the solid lines represent the upper/lower bounds, respectively. Finally, the P characters highlight the day when the pre-earthquake ionospheric anomalies are detected. Al-though local time (LT) and universal time (UT=LT-8 h) are, respectively, used by the ionosonde and the GPS, for sim-plicity, the LT coordinate is adopted in this study. It is found that both the NmF2 and V T EC plots simultaneously reveal strong anomalies on 6, 9, 14, 17 and 18 September, as well as one weak anomaly on 20 September 1999. Those ap-pearing on 17, 18 and 20 September are the pre-earthquake anomalies of the Chi-Chi earthquake. The anomalies on 6 and 9 September are considered to be related to an M5.3 earthquake which occurred on 10 September. Two geomag-netic storm sudden commencements (SSC) occurred on 12 and 22 September 1999. The anomaly that appeared on 14 September was probably a fluctuation perturbed by the geo-magnetic storm on 12 September, since a few hours to two days after a SSC, the ionospheric electron density might sig-nificantly decrease (Davies, 1990; Kelley, 1989). Figure 3 shows the strength of the NmF2 and V T EC anomalies on 6, 9, 17 and 18 September for the M5.3 and the Chi-Chi earth-quakes, respectively. It can be seen that the two quantities have consistent tendencies, which significantly decrease be-tween 12:00 and 22:00 LT. Such consistent tendencies sug-gest that the TEC data can be employed to search for possible anomalies before M>=6.0 earthquakes. Figure 4a displays the
variations of lower anomalies detected 15 days before and af-ter all the 20 M>=6.0 earthquakes during September 1999 and
December 2002. To avoid detecting other short lifetime per-turbations caused by some other geophysics, such as thunder-storm, traveling ionospheric disturbances, ionospheric bub-bles, etc. (Davies, 1990), we consider an anomalous day when observed V T ECs continuously exceed the associated lower bounds for at least 2 h during 00:00–24:00 LT. There are 106 lower anomalous days detected by this criterion dur-ing the entire studied period of 620 (=20*(15+1+15)) days. This shows that the chance of observing an anomaly dur-ing the entire investigated period is about 25% (=158/620%).
0000
0600
1200
1800
2400
50
25
0
25
50
strength(TECu)
LT(hr)
(a)
0000
0
0600
1200
1800
2400
5
10
15
20
25
30
LT(hr)
per
centage(
%)
(b)
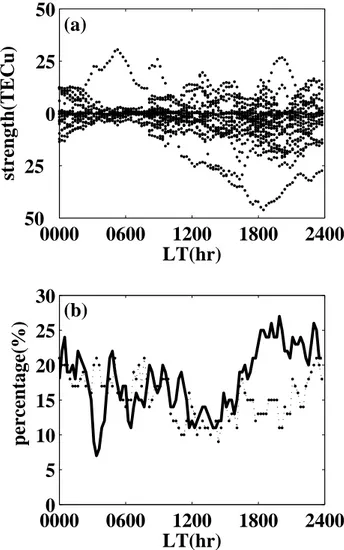
Fig. 6. The strengths and cumulative percentages of the V T EC
anomalies appear 1–5 days before the 20 M>=6.0 earthquakes. (a) The upper and lower anomalies strengths. (b) The occurrence per-centages of the upper (dotted line) and lower (solid line) anomalies.
Although many 5.0<=M<6.0 earthquakes and geomagnetic
storms (denoted by M5 s and SSC in Fig. 4a, respectively) occurred during the study period, Fig. 4b shows that the oc-currences of the lower anomalous days yield greater counts (8, 6 and 7, respectively) on 1, 2 and 5 days before M>=6.0
earthquakes. It can be seen that the occurrence of the lower anomalous 1–5 days prior to the earthquakes is 44% (=44/(5×20)%), which is greater than those of any other 5-day periods (on average about 23%) or the entire study period of 25%. To have a better understanding of the relationship between the seismo-ionospheric anomalies and the M>=6.0
earthquakes, we remove the anomalies 1–5 days before the M5.0 s earthquakes and 1–2 days after the SSCs (Davies, 1990; Kelley, 1989). Figure 5a, similar to Fig. 4a, illustrates the appearances of the lower anomalous 15 days before and after the M>=6.0 earthquakes, after those anomalies related to
the M5.0 s earthquakes and the geomagnetic storms are re-moved. Figure 5b demonstrates that the percentage of the
1592 J. Y. Liu et al.: Pre-earthquake ionospheric anomalies lower anomalies 1–5 days before the M>=6.0 earthquakes is
44%,which is 4 times greater than that of about 11% on av-erage of any other 5-day periods.
To further understand the pre-earthquake ionospheric TEC anomalies, the strengths and occurrences of the upper and lower anomalies in the V T EC 1–5 days before all the 20 M>=6.0 earthquakes are plotted and counted.
Fig-ure 6a illustrates that strengths of the anomalies, which is the observed V T ECs deviation from the associated medi-ans, enhance during 14:00–22:00 LT, while Fig. 6b shows that cumulative counts of the lower anomalous are clearly greater than those of the associated upper anomalous dur-ing 18:00–22:00 LT 1–5 days before the M>=6.0
earth-quakes. These suggest the significant lower anomaly appear-ing 18:00–22:00 LT within 1–5 days before the earthquakes to be the pre-earthquake ionospheric anomalies. Table 1 lists the pre-earthquake ionospheric anomalies that occurred be-fore the 20 M>=6.0 earthquakes.
4 Discussion and conclusion
It has been shown that both the current V T EC observa-tions and the previous ionosonde foF2 observaobserva-tions of Liu et al. (2000) can simultaneously register the pre-earthquake ionospheric anomalies during the month of the Chi-Chi earthquake occurrence (Figs. 2 and 3). Liu et al. (2001) calculated the correlation coefficient between the co-located NmF2 and V T EC 0–7 days prior to the Chi-Chi earthquake to be 0.953. These agreements suggest that the GPS TEC can be employed to monitor the pre-earthquake ionospheric anomalies. The stack processes for identifying occurrences of the anomalies, as shown in Figs. 4 and 5, demonstrate that the lead time of the V T EC anomalies of the M>=6.0
earthquakes in the Taiwan area is typically 1–5 days. Ta-ble 1 shows that the occurrence rates of earthquakes after the
V T EC anomalies within 5 days are 80% (=16/20) which generally agree with the 93% reported by Liu et al. (2000).
To further understand the features of the pre-earthquake ionospheric anomalies of V T EC, we examine the diurnal distributions of strengths and counts of the upper and lower anomalous within 1–5 days of the M>=6.0 earthquakes.
Fig-ures 6a and b illustrate that the significant strengths and counts of the lower anomalies appear during 18:00–22:00 LT, which is somewhat later than that of 12:00–18:00 LT, as re-ported previously by Liu et al. (2000). The discrepancies in the diurnal features of the two anomalies may result from the fact that the V T EC and foF2 (or NmF2) are two differ-ent physical quantities. It is noted that the NmF2 is the elec-tron density at the F2-peak, about 300–500 km altitude, while the V T EC is the integration from the ground-based receiver to the GPS satellite orbit at about 20 200 km altitude (also see Eq. 1). Although the NmF2 yields the heaviest weight in computing the V T EC, the part above the F2-peak, rang-ing from 300 (or 500) km to 20 200 km, still has more than 70% contribution for the V T EC. This means that the ioniza-tions in the higher altitudes, i.e. the upper ionosphere and the
lower magnetosphere, have to be taken into consideration. Many coupling mechanisms between the lithosphere, atmo-sphere, and ionoatmo-sphere, the dirty plasma diffusion, the at-mospheric gravity waves, and the vertical electric fields gen-erated during the earthquake preparation periods have been proposed to explain the seismo-ionospheric anomalies (see papers listed in Hayakawa and Fujinawa, 1994; Hayakawa, 1999; Pilipenko et al., 2001; Tanaka et al., 1999; Pulinets et al., 2000; Hayakawa and Molchanov, 2002; Pulinets et al., 2002). Although, the mechanisms are not fully understood, it is reasonable to assume that the anomalies appear first near the Earth’s surface and then extend to higher altitudes. Since a large amount of contribution comes from higher altitudes, the appearance of the diurnal V T EC features may be some-what later than that of the NmF2 (or foF2).
In conclusion, the pre-earthquake ionospheric anomalies observed in the Taiwan area show that ionospheric TEC re-markably decreased during 18:00–22:00 LT within 1–5 days before the earthquakes. Today, thousands of ground-based GPS receivers are available worldwide. This study provides a new approach and opportunity without any extra cost to search for and validate the existence of possible seismo-ionospheric anomalies all over the world.
Acknowledgements. The GPS data and the earthquake catalog are obtained from the Ministry of Interior and the Central Weather Bu-reau of Taiwan, respectively. This research was supported by the Ministry of Education under Grant 91-N-FA07-7-4 for the iSTEP project of the National Central University.
Topical Editor M. Lester thanks D. Ouzounor and S. Uyeda for their help in evaluating this paper.
References
Calais, E. and Minster, J. B.: GPS detection of ionospheric TEC perturbations following the January 17, 1994, Northridge earth-quake, Geophys. Res. Lett., 22, 1045–1048, 1995.
Calais, E. and Amarjargal, S.: New constraints on current deforma-tion in Asia from continuous GPS measurements at Ulan Baatar, Mongolia, Geophys. Res. Lett., 27, 1527–1530, 2000.
Davies, K.: Ionospheric Radio, Peter Peregrinus Ltd, London, 1990. Hayakawa, M. and Fujinawa, Y.: Electromagnetic Phenomena Re-later to Earthquake Predication, Terra Sci. Pub. Co., Tokyo, 1994. Hayakawa, M.: Atmospheric and Ionospheric Electromagnetic
Phe-nomena with Earthquakes, Terra Sci. Pub. Co., Tokyo, 1999. Hayakawa, M.: Seismo Electromagnetics, Monograph of
Interna-tional Workshop on Seismo Electromagnetics, Tokyo, 2000. Hayakawa, M. and Molchanov, O. A.: Seismo
Electromagnet-ics, Lithospheric- Atmospheric- Ionospheric coupling, Terra Sci. Pub. Co., Tokyo, 2002.
Hunscucker, R. D.: Radio Techniques for Probing the Ionosphere, Springer-Verlag Berkin Heidelberg New York, 1991.
Kelly, M. C.: The Earth’s Ionosphere, Academic Press, 1989. Klotz, S. and N. L. Johnson, (Eds.): Encyclopedia of Statistical
Sciences, John Wiley and Sons, 1983.
Leick, A.: GPS satellite surveying, John Wiley, New York, 560 pp, 1995.
Liu, J. Y., Tsai, H. F., and Jung, T. K.: Total electron content obtained by using the global positioning system, Terr. Atmos. Oceanic Sci., 7, 107–117, 1996.
Liu, J. Y., Chen, Y. I., Pulinets, S. A., Tsai, Y. B., and Chuo, Y. J.: Seismo-ionospheric signatures prior to M>=6.0 Taiwan earth-quakes, Geophys. Res. Lett., 27, 3113–3116, 2000.
Liu, J. Y., Chen, Y. I., Chuo, Y. J., and Tsai, H. F.: Variations of ionospheric total electron content during the Chi-Chi earthquake, Geophys. Res. Lett., 28, 1383–1386, 2001.
Liu, J. Y., Chuo, Y. J., Pulinets, S. A., Tsai, H. F., and Zeng, X. P.: A study on the TEC perturbations prior to the Rei-Li, Chi-Chi and Chia-Yi earthquakes, Seismo Electromagnetics: Lithosphere-Atmosphere-Ionosphere Coupling, edited by Hayakawa, M. and Molchanov, O. A., TERRAPUB, Tokyo, 297–301, 2002. Pilipenko, V., Shamilov, S., Uyeda, S., and Tanaka, H.: Possible
mechanism of the over-horizon reception of FM radio waves dur-ing earthquake preparation period, Proc. Japan Academy, 77, Ser. B, 125–130, 2001.
Pulinets, S. A., Legen’ka, A. D., and Alekeseev, V. A.: Pre-earthquake ionospheric effects and their possible mechanisms, in Dusty and Dirty Plasmas, Noise and Chaos in Spac and in Laboratory, Plenum Publishing, New York, 545–557, 1994.
Pulinets, S. A.: Seismic activity as a source of the ionospheric vari-ability, Adv. Space Res., 22, 6, 903–906, 1998.
Pulinets, S. A., Boyarchuk, K. A., Hegai, V. V., Kim, V. P., and Lomonosov, A. M.: Quasielectrostatic Model of Atmosphere-Thermosphere-Ionosphere Coupling, Adv. Space Res., 26, 8, 1209–1218, 2000.
Pulinets, S. A., Boyarchuk, K. A., Hegai, V. V., and Kare-lin, A. V.: Conception and model of seismo-ionosphere-magnetosphere coupling, in Seismo- Electromagnetics: Lithosphere-Atmosphere-Ionosphere Coupling, edited by Hayakawa, M. and Molchanov, O. A., TERRAPUB, Tokyo, pp. 353–361, 2002.
Sardon, E., Rius, A., and Zarraoa, N.: Estimation of the transmitter and receiver differential biases and the ionospheric total electron content from global positioning system observations, Radio Sci., 29, 577–586, 1994.
Tanaka, H., Kamogawa, M., and Ohtsuki, Y.: The interation be-tween bulk plasmas and electromagnetic waves assisted by sur-face roughness, Proc. Japan Academy, 75, Ser. B, 190–194, 1999.
Tsai, H. F., and Liu, J. Y.: Ionospheric total electron content re-sponse to solar eclipses, J. Geophys. Res., 104, 12 657–12 668, 1999.


