Effect of a Sinusoidal Three-Lobe Total Pressure Distortion on a Transonic Compressor: Distortion Propagation, Compressor Performance, and Blade Passage Events
by
Brenda Brennan MacLeod B. S., Mechanical Engineering (1995)
University of Florida
Submitted to the Department of Aeronautics and Astronautics in partial fulfillment of the requirements for the degree of
Master of Science in Aeronautics and Astronautics at the
Massachusetts Institute of Technology
February 2003
MASSACHUSETTS INSTITUTE OFTECHNOLOGY
EP
1 0
2003
LIBRARIES
© 2002 Massachusetts Institute of Technology All rights reserved.
Signature of Author . . ...
Department of Aeronautics and Astronautics
/
October 31, 2002Certified by ... . . .. . . .. ...
Choon S. Tan
Senior Research Engineer Thesis Supervisor C ertified by ... . sC ... ...
Eugene E. Covert T. Wilson Professor Emeritus Thesis Supervisor
'Al
Accepted by ... ...
Edward M. Greitzer H. N. Slater Professor Chair, Department Committee on Graduate Students
EFFECT OF A SINUSOIDAL THREE-LOBE TOTAL PRESSURE DISTORTION ON A TRANSONIC COMPRESSOR: Distortion Propagation, Compressor Performance, and Blade Passage Events
by
BRENDA BRENNAN MACLEOD
Submitted to the Department of Aeronautics and Astronautics
on October 31, 2002, in partial fulfillment of the requirements for the degree of Master of Science in Aeronautics and Astronautics.
ABSTRACT
This thesis presents data and analysis on compressor performance, distortion propagation, and unsteady blade aerodynamics and structural response when the ADLARF (Augmented Damping of Low Aspect Ratio Fan) compressor is subjected to a sinusoidal, three-lobe (3/Rev) total pressure distortion. The experimental data came from ADLARF tests carried out at engine speeds just above and below the 3/Rev crossing with the first rotor blades' first flex (1F) resonance frequency. The data include pressure and temperature rake data at various axial locations in the flow path of the compressor, static pressure data along the casing and hub walls, laser doppler velocimetry (LDV) data in the blade passages of the first rotor, and differential pressure and strain gauge data at selected locations on selected first rotor blades. As a complementary effort to the distortion propagation analysis, a three-dimensional, unsteady model of the NASA Stage 35 transonic compressor stage was subjected to a sinusoidal 3/rev total pressure distortion. In the analysis of blade aerodynamics and structural response, three-dimensional Navier-Stokes calculations of the ADLARF first rotor subjected to a 3/rev distortion were compared with the LDV data. Three main observations can be made regarding the propagation of the distortion through the compressor: (1) amplification of the total pressure distortion across each rotor, (2) existence of static pressure non-uniformities at the rotor exits with amplitudes of the order of the upstream dynamic pressure, and (3) low pass filter behavior of the compressor stages. Regarding the impact of the distortion on compressor performance, two main observations can be made: (1) an improvement in stall margin and (2) minimal change in performance despite a shift in the operability range. Regarding distortion induced unsteady blade aerodynamics and structural response, three main observations can be made: (1) evidence of excitation of a 16-blade resonance mode in the first rotor and (2) the need for more extensive blade measurements for accurate force and response analysis.
Thesis Supervisors: Choon Tan, Senior Research Engineer
Eugene Covert, T. Wilson Professor Emeritus Department of Aeronautics and Astronautics
ACKNOWLEDGEMENTS
I am extremely fortunate and grateful for the friends and acquaintances that I have made during this research. It is truly the people involved who have made my experience rich and who have taught me more than just the technical.
For their guidance, support, and patience, I would like to thank my thesis advisors, Dr. Choon Tan and Professor Eugene Covert.
My coursework and thesis were sponsored by the Air Force Research Laboratory at Wright Patterson Air Force Base (AFRL-WPAFB) through the Battelle Memorial Institute with Ms. Pam Teets as the technical officer (Purchase Orders 166212 and
153616) and also through NASA grant #NAG3-2321 with George Stefko as the technical
monitor. I am indebted to Dr. Douglas Rabe, Mr. Carl Williams, Mr. John Stauffer, Dr. James Kenyon, Dr. Ronald Fost, and Mr. Brendhan Goss, all of AFRL-WPAFB, for providing me with advice, data, and background information. Likewise, I am indebted to Dr. Steve Manwaring of General Electric Aircraft Engines (GEAE) for providing experimental data and to Dr. Chunill Hah of the National Aeronautics and Space Administration Glenn Research Center (NASA-GRC) for providing his Navier-Stokes calculations. For providing his unsteady Euler code and technical assistance, I am grateful to Dr. Yifang Gong of the MIT Gas Turbine Laboratory. Also, I am grateful to Mr. Neil Murray for his technical assistance with flow visualization software.
For their technical comraderie during my tenure at the Gas Turbine Laboratory, I would like to thank Mr. Jun Luo, Mr. Borislav Sirakov, Mr. Emmanuel Blanvillain, Mr. Vincent Sidwell, and Mr. Vai Man Lei.
For always making administrative issues easier, I would like to thank Ms. Lori Martinez, Ms. Julie Finn, Ms. Holly Anderson, Ms. Mary McDavitt, and Ms. Susan Parker.
Last, but not least, I would like to thank...
... My family at the lab-Beilene, Dongwon, and Jun
... My husband, Bruce, for allowing me to uproot him and for being my inspiration.
TABLE OF CONTENTS
Nomenclature 9
1 Introduction 13
1.1 Background on the ADLARF Testing --- 13
1.2 Technical Objectives --- 16
1.3 Contributions 16 1.4 Thesis Organization --- 17
2 Technical Approach --- 19
2.1 The ADLARF Experimental Data 19 2.1.1 Test Method 21 2.1.2 Test Measurements 21 2.2 The NASA Stage 35 Model --- 23
2.3 The RANS Model of the ADLARF First Rotor 25 2.4 Summary --- 25
3 Distortion Propagation --- 27
3.1 Anatomy of a Screen-Generated Total Pressure Distortion --- 27
3.2 Distortion Propagation in the ADLARF Compressor --- 31
3.3 Distortion Propagation in the Stage 35 Model --- 35
3.4 Discussion --- 38
3.4.1 Low-Pass Corner Frequency --- 38
3.4.2 Distortion Amplification --- 40
3.5 Summary of Observations and Deductions --- 42
4 Compressor Performance --- 43
4.1 ADLARF Experimental Results 43 4.2 Results from the RANS Model of the ADLARF First Rotor 46 4.3 Discussion 46 4.4 Summary of Observations and Deductions --- 47
5 Blade Aerodynamics and Structural Response --- 49
5.1 Flow Characterization 49 5.2 ADLARF Blade Data 52 5.2.1 Kulite Data 52 5.2.2 Blade Force 52 5.2.3 Blade Strain (Response) --- 55
5.2.4 Blade-to-Blade Phase Comparisons --- 55
5.2.5 Force and Response Comparisons --- 56
5.3 Summary and Discussion --- 57
6 Summary and Conclusions --- 59
6.1 Summary__. 59 6.1.1 Distortion Propagation --- 59
6.1.2 Compressor Performance --- 60
6.1.3 Blade Aerodynamics and Structural Response --- 60
6.2 Experimental Issues --- 61
6.4 Future Work 62
Bibliograhpy ...- 65
Appendices ... 67
A Turbulence Length Scales for the Distortion Screen 69 A-1 Theory - 69 A-2 Empirical Equations - 71 A-3 Calculations 72 A-4 Conclusions 73 B Time-Scale Calculations for Rotating Distortion Screen --- 75
B-1 Time Scales 75 B-1. 1 Distortion Rotation 75 B-1.2 Downstream Convection 75 B-2 Conclusion______. 75 C Flow Field Data Sources 77 C-1 Measurement Locations 77 C-1.1 Flow Conditioning Barrel 77 C- 1.2 Bellmouth 77 C-1.3 Compressor Inlet 77 C- 1.4 Rotor 1 Leading Edge --- 78
C-1.5 Stator 1 78 C-1.6 Rotor 2 Tip --- 79
C-1.7 Stator 2 79 C-1.8 Compressor Exit 80 C-2 Other Measurements at Each Time Step --- 80
C-3 Calculations Provided at Each Time Step --- 80
D Parallel Compressor Theory for Compressible Flows --- 83
D-1 Assumptions --- 83
D-2 Theory --- 83
D-2.1 Distortion Amplification --- 83
D-2.2 Static Pressure Distortions 84
D-2.3 Compressor Performance 85
NOMENCLATURE
Acronyms and Abbreviations
"1 inches
1/rev One-lobe or first engine order
IF First Flex mode
2/rev Two-lobe or second engine order
2F-1T Second Flex mode and First Torsion mode
1-2S Two-Stripe mode
3/rev Three-lobe or third engine order 8/rev Eight-lobe or eighth engine order
12/rev Twelve-lobe or twelfth engine order
ADLARF Augmented Damping of Low Aspect Ratio Fans AFRL Air Force Research Laboratory
AIAA American Institute of Aeronautics and Astronautics ASME American Society of Mechanical Engineers
CRF Compressor Research Facility
CRFER Compressor Research Facility Experimental Rig
EO Engine Order
ft feet
GEAE General Electric Aircraft Engines GRC Glenn Research Center
GTL Gas Turbine Laboratory HCF High Cycle Fatigue
in inches
kHz one thousand cycles per second ksi one thousand pounds per square inch
lb pounds
LDV Laser Doppler Velocimetry
MIT Massachusetts Institute of Technology
NASA National Aeronautics and Space Administration NOL Nominal Operating Line
NS Near Stall
pdynO dynamic pressure at the bellmouth
PE Peak Efficiency
RANS Reynolds-averaged Navier-Stokes
rev revolution
rpm revolutions per minute
s seconds
WOD Wide Open Discharge
Symbols - Main Text
b slope of line between two operating points on a pressure ratio curve Cax chord length in the axial direction
c, specific heat at constant pressure
F blade force
fR reduced frequency
y specific heat ratio
M Mach number
Mr Relative Mach number
N mechanical rotation speed of the rotor
Nd number of distortion cycles per rotor revolution
p static pressure p, total pressure OF force phasing OR response phasing p density R gas constant r radius T static temperature T total temperature V velocity
Vax estimated average axial velocity at the inlet to the first rotor
W work
Symbols - Appendix A
C constant
d grid wire diameter
F constant
f
frequency G constant H constant I constant J constant K constantAx x-direction macro-scale turbulence component AX x-direction micro-scale turbulence component
A, y-direction macro-scale turbulence component Ay y-direction micro-scale turbulence component Az z-direction macro-scale turbulence component AZ z-direction micro-scale turbulence component
V fluid kinematic velocity
R(T) autocorrelation function
Rd Reynolds number
t time U 2 U Symbols - App ii Td U0
x-component turbulence intensity mean flow velocity (in the x-direction).
x-component of the mean square fluctuating velocities
endix B
distortion screen rotation frequency
distance between distortion screen and compressor inlet angular wavelength of distortion
time scale of flow convection from distortion screen to compressor inlet time scale of distortion rotation
average flow velocity at the bellmouth Symbols - Appendix C ETA ETAS] N NC2 PNC2 PR PRS1 PS10 PS15 PS23 PS230 PSR1L PSR2 PSS1 PSS1L PSS1T PSS2L PSS2T PT1O PT15 PT23 PTS1 PTS1L PTS2L SiPOS SCRNANG TR TRS1 TTOO overall efficiency Stage 1 efficiency
mechanical rotation speed of the rotor corrected rotor speed
percent corrected speed overall total pressure ratio Stage 1 total pressure ratio static pressure at the bellmouth static pressure at the compressor inlet
static pressure (axial array) on the casing and hub at the compressor exit static pressure (circumferential array) on the casing and hub at the compressor exit
static pressure on the casing at the Rotor 1 leading edge static pressure on the casing over Rotor 2
static pressure on the casing and hub along Stator 1
static pressure on the casing and hub at the Stator 1 leading edge static pressure on the casing and hub at the Stator 1 trailing edge static pressure on the casing and hub at the Stator 2 leading edge static pressure on the casing and hub at the Stator 2 trailing edge total pressure at the bellmouth
total pressure at the compressor inlet total pressure at the compressor exit
average total pressure at the Stator 1 leading edge total pressure at the Stator 1 leading edge
total pressure at the Stator 2 leading edge Stator 1 vane position
rotation angle of the distortion screen overall total temperature ratio
Stage 1 total temperature ratio
TTS1 average total temperature at the Stator 1 leading edge
TTSJL total temperature at the Stator 1 leading edge
TTS2L total temperature at the Stator 2 leading edge
WA V31C corrected mass flow rate Symbols - Appendix C
AH area of the high-speed segment
AL area of the low-speed segment
b slope of line drawn between the high- and low-speed performance points
C positive coefficient
A (non-normalized) vertical drop along total-to-static pressure rise curve
7rH pressure ratio for the high-speed segment
7
CL pressure ratio for the low-speed segment
P2H static pressure in high-speed segment at compressor or stage exit P2L static pressure in low-speed segment at compressor or stage exit PtJH total pressure in high-speed segment at compressor or stage inlet
PtJL total pressure in low-speed segment at compressor or stage inlet
Pt2H total pressure in high-speed segment at compressor or stage exit Pt2L total pressure in low-speed segment at compressor or stage exit
Chapter 1
INTRODUCTION
The blading in turbomachinery is subject to a wide variety of vibrations due to the combination of geometry configuration, high rotating speeds, and unsteady and non-uniform flow conditions. Blade vibrations, which can become amplified at resonance frequencies, are of critical concern to turbomachinery durability and safety since vibrations can cause high cycle fatigue (HCF) failures. While engineers have relatively good control over geometry and operational parameters, they have much less control over flow non-uniformities and the unsteadiness of the resulting flow in aircraft turbine engines.
In aircraft turbine engines, non-uniform flow conditions, which may or may not involve vortices, can result from many sources, including inlet distortions and wakes. Inlet distortions result from the ingestion of turbulence, jet exhaust, separation of the flow at the nacelle lip (due to angle of attack and slip angle), and flow separation inside the inlet duct. Wakes result from upstream obstructions, such as rotors, struts, and stators. Distortions in total temperature can be caused by re-ingestion of jet exhaust while distortions in total pressure can be caused by all of the items listed above. This thesis, however, limits its focus to total pressure distortions and their role in causing turbomachinery blades to vibrate.
1.1
Background on the ADLARF Testing
A series of experiments was carried out by the Air Force Research Laboratory (AFRL) at Wright Patterson Air Force Base (WPAFB) and General Electric Aircraft Engines (GEAE) in the 1990s in order to study the forced response of compressor blades subjected to total pressure distortions. The programs included steady and unsteady measurements of blade response in the ADLARF (Augmented Damping of Low Aspect Ratio Fan) compressor. The compressor was tested in the Compressor Research Facility Experimental Rig (CRFER), and a variety of distortions screens were used far upstream of the compressor to create different shaped total pressure distortions. The different distortion screens had both circumferential and combined circumferential/radial patterns. It is the circumferential distortion that subjects the blades to the cyclic flow conditions which drive the blade vibrations. Testing was done at or near the appropriate resonance frequencies in order to capture the conditions of concern to HCF. For practical reasons (i.e., survivability of the instrumentation), all data taken at resonance were obtained while
accelerating or decelerating through resonance. The data taken near resonance, however, were taken at constant mechanical rotation speeds.
Most of the testing was done using distortion screens with two-, three-, and eight-lobe circumferential patterns. In a rotor reference frame, this corresponds to 2/, 3/, and 8/rev flow distortions, respectively, which correspond to forcing frequencies of the 2nd 3rd, and
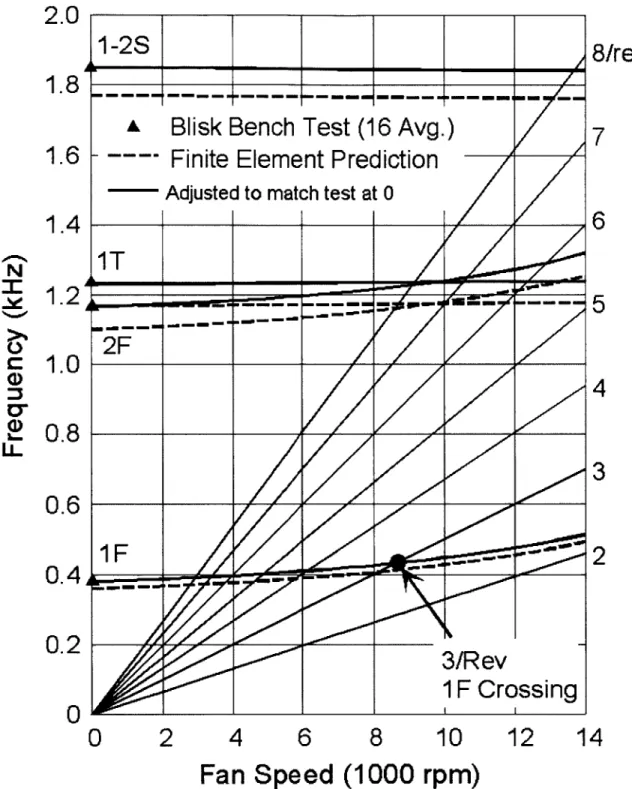
8th engine orders (EO), respectively. The Campbell diagram of the ADLARF compressor
first rotor is shown in Figure 1-1. It shows the frequency of the engine orders as a function of rotation speed as well as the resonance frequencies of the various blade vibration modes as a function of rotation speed.
One can see that the blades will be driven at a resonance frequency at rotation speeds where the forcing frequency EO crosses a resonance mode frequency. The resonance crossings studied with the 2/, 3/, and 8/rev distortion screens are the first flex (IF), the second flex - first torsion (2F-1T), and the first two-stripe (1-2S) modes.
In addition to other flow measurements, data were taken to delineate flow in the blade passage and to determine pressures and strains on the first rotor blades. Blade passage flow was measured using laser doppler velocimetry (LDV) at the 85% span and at the leading and trailing edge planes. Depending on the measurement configuration, gauge or differential pressure was measured using kulites mounted in through-holes along the 85% span. Blade strain was measured by strain gauges mounted at locations of resonance mode bending.
A number of studies were published based on the above measurements. The inlet distortion was defined using total pressure rakes at the compressor inlet [1]. The steady and unsteady blade passage flow fields were defined and blade passage events were identified using LDV data [2,3]. Unsteady gauge pressure measurements along the blade chord were decomposed and analyzed for frequency content and disturbance propagation speed [4]. Steady and unsteady models of blade passage flow were assessed and validated using rake, LDV, and kulite data [1,2,3,5]. Blade forces and moments were calculated from differential blade pressure measurements along the blade chord [6,7]. Through analyses of strain gauge measurements, the role of mistuning in the distribution of vibration amplitude among the blades was investigated, resulting in an initial assertion of aerodynamic coupling [8,9] and a later assertion of structural coupling [10]. In addition, reduced order models of coupled aeromechanics were used to investigate forced response [5,8,9].
2.0
1.8
1.6
1.4
2
4
6
8
Fan Speed (1000 rpm)
Figure 1-1. Blade resonance frequencies and engine order frequencies versus speed for the ADLARF first rotor. (Courtesy AFRL-WPAFB)
compressor
Although much analysis has been done on the ADLARF data sets, a quantitative link from inlet distortion to blade vibration has not yet been established. The weakest links in the understanding are the blade-to-blade variations and the coupling of blades to the flow field and to each other. Qualitatively, it is understood that a circumferential total pressure
1-2S
A
Blisk Bench Test (16 Avg.)
Finite Element Prediction
Adjusted to match test at 0
1T
2F77
1 F
3/Rev
1 F Crossing
N
z
Lm. LL1.2
1.0U
0.8
8/rev
7
6
5
4
3
2
14
0.6
0.4
0.2
0
0
10
12
amplify the blade vibrations if the oscillations are at one of the lower resonance frequencies. Quantitatively, the flow field for steady inlet flow is well defined for the ADLARF first rotor. However, understanding of the coupling that occurs between aerodynamics and blade motion during forced response relies on reduced order models
[5,8,9], which are difficult to validate using data from the ADLARF tests.
1.2
Technical Objectives
The current effort seeks to enhance both the qualitative and quantitative understanding of inlet distortion induced blade excitations. The original research questions that motivated this research effort were the following:
(1) How must one design and implement ground tests/experiments to reproduce key aspects of blade excitation seen in flight situations in which the engine encounters a distortion?
(2) How would one parameterize the aerodynamic loads on blades in terms of inlet distortion characteristics and compressor design characteristics?
(3) What sets the extent of the downstream influence of a distortion on blade excitations in a multi-stage compressor?
(4) What would constitute an adequate model (computational or reduced-order type) for addressing blade excitations under inlet distortion?
The first research question could not be addressed due to a lack of resources--data from flight tests is sparse. Turbulence length scales for the distortion screen were estimated (Appendix A), but no flight data were made available for comparison.
Research objectives were then reformulated in an effort to seek answers to the last three questions, which involve the following tasks:
1. Examine the downstream evolution of a distortion through a multi-stage compressor using data from ADLARF tests and a three-dimensional computational model for multi-stage compressors.
2. Determine the aerodynamic loads from selected inlet distortions. 3. Determine distortion-induced blade excitations.
1.3
Contributions
The following contributions result from this research:
1. Acquisition and analysis of data from AFRL-WPAFB and GEAE. System and blade level ADLARF data were analyzed in order to understand the impact of a 3/rev inlet
distortion on a transonic compressor. Examination of distortion propagation, compressor performance, and blade aeromechanics yielded the following key observations:
e Amplification of the total pressure distortion by the compressor rotors.
" Static pressure distortions at the rotor exits with amplitudes of the order of the upstream dynamic pressure.
* Low-pass filter behavior from the rotors.
" Improvement in compressor stall margin and marginal change in compressor pressure ratio and efficiency.
" Shift in compressor operability range.
" Strong circumstantial evidence of the excitation of a 16-blade resonance mode in the rotor.
2. Establishment of an appropriate pass corner frequency length scale for low-aspect-ratio compressor rotors.
3. Identification of experimental issues that are obstacles to force and response analysis of rotor blades.
1.4
Thesis Organization
This thesis focuses on experimental and computational results of 3/rev distorted flow through transonic compressors-mainly, the ADLARF compressor. Chapter 2 ("Technical Approach") explains how experimental data and computational results are used in the pursuit of the research objectives. Chapter 3 ("Distortion Propagation") focuses on Objective #1 in an effort to determine the conditions under which an inlet distortion might pose an HCF problem. Chapter 4 ("Compressor Performance") focuses on Objective #2 with respect to the inlet distortion's effect on compressor performance. Chapter 5 ("Blade Aerodynamics and Structural Response") focuses on Objectives #2 and #3 by attempting to determine distortion induced blade passage events and the resulting force and response scenario. Finally, Chapter 6 ("Conclusions") synthesizes the results from the analyses in Chapters 3-5 and presents conclusions on the results, the experimental issues, and future work.
Chapter 2
TECHNICAL APPROACH
This chapter describes the ADLARF experimental data and computational tools that are used in the current effort to investigate the effects of inlet distortions on transonic compressors. The ADLARF data are used extensively to investigate all three main thesis topics-distortion propagation, compressor performance, and blade aerodynamics and structural response. The computational tools that are used consist of a three-dimensional computational model for high-speed, multi-stage compressors developed by Gong [12] and an unsteady three-dimensional Navier-Stokes solver developed by Hah [3]. The former was used to subject NASA Stage 35 to a 3/rev distortion similar to the one seen in the ADLARF data. The latter was used to subject the ADLARF first rotor to a 3/rev inlet distortion. Results from the Stage 35 computation are used to complement the investigation of distortion propagation while results from the ADLARF rotor computation are used mainly to complement the investigation of blade passage aerodynamics.
2.1
The ADLARF Experimental Data
The ADLARF experimental data are the result of a collaboration between the GEAE Advanced Engineering Programs Department and the Wright Laboratory Aeropropulsion and Power Directorate. The particular test configuration of the ADLARF compressor that is of interest consists of two transonic stages without any inlet guide vanes. The corrected design speed of the compressor is 13,288 rpm, and the pressure ratio at design is 4.3. Table 2-1 lists the specifications on the first rotor, which has a diameter of 27.75 inches.
Table 2-1. Rotor 1 Parameters [11].
Number of Blades 16
Aspect Ratio at Root 1.1
Tip Solidity 1.5
Hub Solidity 2.67
Tip Thickness/Chord Ratio .028 Hub Thickness/Chord Ratio .087
Material Ti-6-4
LDV data came from a 62% design speed test. The 71% speed clean inlet tests were run on December 19, 1996, and the 71% speed 3/rev distortion tests were run on January 7, 1997. All testing took place at the WPAFB Compressor Research Facility (CRF, Figure 2-1). Tip speed and pressure ratio for the 71% design speed tests were approximately
1100 ft/s (335 m/s) and 2.3, respectively. Inlet Filters Inlet Valves Test Chamber Flow
Conditioning NOTE: Drawing is not to scale.
Bellmouth
Fan Flow Collector
Test
Compressor Throttle Mass Flow
Valves Venturis
Core FlowExas Collector
Drive Shaft
2.1.1 Test Method
For the 71% speed tests, a clean inlet and a 3/rev inlet distortion were tested at four different compressor operating points. The operating points were near stall (NS), peak efficiency (PE), nominal operating line (NOL), and wide-open discharge (WOD). The NS and PE points were determined during testing, while NOL was set by the compressor design and WOD was set by the facility. Flow rates for the operating points are listed in Table 2-2. Note that there is a small drop in corrected mass flow rate due to the drop in total pressure across the distortion screen.
Table 2-2. Corrected mass flow rate (lb/s) for clean and distorted inlets at the four operating points.
INLET CONDITION NS PE NOL WOD
Clean 98.5 101.9 103.5 104.1
Distorted 96.8 99.8 101.3 102.0
In the distorted flow tests, a 3/rev screen was placed perpendicular to the flow upstream of the compressor inlet (Figure 2-2). The screen (Figure 2-3) consists of eighteen 20-degree circumferential segments hinged together along the radial edges. The 3/rev distortion pattern is created by alternating 60-degree sections of coarse mesh and fine mesh. The fine mesh sections are further divided by the 20-degree segments, having a very fine segment flanked by less fine segments. The coarse mesh sections are also further divided by the 20-degree segments, having a very coarse segment flanked by less coarse segments. These subdivisions give the distortion its sinusoidal shape. In order to expedite testing and improve data resolution, the distortion screen was rotated at 2 degrees per second, resulting in a temporal as well as spatial disturbance. The screen rotation rate was slow enough, though, that the flow can be assumed to be quasi-steady.
(See time-scale calculations in Appendix B.)
2.1.2 Test Measurements
Flow field, differential pressure across the blade (Rotor 1 only), and strain at the blade root (Rotor 1 only) were measured during these particular ADLARF tests. Flow field was measured using pressure and temperature rakes at various axial locations in the flow path of the compressor, static pressure taps along the casing and hub walls, and LDV in the blade passages (Rotor 1 only). Differential pressure across the blade was measured using kulites mounted in through-holes along the 85% span of the blade. Blade strain was measured using strain gauges mounted at the blade root.
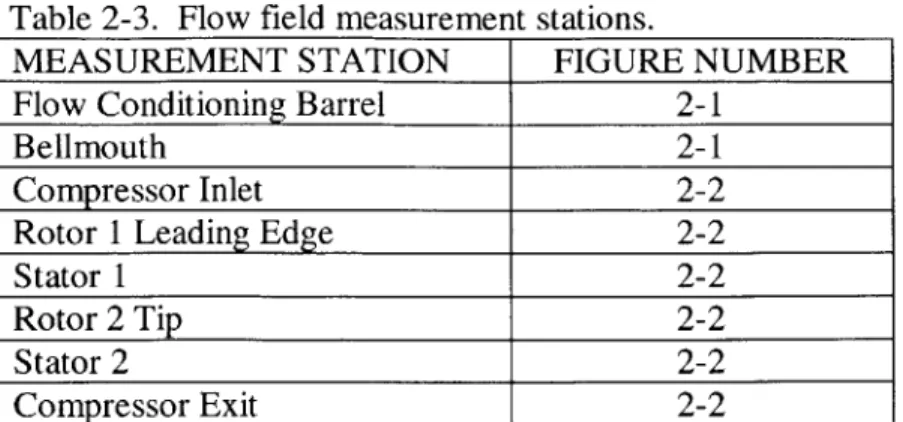
The flow field data obtained from total pressure and temperature rakes and from pressure taps are used to investigate distortion propagation and compressor performance. The measurement stations are listed in Table 2-3 along with the figure number that shows their general locations. The stations are listed in the order that the flow encounters them-upstream to downstream. Detailed information on the location and orientation of the rakes and taps is presented in Appendix C.
Compressor Exit ' Measurement Station
Figure 2-2. Cross-section of the experimental set-up (courtesy of AFRL-WPAFB).
Table 2-3. Flow field measurement stations.
MEASUREMENT STATION FIGURE NUMBER
Flow Conditioning Barrel 2-1
Bellmouth 2-1
Compressor Inlet 2-2
Rotor 1 Leading Edge 2-2
Stator 1 2-2
Rotor 2 Tip 2-2
Stator 2 2-2
Compressor Exit 2-2
The LDV measurements are used to investigate blade passage events. The data were taken across the 85% span and across the rotor inlet and exit for distorted flow at 62% design speed. The resolution of the measurement system provided 30 locations across the blade pitch, 21 in the axial direction, and 12 in the radial direction. A minimum of 50 samples were ensemble-averaged for each measurement location [2]. The distortion screen was held stationary at various screen positions in order to get the required samples for ensemble averaging.
Kulite measurements are used to investigate blade force and aerodynamic events along the blade chord. The kulites were mounted in through-holes along the 85% span as shown in Figure 2-4. They were mounted flush with the pressure surface on Blade 1 and flush with the suction surface on Blade 2. Since the holes were open to the other side, measurements yielded differential pressure, which should not reflect differences due to the orientation of the mounting. Note that Blade 2 is ahead of Blade 1 in the rotation. Strain gauge measurements are used to investigate the response of the blades to the inlet distortion. Strain gauges were mounted at the roots of the blades because that is where maximum bending for the 1F vibration mode occurs.
2.2
The NASA Stage
35
Model
The analysis tool used to complement the investigation of distortion propagation is a three-dimensional unsteady nonlinear Euler flow field model written and configured for the NASA Stage 35 compressor by Gong in 1999 [12]. The computational model was used to simulate rotating stall inception and development as well as inlet distortion propagation through low- and high-speed multi-stage compressors. The model provides a blade row by blade row body force representation of a multi-stage compressor, unsteady three-dimensional flow outside of the blade rows, and work input and flow turning through the body force, which depends on local flow conditions.
For the distortion propagation investigation, a sinusoidal 3/rev total pressure distortion was imposed on a single stage (rotor followed by a stator) transonic compressor model. Some design parameters for the Stage 35 rotor are shown in Table 2-4.
Figure 2-4. WPAFB).
Location and
Blade #2
orientation of the kulite transducers (courtesy of
AFRL-Table 2-4. Stage 35 Rotor Parameters [12].
Number of Blades 36
Aspect Ratio 1.19
Tip Solidity 1.29
Hub Solidity 1.77
Design Speed 17,200 rpm
Tip Speed at 72% design 1,080 ft/s Pressure Ratio at 72% design 1.3
As can be seen in the Table 2-4 and in the Section 2.1 introduction, the Stage 35 rotor is similar to the ADLARF first rotor in aspect ratio, tip solidity, and tip speed. The pressure ratio also is within 20% of the ADLARF Rotor 1 pressure ratio at 71% design speed (Figure 4-1). Thus, the Stage 35 model can arguably be used to complement the ADLARF experimental data to some extent, rather than having to extract the body force representation of the ADLARF compressor in order to model it. Such a task would be tedious and of limited benefit as the model is being used to identify and/or confirm physical trends in distortion amplification, static pressure non-uniformities, and induced swirl. 85% Span 40% Span Flow> Side View (2D Projection) Rotation Flow 'ressure Side 5% Chord 15% Chord 30% Chord 40% Chord 50% Chord 60% Chord 70% Chord 80% Chord Spanwise View ( -85% Span )
2.3 The RANS Model of the ADLARF First Rotor
The analysis tool used mainly to complement the investigation of blade passage aerodynamics is a Reynolds-averaged Navier-Stokes (RANS) solution of the blade passages of the ADLARF first rotor by Hah et al [3]. The total pressure distribution, the total temperature, and two velocity components serve as boundary conditions at the inlet surface. At the exit boundary surface, static pressure is specified at one circumferential location. Since a 3/rev distortion yields no symmetry in a 16-blade rotor, the flow field for the entire rotor was caclulated.
Results from the RANS ADLARF rotor model are used to define the blade passage flow field and identify unsteady events resulting from the inlet distortion. These computational data are at the same rotational speed (71% of design) as the ADLARF experimental data, with the exception of the LDV data. The LDV data were taken at a lower speed (62% of design); however, qualitative comparisons can still be made with the rotor computations because the incident flow is still in the transonic regime. In addition to flow field comparisons, comparisons of distortion propagation and compressor performance parameters are made using the computational data.
2.4
Summary
This chapter presents the technical approach of this research effort. The effort focuses on three main topics-distortion propagation, compressor performance, and blade aerodynamics and structural response. The ADLARF data, which are central to all three topics, are described in terms of test configuration, method, and measurements. A brief decription of the Stage 35 model, which is used to complement the distortion propagation investigation, is presented along with geometry and design specifications from the Stage 35 rotor (Table 2-4). Lastly, a brief description of the RANS ADLARF rotor model, which is used mainly to complement the blade passage aerodynamics investigation, is presented.
Chapter 3
DISTORTION PROPAGATION
This chapter looks at the propagation of a sinusoidal 3/rev total pressure distortion through a transonic compressor. The objective is to determine whether a distortion will be able to pose an HCF problem for rotor blades downstream of the first stage. To this end, this chapter investigates whether a distortion will be attenuated or amplified as it proceeds through a multi-stage compressor.
The first section of the chapter uses equations relating compressible flow properties in order to provide perspective on screen-generated total pressure distortions. Results from the Stage 35 model are also provided to illustrate the distorted flow behavior and to elucidate anticipated local changes in the magnitudes of flow properties due to such total pressure distortions. The second section examines distortion propagation in the ADLARF compressor using experimental data and results from the RANS computation of Rotor 1. The third section uses the computational flow field in the Stage 35 model to corroborate the ADLARF measurements. Finally, the results section focuses in on the two important topics governing distortion propagation: the filtering of frequency components and distortion amplification.
3.1 Anatomy of a Screen-Generated Total Pressure Distortion
This section uses compressible flow relations and the equation of state to examine the anatomy of a screen-generated total pressure distortion. Figures shown were generated using results from the Stage 35 model as it responded to a sinusoidal 3/rev total pressure distortion at 72% of its design speed.
A typical total pressure distortion generated by a screen in an inlet duct implies distortion of other properties as well as of total pressure. For a screen that is far upstream of the compressor, two main assumptions can be made about the flow just after the distortion screen-the streamlines are straight and parallel, and there is negligible heat transfer across the streamlines. These assumptions imply uniform static pressure p and uniform total temperature, respectively.
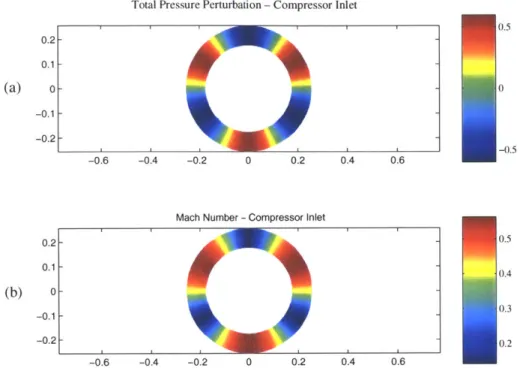
Using the relationships between stagnation (total) and static quantities in terms of Mach number M, the relation for total and static pressure,
implies high Mach number in areas of high total pressure as well as the converse (Figure 3-1, from the 3/rev distortion imposed on NASA Stage 35 using Gong's three-dimensional computational model for multi-stage compressors). This, together with the relation for total and static temperature,
T,= =T(1+1M2]
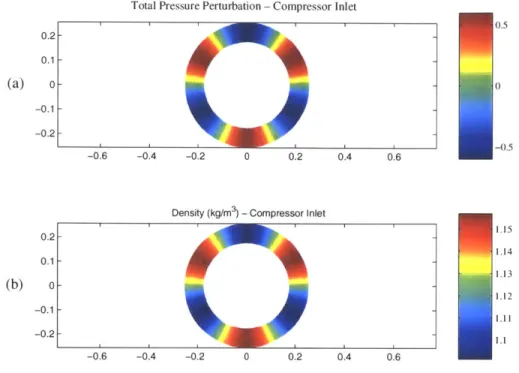
then implies low temperature in areas of high total pressure as well as the converse (Figure 3-2). As a result, the equation of state for a perfect gas,
p = pRT
where R is the gas constant, implies high density p in areas of high total pressure as well as the converse (Figure 3-3). The definition of Mach number,
VF M =
or,
V=M T= (p, , 2yT, _p
y -1 p -- y 1 p
then implies high velocity V in areas of high total pressure as well as the converse (Figure 3-4).
To summarize, the presence of a total pressure distortion in uniform static pressure and total temperature fields requires that there also be distortions in Mach number, static temperature, density, and velocity. The Mach number, density, and velocity distortions are in phase with the total pressure distortion while the static temperature distortion is out of phase. The distortions in Mach number and velocity are intuitive; however, the distortions in density and static temperature may not be. The main deduction that can be made from this analysis is that these distortions result in higher concentrations of mass and momentum in areas of high total pressure.
0.2 0.1 (a) 0 -0.1 -0.2 0.2 0.1 (b) 0 -0.1 -0.2
Total Pressure Perturbation -Compressor Inlet
-0.6 -0.4 -0.2 0 0.2 0.4 0.6
0.5
Mach Number - Compressor Inlet
-0.6 -0.4 -0.2 0 0.2 0.4 0.6
10.4
3
Figure 3-1. (a) Total pressure perturbation normalized by the upstream dynamic pressure and (b) Mach number at the compressor inlet of NASA Stage 35.
Total Pressure Perturbation -Compressor Inlet
0.2 0.1 (a) 0 -0.1 -0.2 0.2 0.1 (b) 0 -0.1 -0.2 -0.6 -0.4 -0.2 0 0.2 0.4 0.6
Static Temperature (K) - Compressor Inlet
-0.6 -0.4 -0.2 0 0.2 0.4 0.6 0.5 -0.5 284 282 280 278 276 274 272
Figure 3-2. (a) Total pressure perturbation normalized by the upstream dynamic pressure
I.
I -_ ~ ---Total Pressure Perturbation -Compressor Inlet
I-'
-0.6 -0.4 -0.2 0 0.2 0.4 0.6
Density (kg/m3) - Compressor Inlet
(0.5 1.15 1.14 1.13 1.12 1.11 1.1 -0.6 -0.4 -0.2 0 0.2 0.4 0.6 Figure 3-3. and (b) dens
(a) Total pressure perturbation normalized by the upstream dynamic pressure ity at 0.2 0.1 (a) 0 -0.1 -0.2 0.2 0.1 (b) 0 -0.1 -0.2
the compressor inlet of NASA Stage 35.
Total Pressure Perturbation -Compressor Inlet
-0.6 -0.4 -0 2 0 0.2 0.4 0.6
Velocity (m/s) - Compressor Inlet
-0.6 -0.4 -0.2 0 0.2 0.4 0.6
Figure 3-4. (a) Total pressure perturbation normalized by the upstream dynamic pressure and (b) velocity at the compressor inlet of NASA Stage 35.
0.2 0.1 (a) o -0.1 -0.2 (b) 0.5 0 -0.5 180 160 140 120 100 80 60
3.2
Distortion Propagation in the ADLARF Compressor
During the ADLARF tests, a distortion screen was used to create a 3/rev total pressure distortion similar to the one imposed on the Stage 35 model. The propagation of the distortion through the compressor was measured by total pressure rakes at the compressor inlet (located one rotor radius upstream of the Rotor 1 inlet), the Stator 1 leading edge, the Stator 2 leading edge, and the compressor exit (Figure 3-5). Propagation through the RANS model of the ADLARF first rotor is shown in Figures 3-6 and 3-7 for the purposes of comparison.
Total Pressure Perturb. vs. Axial and Circum. Locations at Mid-Annulus Phase-Shifted for t=tO
0.8- - - 0.6- 0.4-o 0.2-- - 0-CD 0 - . . . . .. .. . .. .. . . .
_n
9.
.
....
..
.
..
.
.
.
..
..
.
0 50 100 150 200 250 300 350 400theta (aft looking forward)
Figure 3-5. ADLARF total pressure perturbation normalized by the dynamic pressure versus circumferential location as measured at sensor.
average bellmouth each mid-annular
Total Pressure Perturbation vs. Circumferential Location at the Inlet Boundary 1.5 1_ 0L 0.-0. 0. 05 0--1-1 0 50 100 150 Circumference
Figure 3-6. Total pressure perturbation normalized by the average inlet dynamic pressure versus circumferential location at 85% span on the ADLARF first rotor computation inlet boundary surface.
Total Pressure Perturbation vs. Circumferential Location at the Exit Boundary
1.5_ 00 -0.. 0..5 -1 0 50 100 150 Circumference
Figure 3-7. Total pressure perturbation normalized by the average inlet dynamic pressure versus circumferential location at 85% span on the ADLARF first rotor computation exit boundary surface.
As seen in Figure 3-5, both rotors amplify the distortion. Results from the RANS rotor computation also show amplification, but the magnitude of the amplification is several
times larger than in the experimental data. Thus, the RANS rotor model significantly over-predicts distortion amplification. The small spikes in the RANS total pressure data at the inlet boundary surface correspond, in number and spacing, to the rotor blades. However, there is no physical reason for the blades to cause total pressure disturbances upstream of the rotor. The larger total pressure spikes at the exit boundary surface also reflect the presence of the blades, but it unknown to what extent their existence is physically reasonable. It can only be suggested that the total pressure spikes at the inlet are non-physical and that the data downstream may also have some non-physical influences.
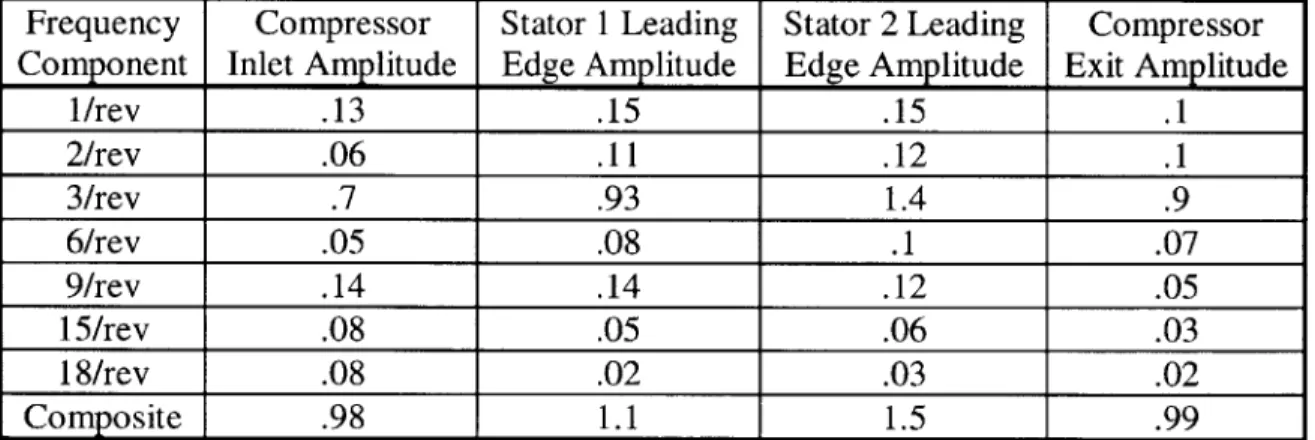
Distortion amplification can be an HCF issue in downstream blade-rows if blade resonance frequencies are low. In general, however, the lowest resonance frequencies can be found in the first rotor. Experimental ADLARF data (Table 3-1) show that some higher frequency distortion components can also propagate through the compressor, in addition to the 3/rev component. Note that the composite distortion amplitude listed in the table is formed from the superposition of the first 24 harmonics with their corresponding phasing.
Table 3-1. Normalized, annulus-averaged amplitude of the significant frequency components of the total pressure distortion measured at various stages in the ADLARF
compressor.
Frequency Compressor Stator 1 Leading Stator 2 Leading Compressor Component Inlet Amplitude Edge Amplitude Edge Amplitude Exit Amplitude
1/rev .13 .15 .15 .1 2/rev .06 .11 .12 .1 3/rev .7 .93 1.4 .9 6/rev .05 .08 .1 .07 9/rev .14 .14 .12 .05 15/rev .08 .05 .06 .03 18/rev .08 .02 .03 .02 Composite .98 1.1 1.5 .99
The 2/, 3/, and 6/rev components show a doubling of their amplitudes between the compressor inlet and the Stator 2 leading edge. In general, the compressor acts like a low-pass filter with a corner frequency somewhere between 6/ and 9/rev while the first rotor acts like a low-pass filter with a corner frequency between 9/ and 15/rev. The second rotor is also assumed to act as a low-pass filter; however, the corner frequency must be greater than 15/rev since no attenuation is seen in the major frequency components listed in Table 3-1.
A consequence of the propagating total pressure distortion is the creation of static pressure non-uniformities at the rotor exits. Experimental data for Rotors 1 and 2 are shown in Figures 3-8 and 3-9 while results from the RANS rotor computation are shown in Figure 3-10. These static pressure distortions result from the fact that, despite the presence of the total pressure distortion, the compressor must intake from and exhaust to
Static Pressure (normalized) vs. Time on Casing at Stator 1 Leading Edge 5. 5 O0 0 4.5 F 0 20 40 60 80 100 120 140 160 180 200 t(s)
Figure 3-8. Static pressure relative to the upstream average static pressure normalized by the upstream dynamic pressure as measured on the outside casing at the Stator 1 leading edge at three different circumferential locations with respect to top dead center (TDC).
Static Pressure (normalized) vs. Time on Casing at Stator 2 Leading Edge
0 20 40 60 80 100 120
t (s)
140 160 180
Figure 3-9. Static pressure relative to the upstream average static pressure normalized by the upstream dynamic pressure as measured on the outside casing at the Stator 2 leading edge at five circumferential locations.
63 degrees from TDC - 184 degrees from TDC - 272 degrees from TDC 20 19 18 16 15 14 12 degrees from TDC - 13.5 degrees from TDC - 15 degrees from TDC - 16.5 degrees from TDC - 18 degrees from TDC 200
Static Pressure Perturbation vs. Circumferential Location at the Rotor Exit 0.-4) -0.5_ 0 50 100 150 Circumference
Figure 3-10. Static pressure perturbation normalized by the upstream dynamic pressure at 85% span as computed at the exit of the ADLARF first rotor.
As can be seen in both the experimental and computational data, the amplitudes of the static pressure distortions are of the order of the upstream dynamic pressure. While the experimental data is plotted in the time domain, the fluctuation reflects the circumferential disturbance because the distortion screen is slowly rotating. Note that the pressure tap at 16.5 degrees from TDC appears to have malfunctioned. Offsets in static pressure are seen circumferentially in measurements throughout the compressor. It is unknown whether they are the result of an instrumentation problem or the result of standing acoustic waves in the circumferential direction.
3.3
Distortion Propagation in the Stage
35
Model
In order to corroborate the distortion propagation seen in the ADLARF compressor, a sinusoidal 3/rev total pressure inlet distortion was applied to the NASA Stage 35 compressor model at 72% of its design speed. This model is used below to examine distortion amplification, the distortion of static pressure, and swirl, which is not measured in the ADLARF tests.
The effect of the Stage 35 model on the total pressure distortion is shown in Figure 3-11. Like the ADLARF compressor, Stage 35 also amplifies the distortion. Furthermore, a static pressure distortion is exhibited at the rotor exit (Figure 3-12). As with the ADLARF compressor, the static pressure distortion is also in phase with the total pressure distortion. Thus, the Stage 35 model corroborates the ADLARF distortion amplification and static pressure distortion in a qualitative manner.
Total Pressure Perturbation -Far Upstream 1.5 0.5 0 -0.5 -1 -1.5
Total Pressure Perturbation - Rotor Exit
1.5 0.5 0 -0.5 -1 -1.5
Figure 3-11. Upstream and rotor exit total pressure perturbation normalized by the average belimouth dynamic pressure.
Static Pressure Perturbation - Far Upstream
1.5 0.5 0 -0.5 -1 -1.5
Static Pressure Perturbation - Rotor Exit
1.5
1
1
0.5
0
-0.5
-1.5
Figure 3-12. Upstream and rotor exit static pressure perturbation normalized by the average beilmouth dynamic pressure.
Another integral feature of an inlet distortion approaching a compressor, especially one without inlet guide vanes, is swirl. Swirl is the response of the flow to the non-uniformity being generated by the compressor in response to the total pressure distortion. Both the static pressure distortion and the resultant swirl begin to develop a short distance upstream of the first rotor where the flow first feels the rotor's presence. That distance
falls within one rotor radius of the first rotor face.
Swirl is of interest because it superimposes additional velocity and incident angle non-uniformities on those present due to the total pressure distortion by itself. While the influence of swirl is not addressed by this research, the presence of swirl is reflected in the flow angle distribution at the face of the Stage 35 rotor (Figure 3-13a). As one might expect, the circumferential velocity vectors show flow from regions of high static pressure to regions of low static pressure. Thus, the circumferential velocity is 900 out of phase with the static pressure distortion. Relative flow angle (Figure 3-13b), which is important to blade loading, then has a more complicated pattern-but still 3/rev-because it reflects the superposition of the effects of the total pressure distortion in addition to those from swirl.
20- 10- S0-(a) a 0 -10- -20--30 L 0 64 V (b) e il 1 2 3 4 5 6 7 Circumferential position 0 1 2 3 4 5 6 Circumferential position 7
3.4
Discussion
Results were presented regarding distortion amplification, static pressure distortion, filtering characteristics, and swirl in a transonic compressor. Amplification of the 3/rev distortion across the rotors and the presence of static pressure distortions at the rotor exits are seen in both the ADLARF data and the Stage 35 results. ADLARF experimental data also show that the rotors, and the compressor as a whole, act as low-pass filters, allowing only components of the distortion near or below the corner frequencies to pass. Swirl is shown at the rotor face of the Stage 35 model-it is due to the non-uniformity induced by the rotor as it interacts with the total pressure distortion.
Based on the results presented in Sections 3.2 and 3.3, it is clear that, in order for a distortion to propagate through a transonic compressor,
(1) the distortion frequencies must be near or less than the low-pass corner frequency. (2) the operating conditions should be such that those low frequencies would not be
significantly attenuated.
In the case of the inlet distortion in this research, the dominant (3/rev) frequency component is below the corner frequencies of the rotors. Also, the rotors amplify the dominant distortion frequency.
The following two subsections explore the physics that set the filtering and amplification characteristics of a compressor. Static pressure non-uniformities are also discussed, but
they are mostly dependent on the amplification of the total pressure distortion.
3.4.1 Low-Pass Corner Frequency
The low-pass corner frequency is approximately the frequency at which the response of a low-pass filter starts to drop off. The corner frequency for any filtering effect is dependent on time (or length) scales. In order to transmit a signal, the transmitting medium must be able to respond at the same rate that the signal magnitude changes. This required response time can be assumed to be of the same order as the signal's period, which is inversely proportional to the signal frequency. Therefore, the higher the frequency is (or the shorter the wavelength is), the shorter the required response time. The length scale for minimum response time (i.e. corner frequency) can be assumed to be of the same order as the corner frequency wavelength. A length scale commonly used in compressor analysis is chord length. This length scale shows up in a non-dimensional parameter that characterizes the importance of flow unsteadiness: the reduced frequency. The reduced frequency is the ratio of the steady (through-flow) timescale to the unsteady (disturbance) timescale. Alternatively, when divided by 27r, it is the approximate number of distortion cycles, or disturbance wavelengths, along the blade chord at any given time. Reduced frequency is calculated as follows:
N Nca
fR = Ndca
Vax
where Nd is the number of distortion cycles per rotor revolution (or, alternatively, Nd is
the EO of the incident frequency), N is the rotation speed of the compressor, cax is chord length in the axial direction, and Vax is the estimated average axial velocity at the inlet to the first rotor.
The reduced frequency of the first EO at 85% span of the first rotor and 71% operating speed is approximately 1.19, or .19 distortion cycles per chord. The reduced frequency for the ninth EO is then approximately 10.7, or 1.71 distortion cycles per chord. Since the corner frequency for the first rotor occurs between the 9th and 15th EOs, this places the appropriate length scale for corner frequency around one-half blade chord. In other words, if the wavelength of the distortion (in the chord-wise direction) is less then one-half the blade chord, the distortion is likely to be filtered out. For frequencies above the corner frequency set by the half-chord length, the blade responds more to an average of the unsteady pressures. The reason for this is that most (approximately 80%) of the work done by the blade is done in the first half of the chord, which has the largest pressure differences between the pressure and suction surfaces (Figure 3-14).
Figure 3-14 shows the static pressure distribution at 85% span from the RANS rotor compuntation. Note that the pressure differences across the blades are larger than expected-more than twice the upstream dynamic pressure-however, the information regarding distribution of work along the chord is as expected.'
The lack of filtering seen by Rotor 2 (Table 3-1) suggests that the corresponding reduced frequencies are lower for Rotor 2 than for Rotor 1. Indeed this is the case as the Rotor 2 chord length is approximately one-third the Rotor 1 chord length. This should put the corner frequency of Rotor 2 up above the 2 7th EO, which cannot be verified since
frequency components above the 18th EO were at the noise level throughout the
compressor.
The compressor, as a whole, shows some additional filtering (a lower corner frequency) which must take place between the Stator 2 leading edge and the compressor exit measurement station. It is unclear why additional frequencies are filtered out after Rotor 2 since the total pressure distribution should be quasi-steady (due to the slow rotation of the distortion screen) for stators. However, it is possible that there are some additional losses in this region that lead to increased filtering.
Cp - ADLARF Rotor 1
Figure 3-14. Static pressure relative to the average pressure normalized by the upstream dynamic pressure for the ADLARF first rotor at 85% span (NASA calculation).
3.4.2 Distortion Amplification
The objective of this section is to determine if parallel compressor theory [13] can be used to qualitatively explain the observed trends in the data. Appendix D explains how parallel compressor theory uses steady-state pressure ratio curves to predict compressor performance for (unsteady) distorted flow. The two main predictions of parallel compressor theory are compressor performance and distortion amplification. Two important assumptions for parallel compressor theory for high-speed compressors are (1) uniform flow sectors that result in quasi-steady flow through the blades and (2) negligible circumferential flow redistribution. Therefore, the fact that the distortion is sinusoidal and the possibility that there may be swirl at the compressor inlet may both detract from the applicability of parallel compressor theory. Nonetheless, this section compares crude predictions of distortion amplification using parallel compressor theory for high-speed compressors to measurements of distortion amplification in the ADLARF compressor.
i
6.882 -5.050It can be inferred from parallel compressor theory that, for the case of a flat pressure ratio curve, the distortion amplification across a compressor or stage is simply the pressure ratio. As is shown by ADLARF data in Chapter 4, the pressure ratio curves for Rotor 1 and for the Stator 1 - Rotor 2 combination are indeed flat. Table 3-2 compares the distortion amplification derived from Table 3-1 with the pressure ratios seen in next chapter's Figure 4-1. Note that the composite distortion referenced in the table is formed from the superposition of the first 24 harmonics with their corresponding phasing.
Table 3-2. Comparison of the experimental distortion amplification factors of the significant frequency components of the total pressure distortion with the parallel
compressor
theoryprediction.
Frequency Component Rotor 1 Amplification Stator 1 - Rotor 2 Amplification
1/rev 1.2 1.0 2/rev 1.8 1.1 3/rev 1.3 1.5 6/rev 1.6 1.3 9/rev 1.0 .86 15/rev .62 1.2 18/rev .25 1.5 Composite 1.1 1.4
For Rotor 1, the amplification of the composite distortion signal falls significantly short of the parallel compressor prediction. This is most likely due to the filtering of high frequency distortion content by Rotor 1, as discussed in Section 3.4.1. It is also evidenced by the better agreement that the lower frequency component amplifications show with the parallel compressor prediction. The results of the RANS calculation of Rotor 1 (Figures 3-6 and 3-7) show an amplification factor of approximately five.
The above analysis shows how to determine the total pressure distortion amplification expected across a compressor or stage that has a flat pressure ratio curve. The relationship between the slope of the pressure ratio curve and total pressure distortion amplification is discussed in more detail in Appendix D.
Also addressed in Appendix D, pressure ratio curves (indirectly) yield information about the static pressure distortions at the rotor and compressor exits. The relationship is more directly seen in looking at total-to-static pressure rise curves, however. The resulting relation is as follows:
(P2H - P2L = (PI1H - PtI )(1+ Cb)
where b is the slope of a line drawn between the two performance points and C, which is positive, is the amplitude of the distortion in corrected mass flow rate divided by the amplitude of the total pressure distortion. Comparing the values of the last term in