Social Network Analysis to Examine Interaction Patterns in Knowledge
Building Communities
L’analyse des réseaux sociaux pour examiner les modes d’interaction dans les
communautés de coélaboration de connaissances
Donald N. Philip
Author
Donald N. Philip, sessional instructor, Department of Chemical and Physical Sciences, University of Toronto. Correspondence regarding this article can be sent to [email protected]
Abstract
This paper describes use of social network analysis to examine student interaction patterns in a Grade 5/6 Knowledge Building class. The analysis included face-‐to-‐face interactions and interactions in the Knowledge Forum® Knowledge Building
environment. It is argued that sociogram data are useful to reveal group processes; in sociological terms, the community lies in the connections among the group. A classroom of unconnected individuals is unlikely to form as a Knowledge Building community; data analyses reported in this study show promise in understanding the dynamics of
Knowledge Building in a consistent and measurable way. The strength of the work is not in particular patterns demonstrated but in new forms of assessment and their potential to inform work as it proceeds. The research reported shows that teachers and students are finding social network analysis useful and that through their engagement research-‐ practitioner-‐engineer teams are better positioned to develop tools to advance
Knowledge Building pedagogy.
Résumé
Cet article décrit l’utilisation d’une forme d’analyse des réseaux sociaux pour examiner les modes d’interaction des élèves dans une classe de coélaboration de connaissances de cinquième/sixième année. L’analyse incluait des interactions face à face, ainsi que des interactions dans l’environnement de coélaboration de connaissances Knowledge Forum. L’analyse des données concernant les interactions face à face a démontré que les élèves formaient des groupes de manière flexible pour résoudre les problèmes de coélaboration de connaissances, mais qu’il y avait des disparités entre les groupes en ce qui a trait à la proposition d’idées. L’analyse des données provenant de Knowledge Forum indiquait aussi que la lecture de notes était forte à l’intérieur du groupe (un seul individu participait de façon périphérique). Répondre aux contributions des autres était une activité moins fréquente que la lecture de notes. Par ailleurs, il y avait un élève qui ne participait pas. L’article avance que de telles analyses pourraient procurer à
Social Network Analysis to Examine Interaction Patterns in Knowledge Building
de coélaboration de connaissances. Certains de ces outils sont disponibles dans le Knowledge Forum, et les données préliminaires suggèrent que les enseignants et les élèves trouvent ces outils utiles.
Introduction
Knowledge Building is a social process in which new knowledge is created (Scardamalia, 2003) and understanding emerges through grappling with problems of understanding (Bereiter, 2002). In Knowledge Building classes, students take collective responsibility to advance the knowledge of the community. "Collective responsibility ... refers to the condition in which responsibility for the success of a group effort is distributed across all the members rather than being concentrated in the leader" (Scardamalia, 2004, p. 2). “Knowledge Building is a social intentional activity of a community which by definition cannot be achieved by individuals in isolation” (Law, 2005, p.3).
Collective responsibility for knowledge advancement within a community includes identifying gaps in present knowledge and informing other members of problems so that they can work together to resolve difficulties. Making public within the community what is known and what is not known requires “a social dynamic conducive to sharing and open exploration of ideas” (Law, 2005, p.5). Sharing in Knowledge Building classes requires that there be affordances for communication among class members, more so than in classes in which communication is largely between individual students and the teacher. Maintaining a high level of communication within the group so that information provided by one member is effectively communicated to all is a collective responsibility. "Community Knowledge, Collective Responsibility" is one of the 12 guiding principles for Knowledge Building classes (Scardamalia, 2002; Law, 2005).
According to social network theory, high levels of communication are achieved through social ties, with strong ties being more effective for communicating complex knowledge than weak ties (Granovetter, 1973; Hansen, 1999; Haythornthwaite, 2002; see also Hong, Scardamalia,& Zhang, present issue). Strong ties are characterized by frequent and reciprocal interaction; weak ties by less frequent and non-‐reciprocal interaction (Lai & Wong, 2002; Ogle, 2007; Ruef, 2002).
Facilitating and monitoring reciprocal action are both important to ensure that students are writing enough for the group and reading enough of each other’s contributions that knowledge advancement is likely. Towards this end, an online discourse medium Knowledge Forum® was developed. It is a “collaboration platform specifically designed to embody the technological dynamics necessary to support the emergence of the 12 Knowledge Building principles” (Law, 2005, p. 3; Scardamalia, 2002).
In a Knowledge Building class, much of the Knowledge Building interaction takes place in Knowledge Forum. Students enter their ideas in the form of notes (postings) to the online space, and other students respond to their postings. An idea spoken aloud is ephemeral. Once
the first syllable of a word is spoken it disappears before the last syllable is spoken, making ideas expressed orally hard to remember (Ong, 1982). Knowledge Forum provides a public space in which ideas can be recorded and retrieved for later reflection and aids in the recall of ideas and later modifications.
In addition to enabling students to create notes and respond to the notes of other students, Knowledge Forum has other affordances to support the Knowledge Building process. These include metacognitive scaffolding, keywording, search capabilities, referencing capabilities, collaborative multiple authoring of notes, and a suite of assessment tools called the Analytic Toolkit that generate reports from server log data of the interactions among the students within the Knowledge Forum environment. This suite of tools allows researchers, teachers, and students to extract data about their interactions as a type of formative assessment that is concurrent and embedded in the Knowledge Building environment. These can be used to supplement other forms of assessment. In this study, Knowledge Forum was used by the teacher and pupils for online interactions and some of the assessment tools were used to apply social network analysis to the discourse.
Knowledge Building Classrooms
Given the use of computers in the classroom of this study, the class may be considered a “hybrid class,” corresponding to the third of four types of class given by Allen and Seaman (2005): (1) traditional classes with no online content; (2) classes that are basically traditional but having some online content; (3) blended, hybrid, or web-‐enhanced classes with both face-‐ to-‐face and online interactions; and (4) fully online (web-‐centric) courses with no face-‐to-‐face interactions. Hybrid classes are interesting because students have the option of interacting orally or online, and because there is indication that they have been more successful than other forms of online classes (Palloff & Pratt, 2001).
Because of the hybrid nature of Knowledge Building classrooms, monitoring discourse in them presents a special challenge to the researcher. Much of the discourse is face-‐to-‐face, in addition to discourse mediated through the online learning environment, Knowledge Forum. In this classroom, the students were accustomed to switching back and forth between face-‐to-‐face and online interactions. Although the researcher had access to all online discourse, he did not have a record of face-‐to-‐face interactions in the classroom, as classroom discourse is, of course, more difficult to capture. As well, face-‐to-‐face interactions can happen outside the classroom through playground interactions, conversations going to and from school, over the telephone, or through any of the other multiple media available today. Thus it is difficult to determine the relative importance of the various discourse forms and the patterns of interaction that spread ideas and produce new knowledge.
The current study was part of a larger study examining the relationship between the social network structure and the spread of ideas in an online learning environment. The full study examined the network structure that formed as ideas spread; methods of establishing the
Social Network Analysis to Examine Interaction Patterns in Knowledge Building
network structure of ideas; the role of student interactions in idea spread; the functioning of Knowledge Forum in idea spread; gender patterns in idea spread; and whether there is idea improvement as well as idea spread. The focus of this study was patterns of interaction present among the students considering student discourse as revealed through self-‐reports and
examination of the online database (see the Methodology section for details).
It is important in Knowledge Building classrooms, and in online learning in general, to establish a community (Palloff & Pratt, 2001). In social network terms, the “connected component”–the largest group of individuals who are connected in the network–defines a community (Barabási, 2002). Examination of the network can tell us much about community formation.
Setting
The class was a multi-‐ethnic, co-‐educational grades 5/6 class of 22 students and their teacher, of whom 20 students chose to participate in the study. To support Knowledge Building in the classroom, students were given opportunities to have face-‐to-‐face interactions about their ideas or to write about them online. They often chose to write. This particular class was selected for study because the teacher had several years of experience with Knowledge Building pedagogy.
The class was well provided with laptop computers, usually one per student, available as needed. The teacher organized the class so that there was a time for extended Knowledge Building inquiry usually three times per week for 90 minutes at a time. The teacher typically introduced an area of inquiry, phrased as a problem of understanding. During data collection for this study, the class was studying a unit on ancient civilizations, and the problem the class was tackling was why some societies were considered civilizations and others were not. The students had been given a set of five identifying characteristics of civilizations during a visit to the Royal Ontario Museum (ROM). In Knowledge Building style (one of the Knowledge Building principles is "Improvable Ideas"), the students did not consider these five characteristics to be fixed and incapable of improvement. The students, both in Knowledge Building talk and in writing in the online database, frequently put forward societies that they considered might be civilizations. They discussed why these might be considered civilizations, and how the definition given at the ROM might be changed. The students were not assigned to work groups by the teacher; instead, they organized themselves into inquiry groups as needed, with the scope and sequence of their inquiries emerging naturally from the research the students did around the ideas being examined.
The classroom consisted of two rooms joined by a narrow workspace. Students were free to move between rooms as they worked, and frequently work groups formed, split up, and reformed with new members as the work progressed.
Methodology
This paper presents analysis of two sources of data: responses to a set of three separate weekly self-‐report questionnaires intended to establish the face-‐to-‐face interactions among students; and patterns of communication obtained by data mining the Knowledge Forum database after the completion of the unit of study. Although the questionnaires were identical in structure each time (e.g., number of items, method of presentation) the idea being tracked changed with each questionnaire.
For the questionnaires, each week the researcher and the teacher found an important idea that had been under discussion for the week. Weekly questionnaires were chosen so as not to be overly disruptive to the class. For example, one student’s idea about ancient civilizations that was tracked was, “The way in which they got their food is important in deciding if a people are a civilization.” Both the teacher and researcher thought this idea was important enough to be remembered and discussed by the students. Each week, after the teacher and researcher selected an idea for tracking, the researcher administered a very simple questionnaire that asked the students with whom they had communicated about the idea by any means except Knowledge Forum. This was taken as a measure of their interactions about the idea. The teacher ensured that the students understood what was being asked of them. The results allowed the researcher to create sociograms that showed the interaction pattern among the students outside of the online environment.
Online discourse was analyzed using a suite of analytic tools called the Analytic Toolkit. Each analytic tool within Knowledge Forum automatically extracts various kinds of server log data, including data suitable for social network analysis. Data of three kinds were obtained for this study: note reading patterns (“Who’s Read Whose Notes”); building-‐on (responding) patterns (Who’s Built-‐on to Whom”–patterns of responses); and co-‐authoring of notes. Once these data were obtained, they were analyzed using network analysis techniques—now built into
Knowledge Forum—to see what communication patterns, if any, had emerged from the student interactions online. Such patterns, sometimes called structural signatures (Skvoretz & Faust, 2002; Welser, Gleave, Fisher, & Smith, 2007), are proving to be quite helpful in analyzing the team structure of work in Knowledge Building classes through showing how the students coalesced as they worked on the problems of inquiry. The analysis of student reports of their face-‐to-‐face interactions showed patterns at three points in time, while the database analysis showed the overall patterns of interaction over the entire period of the inquiry.
Social Network Analysis
Social Network Analysis, a technique used in sociology and other disciplines, has roots in graph theory, a branch of mathematics (Watts, 2003). In social network analysis, the agents in the system (students in this study) are represented as dots called nodes, and social connections among agents are represented as lines called arcs or edges. Such data are collected:
Social Network Analysis to Examine Interaction Patterns in Knowledge Building
To gain some understanding of how patterns of behavior emerge–and patterns
undoubtedly do emerge–from the statistical melée of many individuals doing their own idiosyncratic thing. … By gaining such knowledge, we might hope to adapt our social structures to the way things are. … We might identify modes of organization that fit with the way we actually and instinctively behave. (Ball, 2004, p. 31)
In social network analysis, diagrams (called graphs in mathematics) showing agents and their connections are called sociograms. These are of two basic types: directed, in which information transfer from one node to another is not held to be reciprocal; and undirected, in which
information transfers are presumed to be (at least potentially) reciprocal.
There exist real-‐world examples of each. For example, in a school classroom, if student A speaks to student B about an idea, a discussion frequently ensues. Consider the following exchange from the class in which a student posed a question to their group (related to sorting out what makes a society a civilization) and each member responded:
Question: What if the artifacts that are not made of preservable materials do last? For example the totem poles that we saw in the ROM?
Response 1: It shouldn’t matter what the building material was, but the purpose to which it was put is important. For example, if a temple is made out of wood, and really nicely carved … it would be better, even if it didn’t last as long.
Response 2: A lot depended on where the people lived and what resources they had access to.
Response 3: A group was not concerned about whether they were a civilization, but how to use their resources to survive.
Response 4: Maybe a civilization does have a set of characteristics. Otherwise how would we judge them?
Response 5: If all the civilizations have to be one way, to have certain things, but isn’t the greatness test is that they have something unique?
This would be analyzed as an undirected graph, because each student in the group responded to the original question. Undirected graphs are easier to analyze than directed graphs, and there has been more work done on them. However, most real-‐world graphs are directed, as many times, communication is not reciprocated. If a student posts a note and another student responds to it, then that is a directed interaction: the second student has responded to the first, but the first has not (yet) responded to the second. In this study, face-‐to-‐face interactions were considered to be reciprocal and were analyzed as such. However, online communications may be either directed or undirected. Arrowheads indicate the reciprocal or non-‐reciprocal nature of the communication. An example of that occurs when a class or group goes into “broadcast mode”—one person speaks and the others do not respond. This was observed
frequently in this class when students were working together and a student decided to read a Knowledge Forum note aloud. Although the other students had the opportunity to respond to the note, they sometimes chose not to, either verbally or in the form of a response online. The same data used to create the sociograms can be used to explore other network measures such as density and indegree (explained below).
Network Measures
The network measures density and indegree were chosen for this study because they are commonly used, well-‐understood measures of social networks. Density indicates how many pairs of individuals have actually communicated compared to the total number of pairs of individuals. Indegree and outdegree are reciprocal measures of the extent to which individuals are communicating with others in the network.
Social networks are created by individuals interacting. In this study, we are interested in interaction events. The act of posting a note may be considered an attempt at interaction; the social network only includes successful interactions.
Density
The density of a network is a measure that ranges between zero and one (although it can be expressed as a percentage), and is the ratio of the number of observed edges (representing social connections between pairs of individuals) divided by the maximum number of edges possible. Thus density reflects the pathways rather than the volume of communications. In a four-‐person network, the total number of connections possible is six because there are six distinct pairs of individuals. If there are five interaction pairs, then the density would be 0.833 (about 83%). Density can be strongly affected by the size of the network. Lipponen, Rahikainen, Lallima, and Hakkarainen. (2003) note that larger networks generally have lower densities than smaller ones. Large networks are typically considered to be larger than 1,000 nodes; the class in this study had twenty participating students and so it represents a small network.
Measures of Individual Connectedness: Indegree and Outdegree
Indegree and outdegree are measures of interaction to and from an individual agent. Formally, the lines connecting the nodes on a sociogram are called arcs or edges. The number of arcs pointing to a given node is called the indegree of the node, while the number of outbound arcs is called its outdegree (Degenne & Forsé, 1999). In the context of the current study, for analysis of note reading, if Student A reads one or more notes by Student B, this would be represented as an arc with the arrowhead pointing from A to B (AB.) If Student A had read notes only by Student B, then Student A would have an outdegree of one. If no one had read any note written by Student A, then Student A would have an indegree of zero. If Student B had read notes by two other students and if three other students had read some of Student B’s notes, Student B
Social Network Analysis to Examine Interaction Patterns in Knowledge Building
would have an outdegree of 2 and an indegree of 3. It is common to report normalized values called degree centrality by dividing the degrees by N1, where N is the number of nodes. In the example just given, with N=4, Student B would have an outdegree centrality of 2/3 and an indegree centrality of 1. Similar measures could be taken for responding to (building on) other students’ notes. In undirected graphs, summing the indegree and outdegree values gives the nodal degree, but in directed graphs, indegrees and outdegrees are reported separately. For the purposes of this paper, indegrees are examined, as they are considered to be a reliable
measure of the importance (centrality) of an individual to the network.
In the context of the current study, social network analysis was used to analyze the interaction patterns among students both in their face-‐to-‐face interactions and in the writing and reading in the Knowledge Forum environment. Data as to who interacted with whom about ideas, who read the notes of other students, who responded to these notes and so forth were collected and analyzed. It should be noted that this approach examines only patterns, not the content of these interactions. Thus, social network analysis can tell the observer whether or not the students are engaging in the kinds of behaviour that are consistent with Knowledge Building (such as reading and responding to notes), but to determine whether or not Knowledge
Building actually occurred requires qualitative analysis of the note contents and analysis of the kind of knowledge a classroom teacher would have by virtue of being present when
interactions occurred.
Results
A Typical Knowledge Building Session
In the class studied, Knowledge Building sessions usually began with a reminder from the teacher of what the class had worked on in the previous session and anything that had come to the teacher’s attention, either through conversations with students or through reading
database notes (postings). The students then proceeded to work, choosing to do what was needed according to their stages of idea development. Some would get their computers, some would get books and others, other materials. If they had new ideas, they would post notes; they might read the notes of other students and respond to them. If they needed to gather information, they would get books or conduct research on the Internet. Some would discuss things with other students. Students could work alone or in groups. Any groups that formed were self-‐organizing, and often short-‐lived. Often the groups arose from the previous session’s work.
The teacher and students often discussed high-‐level goals for the research, in this case, to understand ancient civilizations and what made them civilizations. As shown in a separate study of this teacher’s classroom (Zhang, Scardamalia, Reeve, & Messina, 2009) the teacher
continually turned over more of the high level activity to students, including selection of appropriate materials, scheduling of meetings, and online discussions. The teacher, along with other students, helped to keep things on track, discuss possible data sources, create
interactions that supported Knowledge Building, and keep up with work in the Knowledge Forum database, since much of the class work occurred online.
Work in online environments can be somewhat invisible as noted by Cross, Borgatti and Parker (2003) in business contexts. Even a teacher who is vigilant about reading postings may have difficulty identifying who is, and who is not, participating appropriately. To aid in this
identification, social network analyses can be particularly useful, helping teachers identify who is, and who is not, engaged.
Social network tools built into Knowledge Forum allow for a rapid analysis (within seconds) of communication patterns. In the class run by the teacher who participated in this study, both students and teachers used the social network analysis tool, sometimes daily. The teacher reported that the students can be startled by seeing their communication patterns, and have been observed to change their communication behaviour on their own without teacher prompting.
Oral Communication Patterns--Questionnaire Results
The first set of results was derived from the questionnaires given to the students and
concerned the spread of ideas among them. Each questionnaire asked about a particular idea and with whom the students had communicated about that idea other than through Knowledge Forum. From these results, the sociograms below were created.
Social Network Analysis to Examine Interaction Patterns in Knowledge Building
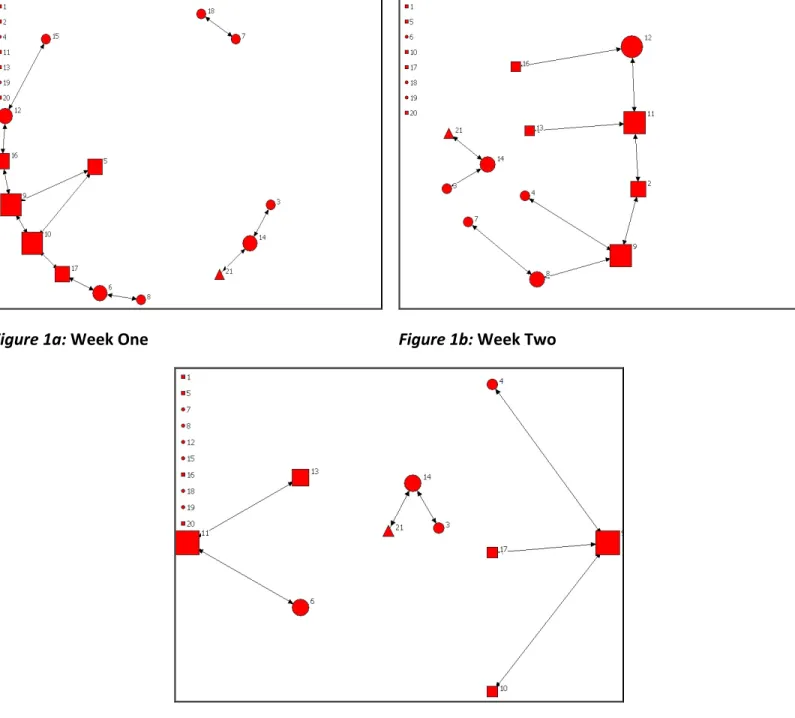
Figures 1a, b, c: Questionnaire results—face-‐to-‐face interaction: (a) week one, (b) week two; (c) week three.
Figure 1a: Week One Figure 1b: Week Two
The sociograms in Figures 1a, 1b, and 1c contain quite a lot of information. Boys are identified as squares, girls as circles, and the teacher as a triangle. The sociograms are constructed using spring (force-‐based) algorithms, which assign attraction and repulsion parameters to the nodes based on frequency of communication. The size of each node indicates its indegree.
All three sociograms, Figures 1a, 1b, and 1c, are different, reflecting changes in grouping from the first week to the third. As described above, the students organized themselves into groups around ideas of interest as dictated by the flow in inquiry instead of working in teacher-‐
assigned groups. As can be seen also, there are a number of non-‐participants–students who did not communicate about the idea under study (seen on the left of each sociogram). This does not, however, actually mean a total lack of participation. The construction of the questionnaire was such that the students were not asked if they had read about, or heard about the idea under study–just if they personally had communicated about it with someone else. Since the ideas were discussed in class and in the Knowledge Forum database, these students were only non-‐participants in the direct, face-‐to-‐face interaction sense.
The teacher does not dominate the discussion. If the teacher had dominated the discussion, and had been the one with whom the students communicated most of their ideas, the
sociogram would have a star network appearance with the teacher in the centre of a number of lines of communication. Clearly here, the students did not feel it necessary to involve the teacher in all discussions of the idea.
As can be seen from Figures 1a, 1b, and 1c, groups were small and communication was sparse. This is partly because the students preferred to communicate their ideas in the Knowledge Forum database and because the teacher encouraged that. During an interview, the teacher commented, “[A]lthough it would be much more natural for [a] child to have read [a] note and say, "John, I completely agree with what you're saying, here, let me tell you more," they'll write it down [in Knowledge Forum] because we've structured the class that way.” Because of the sparseness of the communication in face-‐to-‐face interaction, as assessed in the questionnaire technique used in this study, no sociometrics are given for such interaction; interaction events were too sparse for the numbers to be meaningful.
Patterns of Note Reading, Responding, and Co-Authoring in the Knowledge Forum Database
The next section presents data obtained from the Analytic Toolkit. These data were obtained from the archived server log data tracked by Knowledge Forum as the students read, responded to, and co-‐authored notes in the database.
Table 1 shows the basic sociometric measures from the Knowledge Forum database for the time period of the study. The principal means of idea spread among the students in the
Knowledge Forum database were through reading notes, responding to notes (building-‐on), and co-‐authoring notes.
Social Network Analysis to Examine Interaction Patterns in Knowledge Building Table 1: Basic sociometric measures for the class.
Students Connections
(Edges) participants Non-‐ Density
Note Reading 20 348 0 92%
Responding
(Building-‐on) 20 64 1 15%
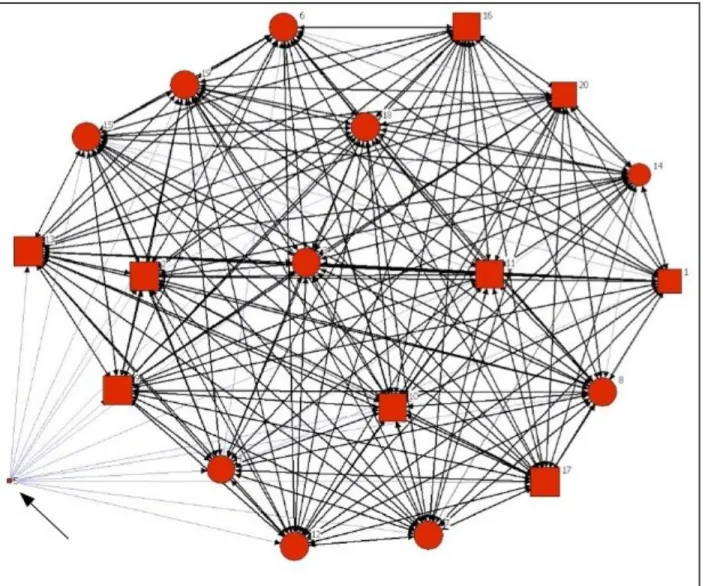
The differences between note reading and responding are quite striking. In reading, 348 separate reading events were recorded and 92% of the possible connections were realized, while only 15% of possible response (building-‐on) opportunities were realized. These are somewhat lower than actual events in the classroom; classroom observations revealed that students would sometimes read notes together from one computer when they were working together. The same is true for responding. Responding was much less frequent than reading and may suggest more attention and time needs to be committed to building onto ideas. The sociograms of reading and responding reveal broad participation. Figure 2 shows how densely connected the students are in terms of their reading behaviour. The graph was generated using a spring algorithm that groups students according to their frequency of interaction. The
sociogram shows that most of the students are evenly clustered together. Student 5 (lower left) is visibly separate from the central communication mass of the class, indicating that he did not participate in reading as much as the rest of the class. Examination with other tools indicated that Student 5’s notes were being read by the other students, but Student 5 did not read the other students’ notes. In such a case, an intervention by the teacher might be warranted. Student 5 might have had an eye problem, might have been absent for a period, might have reading difficulties, or might have been experiencing other problems. The form of intervention would, of course, depend on the teacher’s knowledge of the class and the individual.
Figure 2: Spring algorithm sociogram of the reading pattern in the class. Student 5 (see arrow at lower left) is separate from the central mass of the students.
Social Network Analysis to Examine Interaction Patterns in Knowledge Building
In Figure 2, boys are represented by squares, girls by circles, and node size indicates indegree. Line thickness is a measure of reciprocity of communication: thin lines are one-‐way (weaker tie), and thicker lines show reciprocal (stronger tie) interactions. The high reading density (92% of the theoretical maximum) was achieved by the teacher simply allotting dedicated time to note reading during some of the extended inquiry periods.
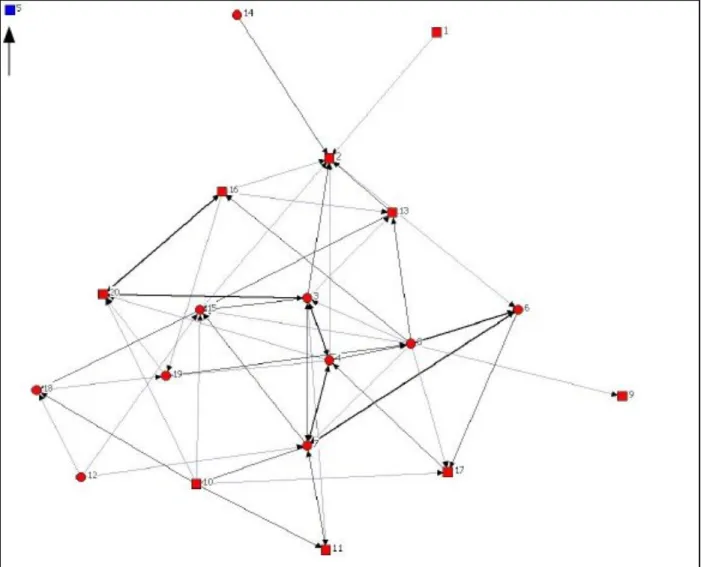
Figure 3 shows the response pattern (building-‐on) among the students.
In Figure 3, square nodes represent boys and circular nodes represent girls. Although there appear to be a fairly large number of responses, most students did not respond more than once to another’s postings, and much of the building-‐on was non-‐reciprocal. One student (arrow) did not respond to any other students’ notes at all. This example gives a good indicator of how a teacher might find the social network information of value. It is easy to see that building-‐on is sparse compared to note reading, and that there is one student who is not participating– something that might be difficult to discern otherwise.
Indegree Centrality Data for Note Reading
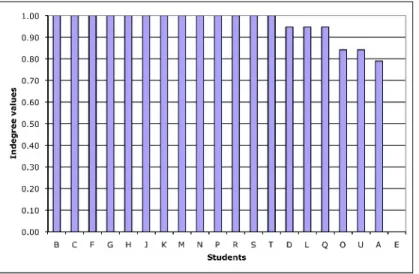
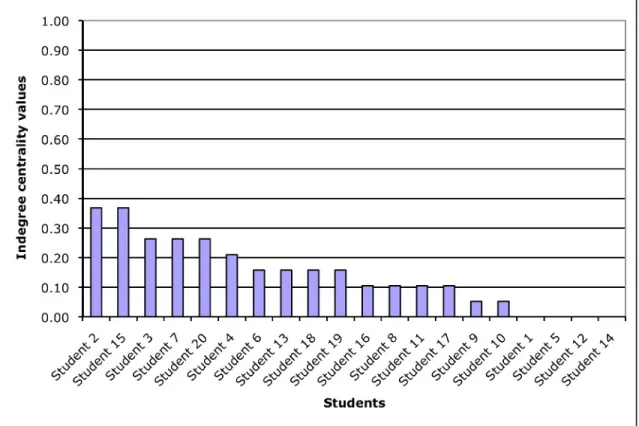
Figure 4 shows the (normalized) indegree centrality data for note reading in the class. For note reading, the indegree value calculations are based on the number of edges pointing to a node (student), meaning that the student’s notes had been read by those students from whom the edge originates. Presumably, in a Knowledge Building situation, students would read other students’ notes and other students would read their notes.
Figure 4. Graph of indegree centrality values for note reading, sorted from highest to lowest. Figure 4 shows a plateau of maximum scores for indegree centrality for note reading. While some students are on the trailing end, there is considerable evenness of participation here. In some sources on social network analysis, indegree values are treated as a measure of status– the higher the indegree value, the higher status the individual has in the community
(Wasserman & Faust, 1994). In this case, we can see that there would be very little difference in status among the class members, a possible indicator of the principle of democratization of knowledge (Scardamalia, 2002). The data are consistent with even participation. In interpreting these data, the reader is reminded: (1) that the measure is based on notes being opened (there is no assurance that notes are actually read); and (2) indegree centrality is indifferent to which of a students’ notes were read; it is based on how many other students read at least one of the
Social Network Analysis to Examine Interaction Patterns in Knowledge Building
given students’ notes. Furthermore, the measures should be considered together with the teachers’ knowledge of the students, the substance of the notes, and the classroom dynamics, including oral communication.
Responding to Notes
Figure 5 shows the indegree centrality data for building-‐on (responding) among the group. The graph is scaled to the same axis as the note-‐reading values (Figure 4) for ease of comparison. The indegree values for responding are lower than the indegree values for note reading. This is to be expected: not every student would respond to every other student, nor would it be desirable. Nonetheless, a teacher, looking at this, might decide that responding was not at a desirable level and ask that students make a greater effort in this regard. Again, the teacher’s special knowledge of the class is essential here in interpreting the findings. In the current case the teacher indicated that he really didn’t know how to interpret the results at this early stage. As he suggested, “It might be perfect just the way it is.” His approach indicated the need to review results not only in context but over time.
Figure 5: Indegree centrality values for responding.
Discussion
Social network analysis shows great promise in assessing student interaction patterns in Knowledge Building classes. The questionnaire data on students’ interactions about their ideas revealed student-‐organized team structure as it evolved, and the data obtained from the Knowledge Forum database showed how density and indegree centrality might correspond to group cohesiveness or teamwork.
Sociogram data are useful to reveal group processes; with practice, a teacher can tell from a glance at such data who is participating, who is central to the network, and who is peripheral. The use of these measures gives educators a practical way of looking at group processes. The importance of this study lies not in the specific findings but in the manner in which they show the potential for looking at individual and group activity and how they show community formation.
These data are most useful when combined with other indicators, particularly the content of notes and the teacher’s intimate knowledge of the class and students. The analysis of data in this study demonstrates a new way of looking at learning dynamics at the group level and shows promise in understanding the dynamics of Knowledge Building in a consistent and measurable way.
Implications and Future Directions
As part of the ongoing evolution of Knowledge Forum, the suite of analytic tools now available to teachers is being expanded. Currently available tools include a contribution tool that
measures the number of contributions of new notes, responses and so forth; several tools that show growth in basic measures of textual literacy such as vocabulary and writing; semantic-‐ analysis tools, and a social network analysis tool that provides sociograms and basic sociometric measures. Tools for identifying and encouraging higher level forms of reflective discourse, such as identifying big ideas in a database and using visualizations to make them more accessible to the community are under development.
Anecdotal evidence from teachers currently using the analytic tools (including the teacher in this case study) suggests that they are useful. As well, some students have used the tools to assess their own work. At the Summer Institute, 2006, it took Grades 5 and 6 students about one and a half hours to learn how to use the social network analysis tools with brief instruction from a researcher. They did this while they were doing other things, indicating that the tools are neither difficult to use or to interpret. Interview data suggests that the students are using the tools to increase their reading and responding efforts. Nonetheless, a major challenge for next-‐generation efforts includes the improvement of interface designs so that results from use of analytic tools is easy to interpret by teachers and students without benefit of working with a collaborating researcher.
Social Network Analysis to Examine Interaction Patterns in Knowledge Building
The new social network analysis tools in Knowledge Forum added after this research was
conducted include a thresholding function that allows one to set how many links of a given type (read, build-‐on, reference, annotation) need to be included before an edge is displayed in the sociogram. This has proven to be simple to use and very useful in identifying the clustering of students.
In terms of teacher use, the vision here is quite simple. A teacher can use the social network tool to visualize how a community is developing in the class. A quick glance at the sociograms for reading, responding, etc., will tell the teacher who is participating, who is not, and to what degree the class is connected. As noted above, in sociological terms, the community lies in the connections among the group. A classroom of unconnected individuals is unlikely to form as a Knowledge Building community while the probability is greatly increased with highly
interconnected individuals. A teacher could use the sociograms, along with his or her own observations and data from other online tools (e.g., vocabulary growth) to get a picture of the overall development of the students as individuals and the class as a whole. The teacher could couple impressions about community formation with the results of basic social network analysis. New tools will enable teachers to assemble comprehensive patterns for any child, rather than needing to run each tool separately.
Extensions of the capabilities of the current version of the social network analysis tools have been requested, including analyses at the level of the individual ”view” (a collection of notes on a particular topic) rather than of the entire database. Additionally, teachers will want to look at their class results over months or years. Tools that can accommodate variations of this sort are under development. The power of work of the sort reported here, and variations on it, are suggested by analysis of patterns over a three-‐year period in one class showing teacher change from a teacher-‐centred to increasingly less teacher-‐centred model (Zhang et al., 2009). To do such an analysis using the current tools is time-‐consuming, but as suggested above, it is easy to automate such analyses and an open source international community is forming to increase the pace of innovation in Knowledge Building technology and assessment.
References
Allen, I. E., & Seaman, J. (2005). Growing by degrees. Online education in the United States, 2005 (Research report): Sloan Consortium.
Ball, P. (2004). Critical mass. How one thing leads to another. New York: Farrar, Straus and Giroux.
Barabási, A. (2002). Linked. The new science of networks. Cambridge, MA: Perseus Publishing. Bereiter, C. (2002). Education and mind in the knowledge age. New Jersey: Lawrence Erlbaum
Cross, R., Borgatti, S., & Parker, A. (2003). Making invisible work visible. In R. L. Cros, A. Parker & L. Sasson (Eds.), Networks in the knowledge economy (pp. 261-‐282). New York: Oxford University Press.
Degenne, A., & Forsé, M. (1999). Introducing social networks (A. Borges, Trans.). London: SAGE Publications.
Granovetter, M. (1973). The strength of weak ties. American Journal of Sociology, 78(6), 1360-‐ 1380.
Hansen, M. T. (1999). The search-‐transfer problem: The role of weak ties in sharing knowledge across organization subunits. Administrative Science Quarterly, 44(1), 82-‐111.
Haythornthwaite, C. (2002). Strong, weak, and latent ties and the impact of new media. The Information Society, 18, 385-‐401.
Hong, H. Y., Scardamalia, M., & Zhang, Y. (2010). Knowledge Society Network: Toward a dynamic, sustained network for building knowledge. Canadian Journal of Learning and Technology, 36(1).
Lai, G., & Wong, O. (2002). The tie effect on information dissemination: The spread of a commercial rumor in Hong Kong. Social Networks, 24, 49-‐75.
Law, N. (2005). Assessing Learning Outcomes in CSCL Settings. Paper presented at the Computer Supported Collaborative Learning 2005: The next 10 years!
Lipponen, L., Rahikainen, M., Lallima, J., & Hakkarainen, K. (2003). Patterns of participation and discourse in elementary students' computer-‐supported collaborative learning. Learning and Instruction, 13(5), 487-‐509.
Ogle, R. (2007). Smart world: Breakthrough creativity and the new science of ideas. Boston, Mass.: Harvard Business School Press.
Ong, W. J. (1982). Orality and literacy. The technologizing of the word. London: Routledge. Palloff, R. M., & Pratt, K. (2001). Lessons from the Cyberspace Classroom. The realities of online
teaching. San Francisco: Jossey-‐Bass.
Ruef, M. (2002). Strong ties, weak ties and islands: Structural and cultural predictors of organizational innovation. Industrial and Corporate Change, 11(3), 427-‐449.
Scardamalia, M. (2002). Collective Cognitive Responsibility for the Advancement of Knowledge [Electronic Edition]. In B. Smith (Ed.), Liberal education in a knowledge society (pp. 1-‐26). Chicago: Open Court.
Scardamalia, M. (2004). Collective Cognitive Responsibility for the Advancement of Knowledge. Education and technology: An encyclopedia (pp. 183-‐192). Santa Barbara: ABC-‐CLIO.
Social Network Analysis to Examine Interaction Patterns in Knowledge Building
Skvoretz, J., & Faust, K. (2002). Relations, species, and network structure [Online]. Journal of Social Structure, 3(3).
Wasserman, S., & Faust, K. (1994). Social network analysis (Vol. 1). New York: Cambridge University Press.
Watts, D. (2003). Six degrees. New York: W. W. Norton & Co.
Welser, H. T., Gleave, E., Fisher, D., & Smith, M. (2007). Visualizing the signatures of social roles in online discussion groups [Online]. Journal of Social Structure (JoSS), 8(2).
Zhang, J., Scardamalia, M., Reeve, R., & Messina, R. (2009). Designs for collective cognitive responsibility in Knowledge Building communities. The Journal of the Learning Sciences, 18, 7-‐44.